Mitigating COVID-19 Infection Disease Transmission in Indoor Environment Using Physical Barriers
←
→
Page content transcription
If your browser does not render page correctly, please read the page content below
Mitigating COVID-19 Infection Disease Transmission in Indoor

 Environment Using Physical Barriers
 Chen Ren1, Chang Xi1, Zhuangbo Feng1, Fuzhan Nasiri3, Shi-Jie Cao1,2*, Fariborz Haghighat3,1*

1
 School of Architecture, Southeast University, 2 Sipailou, Nanjing, 210096, China
2
 Global Centre for Clean Air Research, Department of Civil and Environmental Engineering, Faculty of
Engineering and Physical Sciences, University of Surrey, United Kingdom
3
 Energy and Environment Group, Department of Building, Civil and Environmental Engineering,
Concordia University, Montreal, H3G 1M8, Canada
*Corresponding email: shijie_cao@seu.edu.cn; haghi@encs.concordia.ca

Abstract

During the normalized phase of COVID-19, droplets or aerosol particles produced by infected
personnel are considered as the potential source of infection with uncertain exposure risk. As such,
in densely populated open spaces, it is necessary to adopt strategies to mitigate the risk of infection
disease transmission while providing sufficient ventilation air. An example of such strategies is use
of physical barriers. In this study, the impact of barrier heights on the spread of aerosol particles is
investigated in an open office environment with the well-designed ventilation mode and supply air
rate. The risk of infection disease transmission is evaluated using simulation of particle
concentration in different locations and subject to a number of source scenarios. It was found that a
barrier height of at least 60cm above the desk surface is needed to effectively prevent the
transmission of viruses. For workstations within 4m from the outlet, a 70cm height is considered,
and with a proper ventilation mode, it is shown that the barriers can reduce the risk of infection by
72%. However, for the workstations further away from the outlet (beyond 4m), the effect of
physical barrier cannot be that significant. In summary, this study provides a theoretical analysis for
implementing physical barriers, as a low-cost mitigation strategy, subject to various height scenarios
and investigation of their effectiveness in reducing the infection transmission probability.

Keywords:COVID-19; Infection risk assessment model; Physical barrier; Supply airflow rate;
Ventilation mode; Simulation

 1
1. Introduction

The outbreak of COVID-19 (Corona Virus Disease 2019) has had unprecedented impacts on the
society and governments globally (Hale et al. 2021, Munzert et al. 2021). As of March 11, 2021,
more than 200 countries, regions or territories around the world have recorded COVID-19 cases,
with more than 100 million confirmed cases along with more than 2 million deaths worldwide
(https://covid19.who.int/). Transmission of Novel Coronavirus can be divided into direct contact
transmission and airborne transmission. The direct contact refers to contact with infected patients,
which results in extremely high risk of infection, and airborne transmission through dispersed
droplets and aerosol, which presents an uncertain infection risk (Sakharov and Zhukov 2020, Chia
et al. 2020). Infected people spread virus particles when talking, coughing or sneezing, which
further adhere to the droplets of mucus and saliva (Raj, Velraj and Haghighat 2020). The aerosol
propagation is achieved by smaller droplets that could spread to far distances (Jayaweera et al.
2020). In the past, there were studies on other cases of diseases transmission by aerosol, such as
influenza (Malik Peiris, Poon and Guan 2009), SARS (Ignatius et al. 2004) and smallpox (Kiang
and Krathwohl 2003), which will be revisited in this study.
 Earlier studies have shown the influence of air distribution on spread of pollutants in a room.
(Li et al. 2020) reported that airflow pattern could have an important role in the Guangzhou
restaurant outbreak. (Dai and Zhao 2020, Park et al. 2020) claimed that the infection via aerosol can
be airborne beyond the immediate vicinity of infected person. (Ham 2020) reported on the role of
room air purifiers in the spread of COVID. In this sense, CDC and OSHA have recommended the
use of physical barriers between the workers to reduce exposure. This approach has been widely
applied to separate office workers, manufacturing workers, meat and poultry processing workers,
retail food service workers, etc. (CDC 2019, WHO 2020). The Canadian National Collaborating
Center for Environmental Health (NCCEH) published a guideline for use of such partitions
(NCCEH 2020).
 With the prospects of return to public places and workplaces in gradual transition to normal
circumstances, implementation of low-cost disease transmission strategies, in particular for open
spaces, is rather imperative. Even though physical isolation measures such as wearing masks (Liao
et al. 2021) and keeping social distance (Choi and Shim 2021) are reducing the transmission of

 2
aerosol particles, there is still a risk of virus infection within indoor environments. In this sense,
proper distribution of airflow and use of physical barriers can decrease the spreading of aerosol
particles, thus further reducing the risk of human infection (Xu et al. 2020). The critical factors
impacting indoor airflow distribution include ventilation mode (location and design of air diffusers)
as well as supply airflow rate (Bjorn and Nielsen 2002) (Lv et al. 2019) (Haghighat et al. 1996). In
case of physical barrier and air deflectors, the focus will be on large and open space (Lv et al. 2019)
(Dominguez Espinosa and Glicksman 2017). The goal is to effectively adopt forced interference
strategies (e.g., physical barrier) in the premise of appropriate and sufficient airflow. So far, no
systematic study has been done to investigate the effectiveness of such physical barriers on
preventing the disease transmission and to analyze its interference with HVAC systems under varied
operational and air diffuser location scenarios.
 This study considers a typical open space office, needing reasonable airflow design with the
presence of physical barriers, as low-cost prevention measures, in order to effectively mitigate
pollutant spreading from coughing and sneezing of infected occupants. In particular, the aim is to
study the effect of physical barrier heights as well as ventilation modes (varied supply air rates) on
dispersion and transmission of contaminants generated from infected source. This will be followed
by an analysis of the consequent infection risks as a measure of showing the effectiveness of these
strategies.

2. Materials and methods

This study investigates the impacts of physical barrier height on mitigating the spread of pollutants
and reducing the infection rate considering a well-designed ventilated open office. The ventilation
mode and supply air rate is adjusted based on occupancy and load information to ensure sufficient
ventilation air. The results of numerical simulation and grid independence are validated with
experimental test results. Considering various pollutant source/location scenarios, pollutant
dispersion and concentrations are simulated. On that basis, the infection probability (risk) in an
open office is analyzed (subject to scenarios of pollution location/source and barrier heights).

 3
2.1 Study design

This study was carried out in an open space office located in Sipailou Campus of Southeast
University in Nanjing, China, as shown in Fig. 1. The office dimensions are 9.8m (length) × 12.4m
(width) × 2.6m (height) with a volume of about 316m3. The office is equipped with 43 workstations;
each includes a staff member and a desk. The staff member is seated assuming a body size of 0.4m
(length) × 0.3m (width) × 1.1m (height), and a head (including neck) size of 0.2m (length) × 0.2m
(width) × 0.2m (height) and the mouth size of 2cm × 2cm. The dimension of desk is assumed as
1.2m (length) × 0.7m (width) × 0.8m (height) with 5 rows of desks in total.
 The office is equipped with an HVAC system of 6 ceiling-mounted air supply inlets and 1
ceiling-mounted return outlet (hereinafter referred to as current ventilation mode), as shown in Fig.
1. In current ventilation mode, the inlet size is 0.5m × 0.5m, with a square diffuser set up, and the
outlet size is 0.2m × 0.2m. To reduce energy waste, the minimum supply airflow rate of HVAC unit
is designed as 0.45m3/s according to GB50736-2012 (GB50736 2012), supplying a minimum fresh
air of 30m3/h per person. Additionally, supply air temperature is set to be a constant value of 25oC
in winter.
 The proper design of minimum airflow rate ensures that sufficient ventilation air is delivered to
personnel and their activity region to prevent poor air quality while maintaining acceptable energy
consumption. Such a design also depends on type and location of air diffusers. To avoid
oversupplying or undersupplying the conditioned air, Anand et al’s method was adopted to identify
a minimum required supply airflow rate based on occupancy and load information (Anand, Cheong
and Sekhar 2020). The fresh airflow rates for targeted zones are calculated as:

 � � = × + 1 (1)

where, ( Sf )min is the minimum required fresh air (m3/s); Spp is the minimum ventilation requirement
(0.0025m3/s) per person; O is the number of occupants; and S1L is calculated by the multiplication
of floor area A (m2) and SPA (ventilation required per unit floor area in ASHRAE standard 62.1–
2016, i.e., 2×10⁻³m3/s per m2) (Laue 2018). Then, the minimum required supply air rate Smin is
calculated as:

 = � � / % (2)
 4
where, OA% is the share of outdoor air (in percentage) in total room loads (including also loads
from human body, computers, lighting heat and walls), which are identified as thermal load of
8.1kW for the current office room. As per Anand’s work, Smin is calculated as 1.73m3/s (considering
OA% of 0.31 and a minimum fresh air requirement of 0.35m3/s). This is rather greater than the
minimum requirement set by the current air-conditioning system (0.45m3/s). In order to achieve a
well-mixed airflow distribution and provide sufficient ventilation air for each staff, the current
ventilation mode is adjusted with Smin calculated for a uniform distribution of inlets and outlets
locations. Fig. 2 displays the adjusted ventilation mode. A total of 4 inlets (square type air diffuser)
and 2 outlets were placed, with sizes of 0.5m × 0.5m and 0.2m × 0.2m, respectively. The airflow
distribution performance of such ventilation modes is further analyzed (see section 3).
 In this study, the physical barriers were located on the desk with heights of 0, 40, 50, 60 and
70cm (regardless of barrier thickness). Fig. 3 shows the specific setup of barrier heights and
locations. In addition, it was assumed that an infected person considered as source of COVID, who
produced droplets or aerosols containing viruses (with a coughing speed of 13m/s downwards at
27.5°) (Kwon et al. 2012, Li et al. 2021). Three typical positions for pollution source (infected
person) of A, B and C are selected representing alternative horizontal distances between personnel
and air diffusers, as demonstrated in Fig. 4. By symmetrically dividing the office area into three
annular zones, the infected persons are located in zone 1, 2 and 3.

 5
0.1m

 1.3m
 Outlet Mouth
 Inlet
 1.1m
 Desk Person

 2.6m
 0.8m
 Z
 Y
 X Person: head+body
 Inlet Mouth Y
 Outlet Head 2×2cm
 Body X
 Head
 Desk

 12.4m
 0.2×0.2m

 1.4m
 0.2×0.2m 0.4×0.3m 1.2m

 0.5×0.5m

 1.7m
 9.8m

Fig. 1. Layout of open office with 43 occupants (including body, head and mouth) and 5 rows of desks under the
 current ventilation mode with ceiling mounted supply inlets and outlet.

 0.1m
 1.3m

 Mouth
 Inlet Outlet
 1.1m
 Desk Person
 2.6m
 0.8m

 Z
 Y
 X Person: head+body
 Inlet Mouth Y
 Outlet Head 2×2cm
 Body X
 Head
 Desk
 12.4m

 0.2×0.2m
 1.4m

 0.2×0.2m 0.4×0.3m 1.2m

 0.5×0.5m
 1.7m

 9.8m

Fig. 2. Layout of open office under the modified ventilation mode with ceiling mounted supply inlets and outlets.

 6
0.1m

 1.3m
 Outlet Mouth
 Inlet
 1.1m
 Desk Board Person

 2.6m
 0.8m
 Z
 Y
 X Person: head+body

 Z Body Head
 1.2m Desk Barrier Barrier height: cm
 60 70
 50

 2.6m
 40
 0

 1.22m
 1.1m

 1.2m

 1.3m
 0.8m

 9.8m
 Inlet Barrier Y
 location
 Outlet
 Body X
 Head
 Desk

 12.4m
 9.8m

 Fig. 3. Setup of barrier height and location in the office.

 Zone1 Body Head
 Zone2
 Zone3
 Inlet
 Outlet

 Source B Source C

 Source A

Fig. 4. Arrangement of three annular zones 1, 2 and 3 along with the location of pollutant sources (infected person)
 A, B and C.
 7
2.2 Experimental study

Testo-405i wireless thermal anemometer was used for field measurement of air distribution and
temperature parameters, (ref., Fig. 1). The device can be operated and monitored using smart
phones making it suitable for remote measurement of airflow rate, temperature, duct airflow rate,
etc. Each measurement sample can last for 2 seconds. The anemometer measurement range for
temperature is from -20°C to +60°C, and for air speed is from 0 to 30m/s. The measurement
accuracy is estimated at ±0.5°C and ±0.1m/s with the resolution of 0.1°C and 0.01m/s, for
temperature and airflow rate, respectively. Fig. 5 presents a schematic diagram of the on-site
monitoring setup.

 1.6~2.4m

 1.2m

 0.8m
 0.4m

 0.85m
 Anemometer
 (a) (b)

 Fig. 5 Schematic diagram of on-site monitoring setup in the office (a): layout of thermal anemometer; (b):
 monitoring interface for smartphone

 Table 1 provides information about the experimental measurement conditions. The supply air
temperature is assumed to be constant at 25oC. The supply air velocity is adjusted at 0.3m/s
(corresponding to a minimum supply airflow rate of 0.45m3/s), and the number of seated staff in
this office is assumed 8. The coordinate point is defined as (x, y) = (4.5m, 1.55m), at the alternative
heights of 0.4, 0.8, 1.2, 1.6, 2.0 and 2.4m. For each measurement location, 10 sets of data are
obtained within 1 min intervals. In total, 60 groups of measurement samples of airflow rate and

 8
temperature were acquired.

Table 1 Outline of field test conditions.

 Experimental setup Personnel location (number = 8) Location of measuring points
 Current ventilation mode Y Y
 Supply air temperature: 25 oC X X
 Supply air velocity: 0.3m/s
 Outdoor temperature: 15 oC
 Test point
 ×
2.3 CFD simulation

Computational Fluid Dynamics (CFD) has been used to simulate and analyze the airflow,
temperature and pollutant concentration (Haghighat et al. 1992). The simulation cases are
configured considering incompressible and steady-state conditions. To reduce computational
intensity of CFD simulations, Reynolds-averaged Navier-Stokes (RANS) method is used (Shirzadi,
Tominaga and Mirzaei 2020). By using RANS models, the Re-Normalization Group (RNG) k-ε
model shows better performance for simulation of indoor environment (van Hooff and Blocken
2020). The standard form of governing equations is shown as:

∇ ∙ ( � ) = ∇ ∙ �Γ ∇ � + (3)

where, is the solving variables (i.e., velocity, temperature and concentration); ∇ ∙ ( � ) is the
convection term; is the density; � is the average velocity; ∇ ∙ �Γ ∇ � is the diffusion term; Γ
is the diffusion coefficient and is the source term.

The species-transport equation is solved leading to simulation of pollutant concentration and
distribution. We adopt a hypothesis that droplets or aerosols produced by an infected staff are the
main cause of airborne viruses and diseases, as small-sized particles can follow the airflow while
large-sized coarse particles deviate from the air streamline and deposit on the surfaces (Leng et al
2020). According to the WHO (World Health Organization) (Lawrence and Schone 2020), viruses
(e.g., COVID-19) spreads primarily through droplets of saliva or discharge when an infected person
coughs or sneezes. Droplets generally fall to the ground or other surfaces within 1m, while particles
(called aerosols) behave more like a gas compound traveling through the air to longer distances
with the risk of airborne transmission to people before settling on surfaces. In this study, a social
 9
distance of more than 1m is maintained between personnel. It is reasonable to simulate exhaled
droplets as gaseous pollutants. In doing so, a user-defined scalar (UDS) is used to simulate pollutant
fields, assuming that the influence of pollutants on airflow fields is negligible. In this sense, the
flow field along with turbulence characteristic determines the distribution of pollutants. Thus, the
diffusion coefficient for pollutant is defined as:

 Γ = � + � (4)

where, D is the Brownian diffusion coefficient of particles; is the turbulent diffusion coefficient

of particles. In UDS equations, the coefficient D is calculated with respect to particle diameter.
Considering previous studies on identification of droplet nuclei diameter (Ai et al. 2020), the size of
human respiratory droplet nuclei is assumed as 1μm, with a constant source intensity (i.e., releasing
concentration) of 1E-04 (quantum/m3), as a reference value for pollutant concentration .

 Before carrying out the numerical simulations, three groups of cases were set up for the grid
independence analysis. The corresponding case information is given in Table 2. The number of
mesh grids for three simulation cases is 3417313, 8982713 and 13011777, respectively. The settings
related to human personnel (ignoring breathing rate), supply air parameters and ventilation mode
are consistent with the experimental conditions given in Table 1. The boundary condition for the
diffuser opening is adopted from a previous studies (Huo et al. 2000). Moreover, external wall
temperature is set to 15 oC. The temperatures of human body, head and mouth are assumed constant
as 24 oC, 34 oC and 34 oC respectively. Fig. 6 compares the experimental tests and the predictions
provided by the numerical simulation as well as the grid independence analysis. It can be found that
the average deviation between the results of CFD simulation and field test is 18.5% for air velocity
and 6.1% for temperature. According to grid independence analysis, the simulation results using
8982713 and 13011777 mesh grids can show good agreement, with a deviation less than 5%.
Therefore, we employ the global setting with 8982713 mesh grids to carry out the simulation of
airflow, temperature and pollutant distributions.

 10
Table 2 Case information for grid independence analysis.
 Case No. Grid number Person location (red dotted line) Boundary conditions
 Case 1 3417313 Y current ventilation mode with airflow velocity
 Case 2 8982713 X of 0.3m/s and inlet temperature of 25℃
 Case 3 13011777 external wall temperature: 15℃
 body temperature: 24℃
 head (mouth) temperature: 34℃
 *ignoring personnel breathing rate

 (a) (b)

 Y × Test point
 X
 4.5m × 1.55m

 Fig. 6. Validations between experimental tests and numerical simulations as well as the grid independence
 analysis (a): airflow velocity; (b): indoor temperature.

Following the validation of grid independence, a total of 16 simulation cases are set up to calculate
the pollution concentration fields based on the velocity-temperature coupling fields considering
various combinations of ventilation modes (current and modified ventilation modes), source
location (A, B and C) and barrier height (0, 40, 50, 60 and 70cm). Table 3 provides an overview of
simulation cases. The current and modified ventilation modes are firstly compared with respect to
the airflow characteristics using cases 2 and 4. The parameters of pollutant source location and
barrier height are further explored in simulation cases 5-19 under modified ventilation mode. A
single pollutant source is considered, assuming an infected personnel with continuous coughing that
produces viruses (with an airflow velocity of 13m/s at the mouth downwards at 27.5°) (Kwon et al.
2012, Li et al. 2021) considering an airflow temperature of mouth as 36 oC (breathing rate for
remaining personnel is assumed negligible). In each simulation case, the single pollutant source is
placed in positions A, B or C, and the source intensity is set as 1E-04 (quantum/m3). Additionally,
the boundary conditions, including supply air velocity (by adopting diffuser opening) and
temperatures of external wall, human body and head are all consistent with the settings in Table 2.

 11
Table 3 Overview of simulation cases in this work.
 Case No. Mode Boundary conditions Pollutant source Barrier
 Case 4 Modified Supply air velocity: 0.3m/s No source No barrier
 Cases 5-19 ventilation Supply air temperature: 25℃ Location: A, B and C Barrier height
 (i.e., 3×5=15 mode External wall temperature: 15℃ *coughing rate of of 0, 40, 50, 60
 cases in total) Body temperature: 24℃ 13m/s downwards at and 70cm
 Head (mouth) temperature: 34℃ 27.5° with air
 *ignoring non-source breathing rate temperature of 36℃

2.4 Infection risk evaluation model

To analyze the infection risk levels of virus-associated pollutant, the Wells-Riley equation (Riley,
Murphy and Riley 1978), an infection risk assessment model is adopted to evaluate the infection
risk for personnel in the office. This analysis aims at investigating the potentials of physical barriers
in mitigating the transmission of virus in open space offices during the epidemic period. The
infection risk assessment model for individual personnel is expressed as follows (Buonanno, Stabile
and Morawska 2020):

 = �1 − �− ∗ � ( ) �� ∗ 100 (5)
 0

where, is the likelihood of infection, is the inhalation rate of the exposed subject (m3/h), t

represents the time (h), T is the total exposure time (h), and ( ) is the pollutant concentration
(quantum/m3). Assuming that the exposed subject is active, the IR value is set as 0.96 (m3/h)
(Buonanno et al. 2020). The exposure time is assumed as 1 hour, which is enough to allow an
evaluation of human infection possibility in different staff positions. By multiplying the above
likelihood with the number of exposed individuals, the number of susceptible people (called risk)
can be easily calculated during the exposure time.

3. Results

This section mainly presents the results of the numerical simulations as relate for evaluating the
impact of various barrier heights (0, 40, 50, 60 and 70cm) on air distribution, pollutant dispersion
and infection risk.
First, the airflow distribution performance of existing and modified ventilation modes is compared

 12
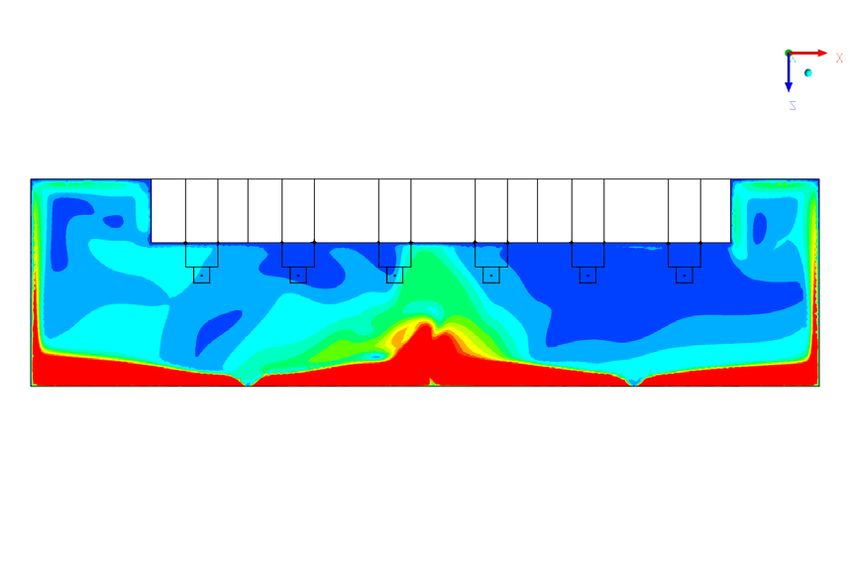
without physical barrier and pollutant source. Then, with reference to modified ventilation mode,
pollutant dispersion and infection probability of personnel in the open office are calculated and
discussed in line with infection risk assessment indicators, aiming to provide guidance on design
and implementation of physical barriers as a disease transmission mitigation strategy.

3.1 Analysis of airflow distributions of existing and modified ventilation modes

With reference to the existing ventilation system with a supply air volume of 0.45m3/s (ref., Fig. 1),
this study proposes a modified ventilation mode (ref., Fig. 2) with a larger supply air rate (1.73m3/s),
aiming to deliver sufficient ventilation air into the target activity areas. Fig. 7 displays distribution
of airflow field under current and modified ventilation modes at planes of x=3.3m, y=3.1m and
z=1.1m. The results points to an average velocity magnitude for modified ventilation mode that is
about 3.5 times higher than that of current ventilation system. According to Fig. 7 (b-c), the
ventilation air supplied to the occupied area is significantly increased in modified ventilation mode
due to a larger jet airflow that can be created by diffuser in order to reach the occupied areas along
the walls. In addition, it can be observed that the modified airflow pattern has a greater impact on
airflow uniformity compared to the current ventilation system, which is one of the disadvantages of
increasing the air change rate per hour (ACH).
 The Air Diffusion Performance Index (ADPI) is used to comprehensively compare the airflow
distribution performance of the two ventilation systems. ADPI is defined as the percentage of
measuring points that meet the effective blowing temperature and airflow velocity requirements
over the total number of measuring points in target areas (e.g., personnel activity areas), as shown in
equation (6).

 ∑
 =1( )
 = × 100% (6)
 ∑
 =1

where, Pi represents the measuring points in the target area (i=1, 2, …N, where N is the total
number of Pi); PEDT represents the measuring points that meet the temperature and velocity
requirements (j=1, 2, …M, where M is the number of PEDT); and EDT is the effective draft
temperature (oC) employed to evaluate the degree of blowing sensation in work area, as follows:
 = ( − ) − 9.1( − 0.15) (7)
where, tx represents the air temperature of the measuring points; tm represents the indoor mean

 13
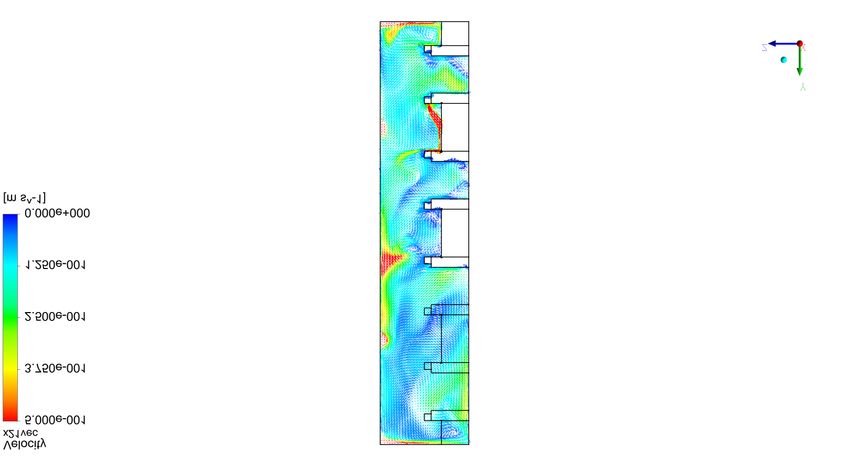
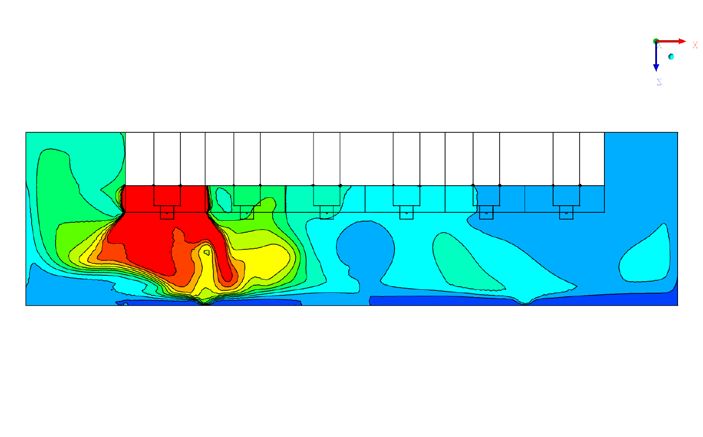
temperature; and vx represents the air velocity of the measuring points. When EDT value is varying
between -2.2 oC and 2 oC and air speed is greater than 0.2m/s, most people can feel comfortable (in
warm circumstances) (Liu and Novoselac 2015). Table 4 lists ADPI values for the current and
modified ventilation modes. As shown, airflow distribution of the modified ventilation mode is
more comfortable than the current one, with the improvement of three times (63.2%) for air
distribution performance. Hence, modified ventilation mode is preferred to ensure sufficient supply
air rate and personnel thermal comfort.
Thus, in the remaining part of this paper the modified ventilation mode (supply air rate of 1.73m3/s)
is used to investigate the impact of physical barriers height and the infected person location on the
infection dispersion.

 X=3.3m, Current ventilation mode X=3.3m, Modified ventilation mode
 Z
 (a)
 Y
 Y=3.1m, Current ventilation mode Y=3.1m, Modified ventilation mode
 Z
 (b)
 X
 Z=1.1m, Current ventilation mode Z=1.1m, Modified ventilation mode Velocity
 0.50

 0.40

 0.30

 0.20
 (c)
 0.10

 0.00
 [m·s^-1]
 Y
 X

 Fig. 7. Airflow distributions under current and modified ventilation modes at the planes of x=3.3m, y=3.1m and
 z= 1.1m (without setting physical barrier and pollutant source) [(a): current ventilation mode; (b): modified
 ventilation mode].

 14
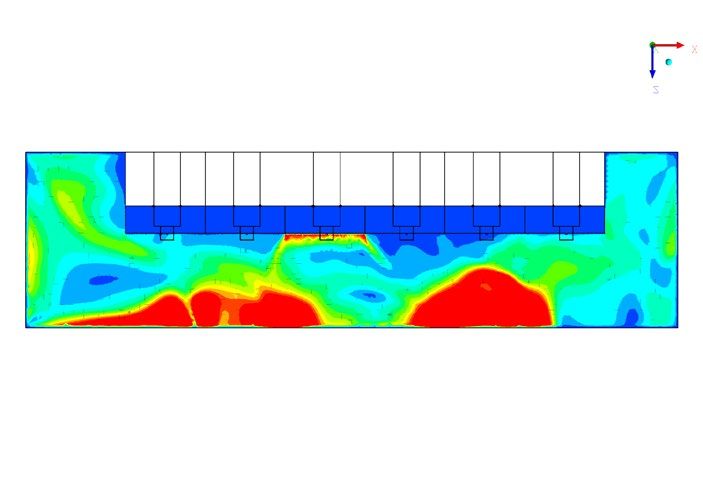
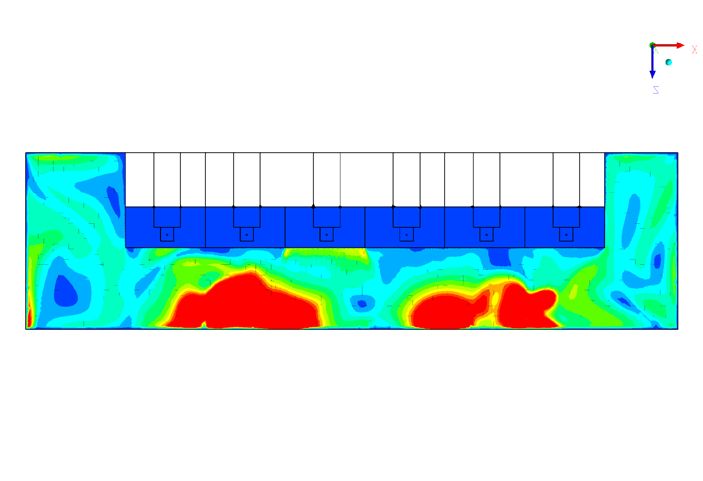
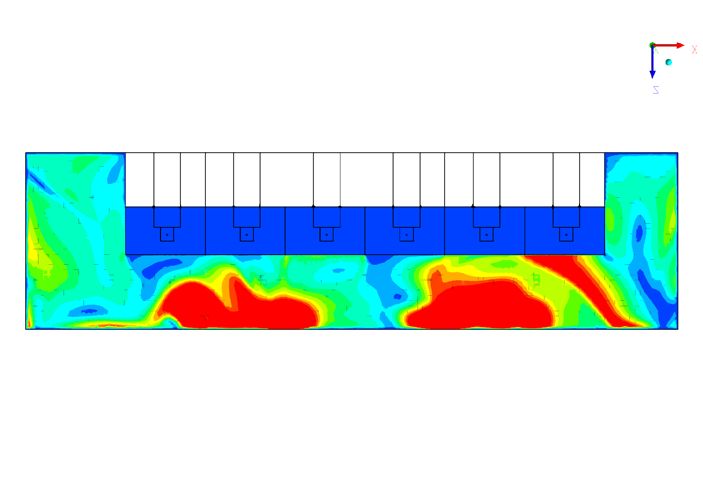
Table 4 ADPI for current and modified ventilation systems.

 Ventilation mode Supply air rate (m3/s) ADPI
 Current ventilation mode 0.45 21.0%
 Modified ventilation mode 1.73 84.2%

3.2 Influence of barrier height and pollutant source location on the airflow

distribution

Under modified ventilation mode, the influence of barrier heights (i.e., 0, 40, 50, 60 and 70cm) on
airflow distributions is analyzed for three pollutant source locations (A, B and C). Fig. 8 shows the
velocity distribution field at the planes of x=3.3m and y=3.1m for different physical barrier heights
for pollution source at location B. Fig. 9 illustrates the airflow distributions at the plane of z=1.1m
with the same conditions as Fig. 8. In case of physical barrier absence, the airflow generated by the
coughing at location B can directly follow to the breathing area of the opposite staff and spread to
the further area, as presented in Fig. 8 (a) and Fig. 9 (a). As the barrier height grows to above 40cm,
the airflow from the pollution source located at B can hit the physical barrier directly to form an
upward flow and exit through the outlet, as shown in Fig. 8 (b-e). If the height further increases, the
coughing airflow from personnel is well blocked by the barrier. According to Fig. 9 (b-d), as the
height of barrier gradually increases, less diffusion airflow spreads to the side regions close to
source B. With higher barrier heights, collision jet may be introduced into the working area to
further increase airflow volatility. In general, barrier height of at least 40cm has a sufficient effect
on airflow obstruction when the pollutant source is located at position B. The corresponding
non-uniformity effect can be more obvious for office areas where the height is 60cm or higher.

 15
X=3.3m, Barrier=0cm, Source B Y=3.1m, Barrier=0cm, Source B
 Velocity
 (a) 0.50

 X=3.3m, Barrier=40cm, Source B Y=3.1m, Barrier=40cm, Source B 0.40

 (b)
 0.30
 X=3.3m, Barrier=50cm, Source B Y=3.1m, Barrier=50cm, Source B
 0.20
 (c)
 X=3.3m, Barrier=60cm, Source B Y=3.1m, Barrier=60cm, Source B 0.10

 (d) 0.00
 [m·s^-1]
 X=3.3m, Barrier=70cm, Source B Y=3.1m, Barrier=70cm, Source B
Z Z
 (e)
 Y X
Fig. 8. Airflow distributions at the planes of x=3.3m and y=3.1m with the barrier heights of 0, 40, 50, 60 and
70cm under modified ventilation mode and pollution source of B [(a): height of 0cm; (b): height of 40cm; (c):
 height of 50cm; (d): height of 60cm; (e): height of 70cm].

 16
Z=1.1m, Barrier=0cm, Source B Z=1.1m, Barrier=40cm, Source B

 (a) (b)
 Velocity
 0.50

 0.40

 0.30

 Z=1.1m, Barrier=60cm, Source B Z=1.1m, Barrier=70cm, Source B
 0.20

 0.10

 0.00
 [m·s^-1]

 Y
 (c) (d)
 X

Fig. 9. Airflow distributions at the plane of z=1.1m with the barrier heights of 0, 40, 60 and 70cm under modified
ventilation system and pollution source B [(a): height of 0cm; (b): height of 40cm; (c): height of 60cm; (d): height
 of 70cm].

 Further simulations were carried out to verify the impact of physical barrier height on the
velocity fields through analyzing the cases with pollutant source locations at A and C, as shown in
Fig. 10 and Fig. 11. For pollutant source at location A (which is about 4m away from the outlet), the
barrier height of equal or above 40cm presents effective performance in blocking the airflow
generated by human coughing from entering into the adjacent working region. For pollutant source
in position C (close to the outlet), the barrier height of at least 40cm shows sufficient performance

 17
for airflow hindering, similar to conditions of pollutant sources A and B. Fig. 11 (b-c) and Fig. 11
(e-f) show the inhomogeneity of indoor airflow is also dramatically increased with the barrier height
set to 60cm or greater values. In summary, a barrier height of at least 40cm is recommended to
prevent the dispersion of virus from an infected occupant with unknown location in an open office.

 X=2.1m, Barrier=40cm, Source A Y=3.1m, Barrier=40cm, Source A

 (a)
 X=2.1m, Barrier=60cm, Source A Y=3.1m, Barrier=60cm, Source A
 Velocity
 (b) 0.50

 X=2.1m, Barrier=70cm, Source A Y=3.1m, Barrier=70cm, Source A 0.40

 (c) 0.30

 X=4.5m, Barrier=40cm, Source C Y=6.2m, Barrier=40cm, Source C
 0.20
 (d)
 0.10
 X=4.5m, Barrier=60cm, Source C Y=6.2m, Barrier=60cm, Source C

 0.00
 (e) [m·s^-1]
 X=4.5m, Barrier=70cm, Source C Y=6.2m, Barrier=70cm, Source C
 Z Z
 (f)
 Y X
 Fig. 10. Airflow distributions for different profiles with the barrier heights of 40, 60 and 70cm and pollution
source located A and C [(a): planes of x=2.1m and y=3.1m with barrier height of 40cm and source at point A; (b):
 planes of x=2.1m and y=3.1m with barrier height of 60cm and source at point A; (c): planes of x=2.1m and
 y=3.1m with barrier height of 70cm and source at point A; (d): planes of x=4.5m and y=6.2m with barrier height
of 40cm and source at point C; (e): planes of x=4.5m and y=6.2m with barrier height of 60cm and source at point
 C; (f): planes of x=4.5m and y=6.2m with barrier height of 70cm and source at point C].

 18
Z=1.1m, Barrier=40cm, Source A Z=1.1m, Barrier=40cm, Source C

 (a) (d)

 Velocity
 Z=1.1m, Barrier=60cm, Source A Z=1.1m, Barrier=60cm, Source C
 0.50

 0.40

 0.30
 (b) (e)
 0.20

 0.10

 0.00
 Z=1.1m, Barrier=70cm, Source A Z=1.1m, Barrier=70cm, Source C [m·s^-1]
 Y

 X

 (c) (f )

Fig. 11. Airflow distributions at the plane of z=1.1m with the barrier heights of 40, 60 and 70cm under modified
ventilation mode and pollution sources of A and C [(a): height of 40cm and source of A; (b): height of 60cm and
 source of A; (c): height of 70cm and source of A; (d): height of 40cm and source of C; (e): height of 60cm and
 source of C; (f): height of 70cm and source of C].
 19
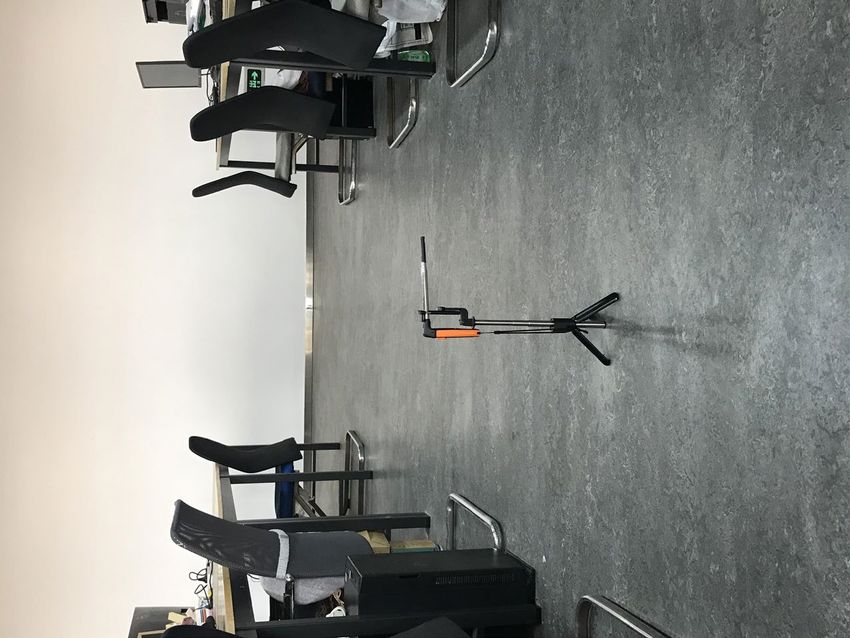
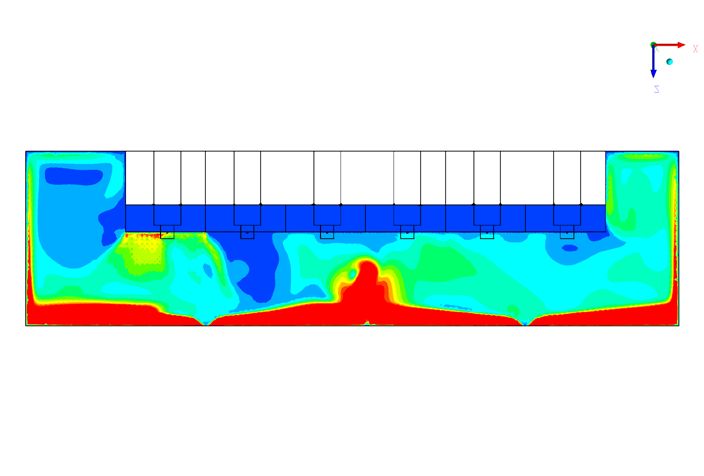
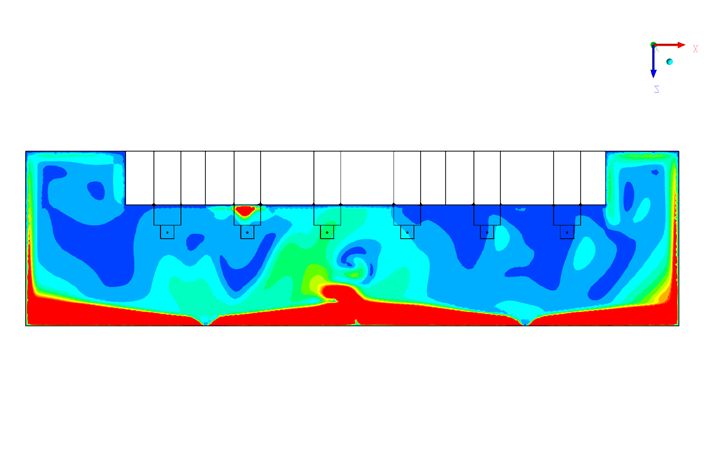
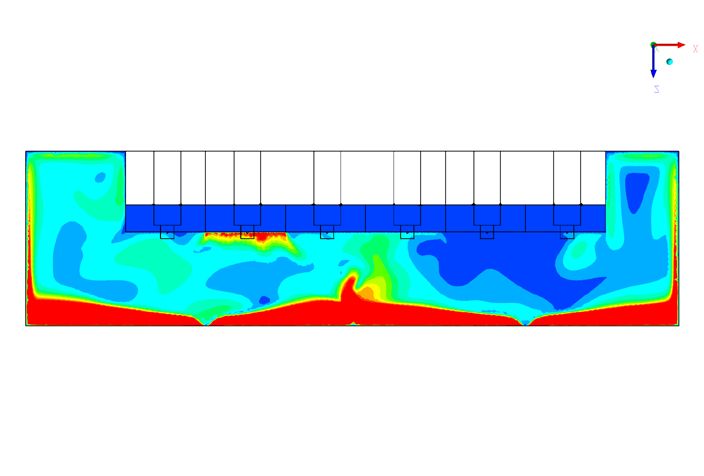
3.3 Influence of barrier height and pollutant source location on the pollutant

dispersion

It is necessary to further investigate the performance of barrier height in combination with the
influence of airflow on pollutant dispersion. Fig. 12 presents the relative pollutant concentrations
(C/Cref) for the planes of x=3.3m and y=3.1m for the barrier heights of 0, 40, 50, 60 and 70cm and
pollutant source located at B. Fig 13 also shows the pollutant distributions at the plane of z=1.1m
with the same conditions as above. The results of concentration analysis point to the fact that with
no barrier, pollutant can disperse to distant regions up to 9m according to the law of airflow motion,
as shown in Fig. 12 (a) and Fig. 13 (a). Roughly 16 occupants have relative concentration values of
above 0.6% in their working area. As the height of physical barrier increase to 40cm, it starts to
show a blocking effect on pollutant dispersion as displayed in Fig. 12 (b), corresponding to the
work zone of about 11occupants, as shown in Fig. 13 (b). With the barrier height increases above
50cm (i.e., 60cm and 70cm), the obstructive effect towards pollutant is more obvious, as shown in
Fig. 12 (d-e) and Fig. 13 (c-d).

 X=3.3m, Barrier=0cm, Source B Y=3.1m, Barrier=0cm, Source B
 C / C ref
 (a) 2.0%

 X=3.3m, Barrier=40cm, Source B Y=3.1m, Barrier=40cm, Source B
 1.6%
 (b)
 1.2%
 X=3.3m, Barrier=50cm, Source B Y=3.1m, Barrier=50cm, Source B

 (c) 0.8%

 X=3.3m, Barrier=60cm, Source B Y=3.1m, Barrier=60cm, Source B 0.4%

 (d) 0.0%
 X=3.3m, Barrier=70cm, Source B Y=3.1m, Barrier=70cm, Source B
 Z Z
 (e)
 Y X
 Fig. 12. Pollutant concentrations (C/Cref) for the planes of x=3.3m and y=3.1m under modified ventilation mode
 with the barrier heights of 0, 40, 50, 60 and 70cm and pollutant source at point B [(a): height of 0cm; (b): height
 of 40cm; (c): height of 50cm; (d): height of 60cm; (d): height of 70cm].
 20
Z=1.1m, Barrier=0cm, Source B Z=1.1m, Barrier=40cm, Source B
 (a) (b)

 C / C ref
 2.0%

 1.6%

 1.2%
 Z=1.1m, Barrier=60cm, Source B Z=1.1m, Barrier=70cm, Source B
 (c) (d) 0.8%

 0.4%

 0.0%

 Y
 X

Fig. 13. Pollutant concentrations (C/Cref) for the plane of z=1.1m under modified ventilation mode with the barrier
 heights of 0, 40, 60 and 70cm and pollutant source at point B [(a): height of 0cm; (b): height of 40cm; (c): height
 of 60cm; (d): height of 70cm].

Further analyze was carried out to study the influence of different barrier heights on pollutant
dispersion by comparing the simulation results for pollutant source located at point A and C along
with barrier heights of 40, 60 and 70cm, as displayed in Fig. 14 and Fig. 15. For pollutant source at
A, the hindering effect of physical barrier on the pollution dispersion is not as obvious as that of
 21
source of B, as shown in Fig. 12 and Fig. 14 (a-c). The ranges of relative concentration above 0.6%
correspond to the working areas for 18, 3 and 0 occupants with barrier heights of 40, 60 and 70cm,
respectively, according to Fig. 15 (a-c). It is observed that the airflow propagation is affected by the
barrier height. However, as pollutant source A is far away from the air outlet, there will be a slow
diffusion state for pollutants. For pollution source located at position C, the average relative
concentration values are decreased by 23% and 15% in comparison with pollution sources at point
A and B, respectively (with a barrier height of 40cm). As per Fig. 14 (d-f) and Fig. 15 (d-f), most of
pollutants produced by a infected person can be directly discharged from indoor space since the
location of source C is rather close to the outlet, as shown in Fig. 4. Appendix A shows an unsteady
dispersion process of pollutant lasting up to 100s following a cough at position C. In case of
pollution source at point C, the number of occupied areas with a relative concentration value (C/Cref)
above 0.6%, will be 1 if the barrier height is 40cm, as shown in Fig. 15 (d). It is observed that if the
height is further increased, the performance of physical barrier will improve with dispersion of
pollution becoming negligible such that no relative pollutant concentration of above 0.6% could be
observed in occupied areas. In summary, under modified ventilation mode, for a pollution source
close to outlet (i.e., pollutant source at B and C), the barrier height of at least 60cm can show a
favorable effect on the pollutant hindering. While for a source position far from the outlet (i.e.,
pollutant of A), blocking effect of increasing the barrier height is no longer obvious and only
reaches an acceptable level with a height of 70cm or more. Thus, in terms of pollutant dispersion
with unclear location of infected person, the barrier height of 60cm can provide good blocking
effect against pollution dispersion. For regions far from the outlet (with a radius distance of larger
than 4m) or those located at zone 3 (shown in Fig. 4), a 70cm height (or more) may not be effective
in obstructing the spread of contaminant. In these circumstances, locations in distant areas of zone 3
and faraway from the air outlet may not be recommended for workstations.

 22
X=2.1m, Barrier=40cm, Source A Y=3.1m, Barrier=40cm, Source A

 (a)
 X=2.1m, Barrier=60cm, Source A Y=3.1m, Barrier=60cm, Source A
 C / C ref
 (b) 2.0%

 X=2.1m, Barrier=70cm, Source A Y=3.1m, Barrier=70cm, Source A
 1.6%
 (c)
 1.2%
 X=4.5m, Barrier=40cm, Source C Y=6.2m, Barrier=40cm, Source C
 0.8%
 (d)
 X=4.5m, Barrier=60cm, Source C Y=6.2m, Barrier=60cm, Source C 0.4%

 (e) 0.0%
 X=4.5m, Barrier=70cm, Source C Y=6.2m, Barrier=70cm, Source C
 Z (f) Z
 Y X
 Fig. 14. Pollutant concentrations (C/Cref) for different profiles under modified ventilation mode with the barrier
 heights of 40, 60 and 70cm and pollutant sources located at A and C [(a): planes of x=2.1m and y=3.1m with
 barrier height of 40cm and source at point A; (b): planes of x=2.1m and y=3.1m with barrier height of 60cm and
source at point A; (c): planes of x=2.1m and y=3.1m with barrier height of 70cm and source at point A; (d): planes
of x=4.5m and y=6.2m with barrier height of 40cm and source at point C; (e): planes of x=4.5m and y=6.2m with
 barrier height of 60cm and source at point C; (f): planes of x=4.5m and y=6.2m with barrier height of 70cm and
 source at point C].

 23
Z=1.1m, Barrier=40cm, Source A Z=1.1m, Barrier=40cm, Source C

 (a) (d)

 Z=1.1m, Barrier=60cm, Source A Z=1.1m, Barrier=60cm, Source C C / C ref
 2.0%

 1.6%

 1.2%
 (b) (e)
 0.8%

 0.4%

 0.0%
 Z=1.1m, Barrier=70cm, Source A Z=1.1m, Barrier=70cm, Source C
 Y

 X

 (c) (f )

Fig. 15. Pollutant concentrations (C/Cref) at the plane of z=1.1m under modified ventilation mode with the barrier
heights of 40, 60 and 70cm and pollutant sources at point A and C [(a): height of 40cm and source at A; (b): height
 of 60cm and source at A; (c): height of 70cm and source at A; (d): height of 40cm and source at C; (e): height of
 60cm and source at C; (f): height of 70cm and source at C].
 24
3.4 Infection risk assessment for different barrier heights and pollution source

locations

In this section, in line with the infection risk assessment model presented in equation (5), the
influence of barrier heights (0, 40, 50, 60 and 70cm) on occupant infection possibility (likelihood) is
analyzed for pollutant source located at A, B and C. With a single source of pollution (one occupant
infected out of 43), the maximum infection risk for other 42 occupants is estimated. In case of
numerous pollution sources, one could adopt a linear ventilation model (LVM) to rapidly obtain the
corresponding concentration fields (Ren and Cao 2020), i.e., utilizing the principle of linear
superposition to calculate the infection risk for multiple pollutant sources. Fig. 16 depicts occupant
infection risk corresponding to various barrier heights and pollution source locations. Without a
physical barrier, the infection risk for a single source of pollution located at point A, B or C
positions could be up to 100%. With implementation of barriers of 40cm and 50cm, the infection
risk can be reduced to 59% and 63%, respectively, for source C. If physical barrier height is above
50cm, infection probability, with a pollutant source at A, can be decreased to 37% and 25%,
corresponding to the barrier heights of 60cm and 70cm, respectively. In case of a pollution source at
B, a barrier height of 60cm can reduce the infection risk to about 20%, but infection probability
does not significantly decrease with further increase of height. In case of a pollution source at C,
infection risk can remain steadily below 10% if barrier height is increased to 60-70cm. In sense, due
to the unknown location of infected personnel in an open office, a barrier height of at least 60cm
would be appropriate for the workstations close to the outlet (with a maximum distance less than
4m) or located in zones 1 and 2 (as shown in Fig. 4). In case of zone 3 (which is away from the air
outlet), a 70cm physical barrier height shows only a limited effect in reducing infection risk. As
such, it may be preferable to recommend occupant to stay away from the certain areas located at
zone 3 as shown in Fig. 4.

 25
100%
 100%
 100%

 63%
 Source B
 Source C
 59%
 47% Source A
 41%
 43% 37%
 37%
 25%
 21% 18%

 9% 7%

 Fig. 16. Infection risk (exposure time is 1 hour) for single pollutant source at location A, B or C, and barrier
 heights of 0, 40, 50, 60 and 70-cm.

 Fig. 17 shows a comparison of infection risks for personnel considering three alternative
pollutant source locations of A, B and C, and barrier heights of 0, 40, 50, 60 and 70cm. As the
barrier height increases, the blocking performance is further improved compared to the situation
with no physical barrier. The barrier heights of 60-70cm can prevent the infection risk to 21%. With
a physical barrier height of 60cm, the infection risk has largely decreased to its minimum value,
followed by almost no further improvement. In general, if the number of pollutant sources increases
to 3, the mitigation of infection risk with barrier heights of above 60cm is no longer significantly
different from that of a single source at either location of A, B and C. In case of an unidentified
number of pollution sources, a barrier height of at least 60cm can be effective for mitigation of
infection with sufficient supply air rate (modified ventilation mode).

 26
93%

 Source B
 Source C
 Source A

 Reduction up to
 72%
 47%

 36%

 21% 21%

 Fig. 17. Infection risk (exposure time is 1 hour) for multiple pollutant sources (A, B and C) with modified
 ventilation mode and barrier heights of 0, 40, 50, 60 and 70cm.

4. Discussion

With COVID-19 pandemic, it is critical for open offices to adopt infection mitigation strategies
such as use of low-cost physical barriers and/or personnel protection devices. Using CFD
simulation, this study analyzed the effectiveness of various heights for physical barriers in hindering
pollutant dispersion and reducing infection risk assuming 1 to 3 pollutant sources (infected
occupants). It is observed that a barrier height of at least 60cm can be more suitable for
workstations at a distance of less than 4 m from the outlet (i.e., zones 1 and 2 as shown in Fig. 4).
The effectiveness of barriers with a height of 70cm is limited in reducing infection risk for zone 3,
which is further away from the air outlet. It may be advisable for occupants to stay away from
certain areas such as zone 3, as shown in Fig. 4. Three additional cases are supplemented as shown
in Table 5. Fig. 18 showed the simulation results for distribution of pollutant concentration field
(C/Cref) at different planes in case of pollutant source at location A with a barrier height of 80cm,

 27
and in case of pollutant sources at location A1 and A2 with a barrier height of 70cm. According to
Fig. 18 (a), it could be observed that a barrier height below 80cm and pollutant source located at A
(around 4.2m away from the outlet), the obstruction effect was not varying from the case with a
barrier height of 70cm (as shown in Fig. 14 and Fig. 15), in which the maximum infection rate was
calculated as 24.3% (ref., Table 5). According to the simulation results presented in Fig. 18 (b), for
a barrier height of 70cm and pollutant source location at A1 (6.5m away from the outlet), dispersion
of pollutants cannot be effectively suppressed below an infection risk of 27.3%, as shown in Table
5. If the location of pollutant source is in zone 2, 3.8m from the air outlet, the pollutant dispersion
could be restricted with a barrier height of at least 60cm, such that the personnel infection rate could
be reduced to 23%, as shown in Fig. 18 (c) and Table 5. Hence, it is not recommended for
personnel to stay at zone 3 as the mitigation effect of physical barriers cannot be significantly
exploited.

Table 5 Overview of additional cases for validation in this work.
 Case No. Mode Boundary Pollutant source Barrier Infection risk
 Case 20 Modified As same as Table 3, 80cm 24.3%
 ventilation supply air velocity: 0.3m/s
 mode Supply air temperature: 25
 o
 C
 Source A
 External wall temperature:
 Case 21 15 oC 70cm 27.3%
 Body temperature: 24 oC
 Head temperature: 34 oC
 Mouth temperature: 34 oC
 Source A1
 *coughing rate of 13m/s
 Case 22 downwards at 27.5° with 60cm 23.0%
 air temperature of 36 oC
 *ignoring non-source
 breathing rate
 Source A2

 28
(a) (b) (c)
 X=2.1m, Barrier=80cm, Source A X=2.1m, Barrier=70cm, Source A1 X=3.3m, Barrier=60cm, Source A2
 Z
 Source A Source A1 Source A2 Y
 Y=3.1m, Barrier=80cm, Source A Y=0.1m, Barrier=70cm, Source A1 Y=3.1m, Barrier=60cm, Source A2
 Z

 Source A Source A1 Source A2 Y
 Z=1.1m, Barrier=80cm, Source A Z=1.1m, Barrier=70cm, Source A1 Z=1.1m, Barrier=60cm, Source A2 C / C ref
 2.0%

 1.6%

 1.2%

 0.8%

 4.2m 6.5m 3.8m 0.4%

 0.0%
 Source A Source A1 Source A2 Z
 Y
 Fig. 18. Pollutant concentrations (C/Cref) at different planes under pollutant source of A with barrier height of
 80cm and under pollutant sources of A1 and A2 with barrier height of 70cm [(a): planes of x=2.1m, y=3.1m and
 z=1.1m with barrier height of 80cm and source of A; (b): planes of x=2.1m, y=0.1m and z=1.1m with barrier
 height of 70cm and source of A1; (c): planes of x=3.3m, y=3.1m and z=1.1m with barrier height of 70cm and
 source of A2].

In simulation, it was assumed that pollution (in form of aerosols) behaves like a gas (as shown in
Appendix A), while the droplets (large-sized coarse particles) from human coughing are assumed to
fall to the ground or other surfaces in about 1m from the source. In a real-life situation, the
evaporation of liquid droplets to liquid core (changing from large particles to small ones) is also
critical in simulation of pollutant dispersion produced by coughing or sneezing. A detailed source
setting needs to be further taken into account to improve the accuracy of pollutant concentration
simulations.
 To ensure sufficient ventilation air delivered to workstations, evaluation of the influence of
different ventilation modes and diffuser types on airflow distribution and pollutant dispersion could
be a future avenue of research. It is observed in simulation results, that the infection risk in areas
less that 4m from the outlet is well reduced. Understanding the effect of ventilation system on
airflow and pollutant concentration, implementation of physical barriers can further reduce the
possibility of infection risk (e.g., at least 60cm height of physical barrier above the desk surface of

 29
80cm for region within 4m from the outlet). However, for a poorly-designed air conditioning
system without sufficient ventilation air and uniform air diffuser locations, the effect of barrier
height in reducing the infection rate remains to be verified. Moreover, it is essential to integrate
these prevention strategies (such as physical barriers) with related control techniques, such as
multi-mode ventilation system (Shao et al. 2017), intelligent and online monitoring of air condition
systems (Cao and Ren 2018), demand-controlled supply air devices (Haddad et al. 2021). The
design of physical barriers or air conditioning systems (including supply air openings and pipelines)
has to be in line with functional and aesthetic requirements. The optimization of design and costing
can further help to meet the needs of different groups of people and achieve broader application
prospects.

5. Conclusions

This study analyzed the influence of barrier heights (0, 40, 50, 60 and 70cm) on reducing pollutant
dispersion and infection risk in an open office with a well-designed ventilation mode and subject to
alternative pollutant source locations. This work provides a basis for analysis of the performance of
physical protection measures in open spaces through simulating the gaseous pollutant dispersion
and calculating an infection possibility. The main conclusions could be listed as follows:

(1) In terms of airflow blocking, a barrier height of at least 40cm above the desk level (at 80cm) is
 recommended to prevent the effect of coughing airflow of an infected personnel with an
 unknown location in the open office subject to a modified ventilation mode.
(2) A barrier height of 60cm can show a considerable performance in case of pollution sources
 closer to outlet. In case of source positions more than 4 m from the outlet (at zone 3), a barrier
 height 70cm or more is not further effective in obstructing pollutant dispersion, and thus, this
 area is not recommended for placement of workstations.
(3) In case location and number of infection personnel is unknown, a barrier height of at least 60cm
 above the desk level is recommended provided a sufficient ventilation rate. This could decrease
 the infection risk by 72%. It is recommended to advise the personnel to work in zones 1 and 2
 (within 4m of the outlet) to enhance the effectiveness of the physical barriers.

 30
Acknowledgement

The authors would like to acknowledge the supports from the Natural Science Foundation of China
(Grand No. 51778385), and Concordia University – Canada, through the Concordia Research Chair
– Energy & Environment.

 Nomenclature
 COVID-2019 Corona Virus Disease 2019
 SARS Severe Acute Respiratory Syndrome
 CDC Centers for Disease Control and Prevention
 OSHA Occupational Safety and Health Administration
 NCCEH Canadian National Collaborating Center for Environmental Health
 HVAC Heating Ventilation Air Conditioning
 Sf Minimum required fresh air (m3/s)
 Spp Minimum ventilation requirement per person (m3/s)
 O Number of occupant
 S1L Multiplication of floor area and SPA (m3/s)
 A Floor area (m2)
 SPA Ventilation required per unit floor area in ASHRAE standard 62.1–2016 (m3/s per m2)
 Smin Minimum required supply air rate (m3/s)
 OA% Share of outdoor air (in percentage) in total room loads
 CFD Computational Fluid Dynamics
 RANS Reynolds-averaged Navier-Stokes
 RNG Re-Normalization Group
 φ Solving variables (i.e., velocity, temperature and concentration)
 ρ Density (kg/m3)
 u� Average velocity (m/s)
 Γφ Diffusion coefficient
 Sφ Source term
 WHO World Health Organization
 UDS User-Defined Scalar
 D Brownian diffusion coefficient of particles
 νp Turbulent diffusion coefficient of particles
 Cref Reference value for pollutant concentration
 C/Cref Relative concentration value
 Rinf Likelihood of infection (%)
 IR Inhalation rate of the exposed subject (m3/h)
 t Exposure time (h)
 T Total exposure time (h)
 C (t) Pollutant concentration (quantum/m3)
 ACH Air change rate per hour
 ADPI Air Diffusion Performance Index
 Pi Measuring points in the target area

 31
N Total number of Pi
 PEDT Measuring point meeting the temperature and velocity requirements
 M Number of PEDT
 EDT Effective draft temperature (oC)
 tx Air temperature of the measuring points ((oC))
 tm Indoor mean temperature (oC)
 vx Velocity of the measuring points (m/s)
 LVM Linear ventilation model

Reference:

Ai, Z. T., Mak, C. M., Gao, N. P. & Niu, J. L. (2020) Tracer gas is a suitable surrogate of exhaled droplet nuclei for
 studying airborne transmission in the built environment. Building Simulation, 13, 489-496.
Anand, P., Cheong, D. & Sekhar, C. (2020) Computation of zone-level ventilation requirement based on actual
 occupancy, plug and lighting load information. Indoor and Built Environment, 29, 558-574.
Bjorn, E. & Nielsen, P. V. (2002) Dispersal of exhaled air and personal exposure in displacement ventilated rooms.
 Indoor Air, 12, 147-164.
Buonanno, G., Stabile, L. & Morawska, L. (2020) Estimation of airborne viral emission: Quanta emission rate of
 SARS-CoV-2 for infection risk assessment. Environment International, 141, 105794.
Cao, S. J. & Ren, C. (2018) Ventilation control strategy using low-dimensional linear ventilation models and artificial
 neural network. Building and Environment, 144, 316-333.
CDC (2019) Manufacturing Workers and Employers, Interim Guidance from CDC and OSHA. accessed, May 30 2020,
 https://www.cdc.gov/coronavirus/2019-ncov/community/guidance-manufacturing-workers-employers.html.
Chia, P. Y., Coleman, K. K., Tan, Y. K., Ong, S. W. X., Gum, M., Lau, S. K., Lim, X. F., Lim, A. S., Sutjipto, S., Lee, P.
 H., Son, T. T., Young, B. E., Milton, D. K., Gray, G. C., Schuster, S., Barkharn, T., De, P. P., Vasoo, S., Chan,
 M., Ang, B. S. P., Tan, B. H., Leo, Y. S., Ng, O. T., Wong, M. S. Y. & Marimuthu, K. (2020) Detection of air
 and surface contamination by SARS-CoV-2 in hospital rooms of infected patients. Nature Communications, 11,
 2800.
Choi, W. & Shim, E. (2021) Optimal strategies for social distancing and testing to control COVID-19. Journal of
 Theoretical Biology, 512, 110568.
Dai, H. & Zhao, B. (2020) Association of the infection probability of COVID-19 with ventilation rates in confined
 spaces. Building Simulation, 13, 1321-1327.
Dominguez Espinosa, F. A. & Glicksman, L. R. (2017) Effect of furniture and partitions on the surface temperatures in
 an office under forced flow. Energy & Buildings, 147, 155-165.
GB50736 (2012) Design code for heating ventilation and air conditioning of civil buildings. Ministry of Housing and
 Urban-Rural Development, China.
Haddad, S., Synnefa, A., Marcos, M. A. P., Paolini, R., Delrue, S., Prasad, D. & Santamouris, M. (2021) On the
 potential of demand-controlled ventilation system to enhance indoor air quality and thermal condition in
 Australian school classrooms. Energy and Buildings, 238, 110838.
Haghighat, F., Huo, Y., Zhang, J. S. & Shaw, C. Y. (1996) The influence of office furniture, workstation layouts, diffuser
 types and location on indoor air quality and thermal comfort conditions at workstations. Indoor Air, 6, 188-203.
Haghighat, F., Jiang, Z., Wang, J. C. Y. & Allard, F. (1992) Air Movement In Buildings Using Computational
 Fluid-Dynamics. Journal of Solar Energy Engineering-Transactions of the ASME, 114, 84-92.
Hale, T., Angrist, N., Goldsamidt, R., Kira, B., Petherick, A., Phillips, T., Webster, S., Cameron-Blake, E., Hallas, L.,
 32
Majumdar, S. & Tatlow, H. (2021) A global panel database of pandemic policies (Oxford COVID-19
 Government Response Tracker). Nature Human Behaviour, Published online, DOI:
 10.1038/s41562-021-01079-8.
Ham, S. (2020) Prevention of exposure and dispersion of COVID-19 using air purifiers: challenges and concerns.
 Epidemiology and Health, 42, e2020027.
Huo, Y., Haghighat, F., Zhang, S. & Shaw, C. Y. (2000) A systematic approach to describe the air terminal device CFD
 simulation for room air distribution analysis. Building and Environment, 35, 563-576.
Ignatius, T. S. Y., Tam, W., Lee, J. H. W., Leung, D. Y. C., Ho, T., Yugou, L., Tze Wai, W. & Chan, A. T. (2004)
 Evidence of airborne transmission of the severe acute respiratory syndrome virus. The New England Journal of
 Medicine, 350, 1731.
Jayaweera, M., Perera, H., Gunawardana, B. & Manatunge, J. (2020) Transmission of COVID-19 virus by droplets and
 aerosols: A critical review on the unresolved dichotomy. Environmental Research, 188.
Kiang, K. M. & Krathwohl, M. D. (2003) Rates and risks of transmission of smallpox and mechanisms of prevention.
 The Journal of Laboratory and Clinical Medicine, 142, 229-238.
Kwon, S. B., Park, J., Jang, J., Cho, Y., Park, D. S., Kim, C., Bae, G. N. & Jang, A. (2012) Study on the initial velocity
 distribution of exhaled air from coughing and speaking. Chemosphere, 87, 1260-1264.
Laue, J. (2018) ASHRAE 62.1: using the ventilation rate procedure. Consulting Specifying Engineer, 55, 14-17.
Lawrence, J. & Schone, P. E. (2020) Guidance for building operations during the COVID-19 pandemic. ASHRAE
 Journal, May, 72-74.
Leng, J., Wang, Q. & Liu, K. (2020) Sustainable design of courtyard environment: From the perspectives of airborne
 diseases control and human health. Sustainable Cities and Society, 62, 102405.
Li, H. Y., Leong, F. Y., Xu, G., Kang, C. W., Lim, K. H., Tan, B. H. & Loo, C. M. (2021) Airborne dispersion of droplets
 during coughing: a physical model of viral transmission. Scientific Reports, 11, 1-10.
Li, Y. G., Qian, H., Hang, J., Chen, X. G., Hong, L., Liang, P., Li, J. S., Xiao, S. l., Wei, J. J., Liu, L. & Kang, M. (2020)
 Evidence for probable aerosol transmission of SARS-CoV-2 in a poorly ventilated restaurant. MedRxiv,
 Preprint, DOI: https://doi.org/10.1101/2020.04.16.20067728.
Liao, M. R., Liu, H. Y., Wang, X., Hu, X. Z., Huang, Y. H., Q., L. X., K., B., J., M., M., N. & Lu, J. R. (2021) A
 Technical Review of Face Mask Wearing in Preventing Respiratory COVID-19 Transmission. Current Opinion
 in Colloid & Interface Science, 52, 101417.
Liu, S. C. & Novoselac, A. (2015) Air Diffusion Performance Index (ADPI) of diffusers for heating mode. Building and
 Environment, 87, 215-223.
Lv, Y., Wang, H., Zhou, Y., Yoshino, H., Yonekura, H., Takaki, R. & Kurihara, G. (2019) The influence of ventilation
 mode and personnel walking behavior on distribution characteristics of indoor particles. Building and
 Environment, 149, 582-591.
Malik Peiris, J. S., Poon, L. L. M. & Guan, Y. (2009) Emergence of a novel swine-origin influenza A virus (S-OIV)
 H1N1 virus in humans. Journal of Clinical Virology, 45, 169-173.
Munzert, S., Selb, P., Gohdes, A., Stoetzer, L. F. & Lowe, W. (2021) Tracking and promoting the usage of a COVID-19
 contact tracing app. Nature Human Behaviour, 5, 247-255.
NCCEH (2020) Physical Barriers for COVID-19 Infection Prevention and Control in Commercial Settings. accessed
 May 13, 2020,
 https://ncceh.ca/content/blog/physical-barriers-covid-19-infection-prevention-and-control-commercial-settings.
Park, S. Y., Kim, Y. M., Yi, S., Lee, J., Gwack, S. S., Kim, M., Kim, S., Kweon, O., Park, Y., Park, E. K., Jeong, B. J.,
 Kim, J. i., Kim, H. S., Kim, Y. B., NaKim, C. B., Park, Y., Huh, I. S., Kim, H. K., Yoon, H. J., Jang, H., Kim,
 K., Chang, Y., Kim, I. & Choe, Y. J. (2020) Coronavirus Disease Outbreak in Call Center, South Korea.
 Emerging Infectious Diseases, 26.

 33
You can also read