Air po cAly - pse Assessment of Air Pollution in indiAn Cities - Greenpeace
←
→
Page content transcription
If your browser does not render page correctly, please read the page content below
Air
po
caly
pseAssessment of
   Air Pollution
   in Indian Cities
Report
1. Introduction 2
2. Methodology and Data 3
3. Inferences and Discussion 4
3.1 Andhra Pradesh 5
3.2 Bihar 6
3.3 Chandigarh 7
3.4 Chhattisgarh 8
3.5 Delhi 9
3.6 Gujarat 10
3.7 Haryana 12
3.8 Jharkhand 13
3.9 Karnataka 14
3.10 Madhya Pradesh 16
3.11 Maharashtra 17
3.12 Odisha (Orissisha (Orissa) 19
3.13 Punjab 20
3.14 Rajasthan 21
3.15 Tamil Nadu 22
3.16 Telengana 23
3.17 Uttar Pradesh 24
3.18 Uttarakhand 25
4. Way Forward 26
5. Comparison of air pollution policies 27
6. Appendix I 28
7. Appendix II 35
Airpocalypse: Assessment of
Air Pollution in Indian Cities
Written by
Sunil Dahiya, Greenpeace
Lauri Myllyvirta, Greenpeace
Nandikesh Sivalingam, Greenpeace
Acknowledgements
Harshit Sharma, Narendra Dubey and Ashish Fernandes
Design
Divya Kukreti, Studio Kuk
Published by GPET, released in January 2017
For more information, contact:
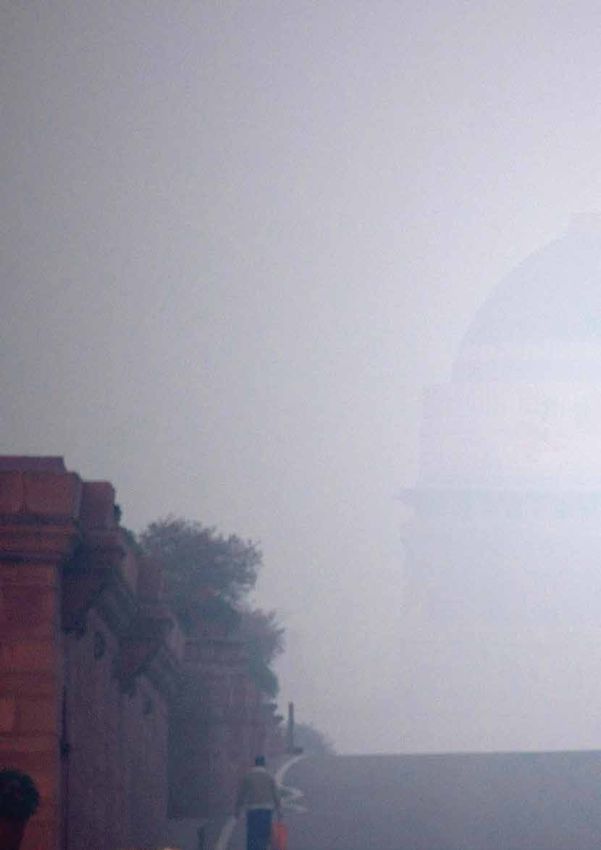
sunil.dahiya@greenpeace.org A view of the smog-covered smoke stacks of the Indraprastha
Power Generation Co. Ltd, a power plant in New Delhi.
Printed on 100% recycled paper Image: Subrata Biswas/ Greenpeace
1.2 million                Deaths every year due to
                           outdoor air pollution in
                           India

                           GDP lost due to Air pollution

          Executive Summary

       This report shows that deadly air pollution is not a problem restricted to
       Delhi-NCR (National Capital Region) or even to India’s metros. It is a national
       problem that is killing 1.2 million Indians every year and costing the economy
       an estimated 3% of GDP. If the country’s development is important, fighting
       air pollution has to be a priority.

       Data gathered by Greenpeace India from state pollution control boards shows that
       there are virtually no places in India complying with WHO and National Ambient Air
       Quality (NAAQ) standards, and most cities are critically polluted. Except for a few
       places in Southern India which complied with NAAQ standards, the entire country
       is experiencing a public health crisis due to high air pollution levels.

       Due to the range of different sectors responsible for pollutant emissions, urgent
       and determined action is needed by a number of ministries in the states and
       central governments, industry and general public.

       Greenpeace is calling on the central and state governments to:
       1. Institute robust monitoring of air quality across the country and make
          the data publicly available in real time. This should be coupled with a health
          advisory and ‘red alerts’ for bad-air days, which would enable the public to take
          decisions to protect their health and the environment and automatically institute
          measures to protect citizens, such as shutting down schools, traffic reduction
          measures, shutting down power plants and industries etc.
       2. Use the data as a basis to fine tune pollution reduction strategies that
          must, inter alia seek to improve public transport and reduce petrol/diesel
          vehicle use, strengthen enforcement to get polluting vehicles off the roads,
          introduce higher fuel standards (Bharat VI), enforce stricter emission regulations
          and improved efficiency for thermal power plants and industries, move from
          diesel generators to rooftop solar, increase use of clean renewable energy, offer
          incentives for electric vehicles, dust removal from roads, regulate construction
          activities and stop burning of biomass and waste.

       These strategies should be formalized as a time bound action plan which has
       targets and penalties. While some actions might need to be city or region-specific,
       there are a broad range of actions that will be universally applicable.

       Vocal public participation is critical in reducing air pollution. Our choices in terms
       of electricity, transportation and waste management can play a major role in
       managing pollution levels, as are our choices in terms of political leaders who
       support the goal of reducing air pollution.

                                   1
Introduction

In 2016, severe                            In 2016, severe air pollution has disrupted everyday life,
                                           especially during the winter. In 2015 air pollution (PM2.5)
air pollution has                          levels increased in a rapid manner overtaking even
disrupted everyday                         China. Even though pollution levels are increasing across
                                           the country, the emphasis so far has been on Delhi.
life, especially during                    There has been a growing realization that the majority of
the winter.                                Delhi’s pollution is coming from outside its borders and
                                           that pollution levels in other states like Karnataka, Tamil
                                           Nadu and Maharashtra are also increasing. However,
                                           the country is yet to come to the full understanding that
                                           air pollution is a national problem and to win the fight
                                           against it, we need to act as a country and across city or
                                           even regional boundaries.

                                           India’s air pollution has become a public health and
In 2015 air                                economic crisis. There are increasing numbers of

pollution                                  people who die prematurely every year with the
                                           increasing pollution levels. Deaths due to air
(PM2.5) levels                             pollution are only a fraction less

increased                                  than the number of deaths caused
                                           by tobacco usage. Global Burden of Disease
in a rapid                                 (GBD), a comprehensive regional and global research
                                           program including 500 researchers representing over
manner                                     300 institutions and 50 countries, has estimated that
overtaking                                 3283 Indians died per day due to outdoor air pollution
                                           in India in 2015, making the potential number of deaths
even China                                 due to outdoor air pollution in India in 2015 to 11.98
                                           lakh. On the economic front, loss of productivity and
                                           the forced closures of schools and industries have
                                           already started impacting our economy. The World Bank
                                           estimates that India loses around 3% of its GDP due to
                                           air pollution. This makes air pollution one of the biggest
                                           issues to fight if we are to protect peoples’ lives, public
                                           health and our economy.

                                           Air pollution is a complex issue, requiring an array of
                                           solutions. There are many sources that contribute to
                                           pollution across the country. Depending on region and
                                           climatic conditions, the contribution of particular sources
                                           will also differ. However, what is very clear is that
                                           irrespective of where you live, burning of fossil fuels (coal
                                           & oil) contributes majorly to air pollution levels across
                                           regions.

                                           The purpose of this report is to show that air pollution
                                           is a national problem and it needs to be addressed
                                           equally across the country and not only in Delhi or the
                                           National Capital Region. The report also tries to identify
                                           major sources of pollution in parts of the country based
1
  http://documents.worldbank.org/
                                           on past research. As a way ahead for the country, our
curated/en/220721468268504319/             long term goals to solve the air pollution crisis can be
pdf/700040v10ESW0P0box0374379B00PUBLIC0.
pdf
                                           universal, while short term solutions are to be decided
                                           based on the levels of pollution prevailing in the region.

                                           2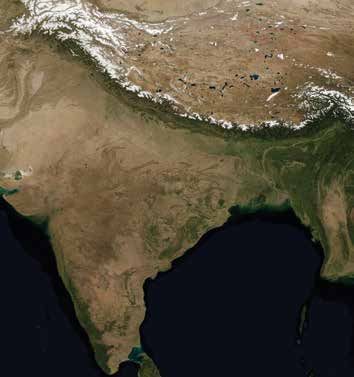
Methodology and Data
The Central Pollution Control Board has instituted the National Air Quality Monitoring
Programme (NAMP). Under NAMP, three air pollutants viz., Sulphur Dioxide (SO2), Nitrogen
Dioxide (NO2) and Particulate Matter size equal to or less than 10 micron (PM10), have been
identified for regular monitoring at all the locations. The NAMP network presently comprises
621 operating monitoring stations located in 262 cities/towns in 29 states and 5 union territories
across the country.”2 Greenpeace tried to collect data on PM10 levels for these NAMP station
across the country through various sources such as Right to Information (RTI) application filed
to SPCB (State Pollution Control Boards) to gather data, SPCB’s websites and annual reports
of SPCBs etc. Simultaneously, a secondary literature review was carried out to understand
the sources of pollution, to capture the most recent source apportionment studies carried out
throughout the country.
Sulphur Air pollutants
Dioxide (SO2), that have been
identified
Nitrogen for regular
monitoring
Dioxide at all the
locations
(NO2) and throughout
the country
Particulate
Matter
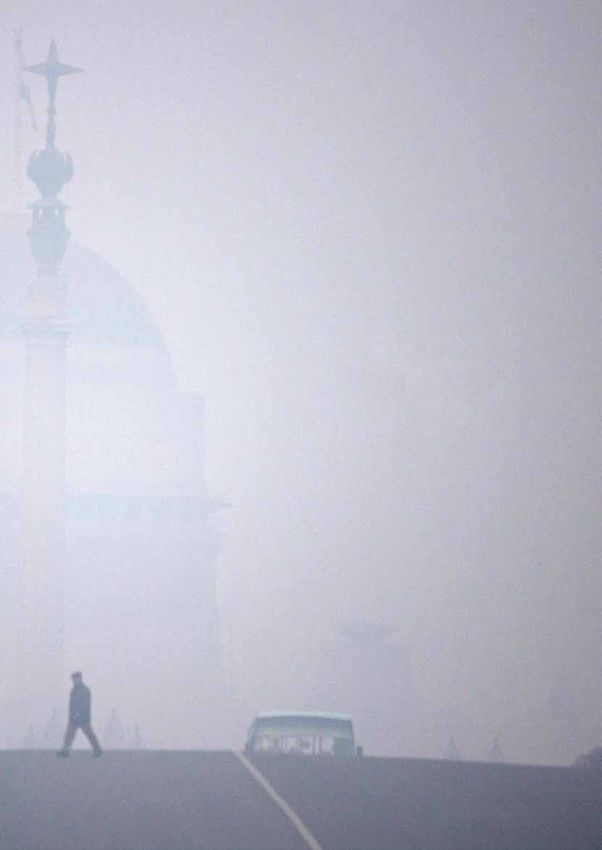
Delhi has been recording dangerous levels of air pollution putting everyone,
but especially children, elders and patients, at serious health risk.
Image: Sudhanshu Malhotra / Greenpeace 2
http://cpcb.nic.in/AQI_NAMP_
Rep_June2016.pdf
3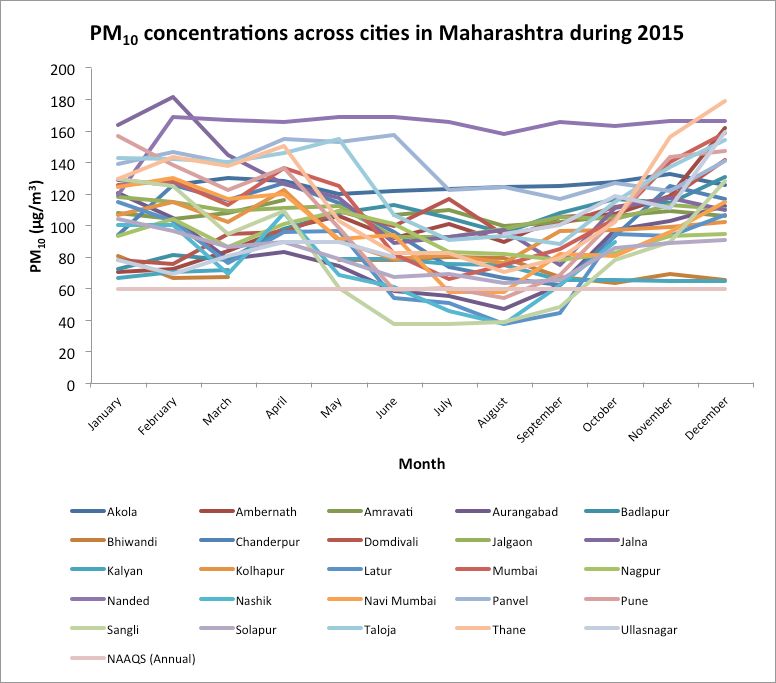
Inferences and Discussion

                                                                                   The map plotted from the annual average
                                                                                   PM10 concentrations across the country
                                                                                   suggests that there are no places or cities
                                                                                   in northern India complying with WHO and
                                                                                   NAAQS standards, and most of the cities are
                                                                                   critically polluted. Except for a few places in
                                                                                   Southern India which complied with NAAQ
                                                                                   standards, the entire country is experiencing
                                                                                   a public health crisis due to high air pollution
                                     Jammu                                         levels. A detailed description of the cities
                                       Damtal                                      across all states in India is provided in the
                                                                                   following sections.
                                         Chandigarh
              Dera Baba nanak

                    Mandi Gobindgarh              Haldwani

                                              Meerut
                                 rohtak

                                                  Lucknow
                                alwar                                                                                Sibsagar
              Jodhpur                    agra               Unnao      Gorakhpur
                                                                                                   Nalbari
                               Jaipur
                                          gwalior                                                                    Kohima
                                  kota                  jhansi     varanasi                        Byrnihat

                     udaipur                                                    Patna                            silchar

                                                                        kusunda         sindri
    gandhi nagar
                            ujjain              sagar singrauli
                                          bhopal                       ranchi        Jharia
jamnagar
           rajkot               indore                       korba                            Kolkatta
                    surat
     bhavnagar                                          siltara     rourkela
                              akela                                                     balasore
                                                           raipur
                    nashik                   amravati
                                                                       talcher      cuttak
                                 jalna               chaderpur

           mumbai                                 karim nagar                 berhampur
                                 latur
      Navi mumbai      pune               bidar
                                                     warangal

                                                hyderabad
              solapur
                                                                    visakhapatnam

                             hubli                      guntur
             belgaum
                                davanagere              nellore
              karwar

              chitradurga            tumku                                         cities and PM10
                       hassan                kolar       chennai
                                                                                   levels across
                                                        cuddalore
                                                                                   India
                         chamrajnagar

                                                                                         WHO Guideline
                                                                                         NAAQS Guideline
                                                                                         1-1.25 times NAAQS
                                         tuticorin
                                                                                         1.25-2 times NAAQS
                                                                                         2-3 times NAAQS
                                                                                         3-4 times NAAQS
                                                                                         > 4 times NAAQS
                                                                                         Indian state boundary
                         Note: Map not to scale

                                                                          4
Andhra Pradesh
The assessment of Air Pollution levels for cities in Andhra Pradesh
highlighted that PM10 concentrations in three cities where the data was
available from the pollution control board were higher than the annual
average of 60 µg/m3 as prescribed under NAAQS. PM10 concentrations in
Anantpuram, Guntur and Visakhapatnam were respectively 84, 100 and 61
µg/m3 for year 2015.
PM10 concentrations across cities in Andhra Pradesh during 2015
120
100
PM10 ( µG/M3)
80
60
40
20
0
Anantpuram Guntur Vishakapatnam
three cities
In Andhra Annual average naaqs (annual)
Pradesh
recorded
PM10 levels Further analysis of the monthly variations in the data during 2015 suggests
higher than that the PM10 levels in all three cities were constantly higher than the
the annual annual average prescribed by CPCB throughout the year. From PM10
average of concentrations from January to May were relatively high as compared to
60 µg/m3 as other time of the year worsening the situation to even dangerous levels.
prescribed
under NAAQS PM10 concentrations across cities in Andhra Pradesh during 2015
150
PM10 ( µG/M3)
100
50
0
Jan Feb mar apr may jun jul aug sep oct nov dec
Anantpuram Guntur Vishakapatnam
Naaqs (Annual)
5Bihar
The assessment of Air Pollution levels for cities in Bihar highlighted that
PM10 concentrations in Patna and Muzzafarpur were respectively at 200 µg/
m3 and 164 µg/m3 for year 2015, which were at around 3 times the NAAQS
annual limit set by CPCB and 8 to 10 times the annual limit set by WHO for
PM10. The data is not just an indicator of hazardous levels of pollution but a
continuously ringing alarm for years indicating the health emergency faced
by the people inhabiting the area.
PM10 concentrations across cities in Bihar during 2015
250
PM10 ( µG/M3)
200
150
100
50
0
Patna Muzzafarpur
Annual average naaqs (annual)
Patna and
Muzzafarpur Detailed observation of the data suggests that the PM10 levels has been
In Bihar hazardous and very high all around the year for 2015 for both Patna and
recorded Muzzafarpur with November to March being the severely polluted months
PM10 levels when the PM10 concentrations even reached above 300 µg/m3.
3 times the
NAAQS annual Guttikunda and Jawahar 20143, conducted a study to understand pollution
limit set by contribution within city of Patna for base year 2012. They found that overall
CPCB contribution to the PM10 pollution load within the city varied from source
to source. They found that the transport, road dust, domestic sources,
generator sets, open waste burning, manufacturing industry, brick kilns
and construction activities respectively contributed approximately 13-22%,
14-19%, 12-16%, 5-6%, 9-11%, 5-10%, 11-29% and 8-13% to the total
PM10 emission load in the city. It is important to note that emissions within
the city are different from contributions to ambient levels, as a large part of
the pollution in ambient air comes from outside the city. The same paper
also mentioned that the Greater Patna area has 2600 premature deaths,
2,00,000 asthma attacks and 1100 cardiac admissions due to exposure to
ambient air pollution levels in Patna in 2012.
PM10 concentrations across cities in Bihar during 2015
350
300
PM10 (MG/M3)
250
200
3
Guttikunda, S.K. and P. 150
Jawahar, 2014. “Characterizing
Patna’s Ambient Air Quality 100
and Assessing Opportunities
for Policy Intervention”, 50
UrbanEmissions.Info (Ed.),
New Delhi, India, http:// 0
shaktifoundation.in/wp-
content/uploads/2014/02/ Jan Feb mar apr may jun jul aug sep oct nov dec
AQM-in-Patna-2014-07-15-
Final-Report.pdf Patna Muzzafarpur Naaqs (Annual)
6Chandigarh
The assessment of Air Pollution levels for Chandigarh highlighted that PM10
concentrations are 85 µg/m3 for year 2015, which were at higher than the
NAAQS annual limit set by CPCB and about 4 times the annual limit set
by WHO for PM10. Detailed observation of the data suggests that the PM10
levels has been very high all around the year for 2015 for Chandigarh with
October to February being the severely polluted months when the PM10
concentrations even reached above 100 µg/m3.
PM10 concentrations in Chandigarh during 2015
150
PM10 (MG/M3)
100
50
0
Jan Feb mar apr may jun jul aug sep oct nov dec
Chandigarh Naaqs (Annual)
Chaudhary et al., 20044 carried out source apportionment study for
Chandigarh in 2001, which attributed 24% of total primary PM2.5 pollution
Chandigarh levels from fossil fuel combustion (coal, diesel, and gasoline) and 9 % to
recorded the biomass combustion in Chandigarh. The same study also highlighted
PM10 levels that during the summer time secondary particulate formation and oil
4 times the (Diesel & Petrol) consumption were the biggest contributors to the overall
annual limit particulate matter concentrations.
set by WHO
Others
Diesel 7%
10%
Secondary
Ammonium 6%
secondary Petrol 17%
nitrate 2%
Secondary
Sulphate
16%
Biomass
Burning 9%
Road Dust 33%
4
Chowdhury, Zohir; Zheng,
Mei and Russell, Armistead,
2004, “Source Apportionment
and Characterization of
Ambient Fine Particles in
Delhi , Mumbai , Kolkata ,
and Chandigarh” Georgia
Institute of Technology, Atlanta
Georgia, https://smartech.
gatech.edu/bitstream/
handle/1853/10872/E-
20-H76_736587.pdf
7Chhattisgarh
The assessment of Air Pollution levels for cities in Chhattisgarh highlighted
that PM10 concentrations in four cities where the data was available from
pollution control board were higher than the annual average of 60 µg/m3 as
prescribed under NAAQS. PM10 concentrations in Bhilai, Korba, Raipur and
Siltara were respectively 109, 66, 138 and 145 µg/m3 for year 2015-2016.
PM10 concentrations across cities in Chhattisgarh during April 2015 - March 2016
200
PM10 ( µG/M3)
150
100
50
0
Bhilai Korba Raipur Siltara
Annual average naaqs (annual)
Detailed observation of the data suggests that the PM10 levels has been
Detailed hazardous and very high all around the year for 2015-2016 for all the cities
observation except Korba which shows PM10 levels close to NAAQS throughout the
of the data year.
suggests
that the Korba has been declared 5th in the list of the 24 most critically polluted
PM10 levels areas in the country5 by CPCB. The same report also highlighted Coal
has been Based Power Plants and Smelter Plants as major sources of air pollution
hazardous along with fugitive emissions from coal mines in the area.
and very high
all around Deshmukh et al., 20136 highlighted vehicular growth, coal burning in steel
the year for industry and thermal power plants, other industrial activities, biomass
2015-2016 for burning, brick kilns and domestic fuel use as the major factors contributing
Most cities to air pollution in Raipur, although the contribution to total pollution from
respective sources has not been attributed.
PM10 concentrations across cities in Chhattisgarh during
April 2015 - March 2016
200
PM10 (MG/M3)
150
100
50
0
apr may jun jul aug sep oct nov dec Jan Feb mar
Bhilai Korba Raipur Siltara
Naaqs
(Annual)
5
http://cpcb.nic.in/
divisionsofheadoffice/ess/
Korba.pdf
6
http://link.springer.com.
sci-hub.cc/article/10.1007/
s11869-011-0169-9
8Delhi
The assessment of Air Pollution levels for Delhi highlighted that PM10
concentrations are 268 µg/m3 for year 2015, which were at 4.5 times higher
than the NAAQS annual limit set by CPCB and about 13 times the annual
limit set by WHO for PM10. Detailed observation of the data suggests that
the PM10 levels has been very high all around the year for 2015 for Delhi
with October to February being the severely polluted months when the PM10
concentrations even touched 500 µg/m3.
It has been long established as the pollution capital of the world by WHO,
20147 and most of the debate on air pollution in India are still centered
around Delhi. Various studies have been done to understand the source
contribution to Delhi’s Air pollution, the most recent being the study by IIT
Kanpur8. According to the study, “The total PM10 emission load in the city
is estimated to be 143 t/d (based on average annual activity data). The top
four contributors to PM10 emissions are road dust (56%), concrete batching
(10%), industrial point sources (10%) and vehicles (9%); these are based
on annual emissions”. According to the study control measures applied
at the power plants within 300 KM radius of Delhi will “effectively reduce
PM10 and PM2.5 concentration by about 62 µg/m3 and 35 µg/m3 respectively.
Similarly 90% reduction in NOx can reduce the nitrates by 45%. This will
Air Pollution effectively reduce PM10 and PM2.5 concentration by about 37 µg/m3 and 23
levels µg/m3 respectively. It implies that control of SO2 and NOx from power plants
for Delhi can reduce PM10 concentration approximately by 99 µg/m3 and for PM2.5 the
highlighted reduction could be about 57 µg/m3.”
that PM10
concentra- Furthermore, the study highlighted that, “The contribution of the biomass
tions are 268 burning in winter is quite high at 17% (for PM10) [and] 26% (for PM2.5).
µg/m3 for Biomass burning is prohibited in Delhi and it is not a common practice at
year 2015, a large scale. The enhanced concentration of PM in October-November is
which were possibly due to the effect of post-monsoon crop residue burning (CRB).
at 4.5 times It can be seen that the biomass contribution in PM10 in the month of
higher than November could be as high as 140 µg/m3 and about 120 µg/m3 for PM2.5
the NAAQS (mean of contribution in entire winter season: 97 µg/m3 and 86 µg/m3
annual limit respectively). In all likelihood, the PM from biomass burning is contributed
set by CPCB from CRB [crop residue burning] prevalent in Punjab and Haryana in winter”.
and about
13 times the
annual limit
set by WHO
PM10 concentrations in Delhi during August 2014- July 2015
600
PM10 (MG/M3)
500
400
300
200
100
0
aug sep oct nov dec Jan Feb mar apr may jun jul
Delhi Naaqs (Annual)
7
http://www.who.int/phe/
health_topics/outdoorair/
databases/cities-2014/en/
8
http://delhi.gov.in/DoIT/
Environment/PDFs/Final_
Report.pdf
9Gujarat
The assessment of Air Pollution levels for cities in Gujarat highlighted
that PM10 concentrations in five cities where the data was available from
pollution control board were higher than the annual average of 60 µg/m3 as
prescribed under NAAQS. PM10 concentrations in Bhavnagar, Gandhi Nagar,
Jamnagar, Rajkot and Vadodara were respectively 91, 82, 88, 86 and 86 µg/
m3 for financial year 2014-2015.
PM10 concentrations across cities in Gujarat during April 2014 - March 2015
100
80
PM10 (MG/M3)
60
40
20
0
Bhavnagar Gandhi Jamnagar Rajkot Vadodhara
Nagar
Annual average naaqs (annual)
Detailed PM10
concent-
rations in Detailed observation of the data suggests that the PM10 levels have been
Bhavnagar, very high all around the year for 2014-2015 for all the cities in Gujarat.
Gandhi
Nagar, Guttikunda and Jawahar, 20119 estimated that power plants contribute
Jamnagar, to 39% of PM10 pollution load in Ahmedabad and 31% to PM2.5,
Rajkot and with transportation contributing to 16% and 27% to PM10 and PM2.5
Vadodhra respectively.
were
respectively In Surat and Rajkot the contribution of transportation to overall PM10
91, 82, 88, 86 were 30% & 26% and PM2.5 concentration were 42% & 40% respectively.
and 86µµg/ Contribution from industrial sector to PM10 levels of 12 % and 25% and
m3 for year PM2.5 levels of 20% and 36% in Surat and Rajkot respectively.
2014-2015
PM10 concentrations across cities in Gujarat during
April 2014- March 2015
120
PM10 (MG/M3)
100
80
60
40
20
0
apr may jun jul aug sep oct nov dec Jan Feb mar
Bhavnagar Gandhi Jamnagar Rajkot
Nagar
Vadodhara Naaqs
(Annual)
9
Guttikunda and Jawahar,
2011, “Simple Interactive
Models for Better Air Quality,
Urban Air Pollution Analysis
in India”, UrbanEmissions.Info,
New Delhi, India,
http://urbanemissions.info/
wp-content/uploads/docs/
SIM-37-2012.pdf
10Contribution of major sources Contribution of major sources to
to PM10 emissions inventory PM2.5 emissions inventory
Ahmedabad Ahmedabad
CON WB IND CON
IND 2% 4% BK 11%
4% 1%
2% WB
5%
BK 7% RD 22% GS 5%
RD 7%
GS 3%
DOM 9%
DOM 5%
TR 16% PP 31%
TR 27%
PP 39%
Surat Surat
IND 12% GS 3%
BK 7% DOM 10% BK 10%
CON 2%
GS 3%
WB 5%
DOM 7%
IND 20%
TR 30% RD 34% TR 42% CON 1%
WB 6%
RD 8%
rajkot rajkot
GS 1%
IND 25% QR 11% DOM 3%
IND 25%
CON 1%
WB 3%
GS 1%
DOM 3%
QR 11%
TR 26%
TR 26%
RD 30% CON 1%
WB 3%
RD 30%
TR- Transport BK- Brick Kilns; GS- Generator Sets; DOM- Domestic Fuel Combustion; CMQ- Construction Material rocessingat quarries;
RD- Road Dust; WB- Open Waste burning; PP: Power Plant
11Haryana
The assessment of Air Pollution levels for cities in Haryana highlighted
that PM10 concentrations in four cities where the data was available from
pollution control board were higher than the annual average of 60 µg/m3
as prescribed under NAAQS. PM10 concentrations in Faridabad, Gurgaon,
Panchkula and Rohtak were respectively 240, 129, 92 and 92 µg/m3 for year
2015.
PM10 concentrations across cities in Haryana during 2015
300
250
PM10 (MG/M3)
200
150
100
50
0
Faridabad Gurgaon Panchkula Rohtak
Annual average naaqs (annual)
PM10 levels Detailed observation of the data suggests that the PM10 levels have been
has been hazardous and very high all around the year for 2015 for all the cities
hazardous wherever data is available Faridabad and Gurgaon being the places
all around which are severely polluted along with all other places having higher PM10
the year for concentrations reaching above NAAQS.
2015 with
Faridabad PM10 concentrations across cities in Haryana during 2015
and Gurgaon
350
PM10 (MG/M3)
showing 300
severe 250
200
pollution 150
levels 100
50
0
Jan Feb mar apr may jun jul aug sep oct nov dec
Bhilai Gurgaon Panchkula Rohtak
Naaqs
(Annual)
12Jharkhand
The assessment of Air Pollution levels for cities in Jharkhand highlighted
that PM10 concentrations in all 10 locations where the data was available
from pollution control board were higher than the annual average of 60 µg/
m3 as prescribed under NAAQS. PM10 concentrations in Jharia, Ranchi,
Kusunda and Bastacola were respectively 228, 216, 214 and 211 µg/m3 for
year 2015.
PM10 concentrations across cities in Jharkhand during 2015
250
PM10 (MG/M3)
200
150
100
50
0
la
d
ih
h
r
ia
a
i
i
i
h
r
m
u
d
ag
a
d
r
d
c
o
u
p
n
b
a
n
n
ir
h
ed
ac
n
ib
su
Jh
Ra
Si
b
a
G
r
st
sh
h
u
h
za
g
D
K
Ba
m
n
Ha
Ja
Si
t
es
Annual average naaqs (annual)
W
Ranchi, Detailed observation of the data suggests that the PM10 levels has been
Kusunda, hazardous and very high all around the year for 2015 for all the cities
Jharia and wherever data is available. Ranchi, Kusunda, Jharia and Bastacola are the
Bastacola places which are severely polluted with PM10 levels being above 200 µg/m3
are the all the time during the year along with all other places having higher PM10
places which concentrations reaching above NAAQS.
are severely
polluted Pandey et al., 201410 highlighted that the major causes of air pollution in
with PM10 area near Jharia including Bastacola, Dhansar, Ena, CIMFR are coal mining,
levels being mine fires, vehicular pollution, windblown dust through unpaved roads and
above 200 µg/ over burdens in the area.
m3 all year
long PM10 concentrations across cities in Jharkhand during 2015
250
PM10 (MG/M3)
200
150
100
50
0
Jan Feb mar apr may jun jul aug sep oct nov dec
Bastacola dhanbad girdih hazaribagh
jamshedpur jharia kusunda ranchi
sindri west singhbhumi Naaqs
(Annual)
10
Pandey et al., 2014,
“Assessment of air pollution
around coal mining area:
Emphasizing on spatial
distributions, seasonal
variations and heavy metals,
using cluster and principal
component analysis”,
Atmospheric Pollution
Research, 5, 79-86,
http://www.sciencedirect.
com/science/article/pii/
S1309104215303445
13karnataka
The assessment of Air Pollution levels for cities in Karnataka highlighted
that PM10 concentrations in 9 towns and cities out of the 21 where data
was available from pollution control board were higher than the annual
average of 60 µg/m3 as prescribed under NAAQS. PM10 concentrations in
Davanagere, Bangalore, Tumkur, Raichur and Hubli were respectively 109,
119, 118, 87 and 80 µg/m3 for year 2015-2016.
PM10 concentrations across cities in Karnataka during April 2015 - March 2016
160
140
120
100
PM10 (MG/M3)
80
60
40
20
0
e
r
R
a
e
r
ga n
e
r
ga
en i
r
e
d
li
lb m
ga
r
y
r
eb th
r
r
r
er
y
la
u
aga
a
u
u
a
r
a
a
a
b
lo
so
lo
w
d
id
w
la
k
r
n
r
h
ss
u
u
a
ag
o
n
u
a
m
ic
v
r
g
h
r
b
a
ga
y
el
k
n
a
d
a
ka
tu
el
a
a
n
h
m
aj
m
a
r
h
b
r
PM10
u
a
n
n
b
r
d
d
v
r
g
n
a
a
it
a
a
m
b
m
a
h
h
d
r
a
concentra-
b
c
h
c
tions in 9 Annual average naaqs (annual)
towns/cities
out of 21 were
higher than TERI 201011 estimated emission load and source contribution to pollution
the annual for Bangalore and estimated that, “At the city level, the major sources
average of of PM10 emissions are transport (42%), road dust resuspension (20%),
60 µg/m3 as construction (14%), industry (14%), DG set (7%) and domestic (3%).
prescribed Likewise, at the city level, major sources of NOx are transport (68%), DG
under NAAQS set (23%), industry (8%) and domestic (1%). In case of SO2, at the city
level, industry (56%0, DG set (23%) and transport (16%) are the major
sources.” The same report through source apportionment also highlighted:
• “Share of transportation increases from 19% in PM10 to 50% in PM2.5,
depicting dominance of finer particles in the vehicular exhaust.
• Share of anthropogenic sources has been eclipsed by dust contribution,
in case of PM10. However, PM2.5 clearly shows significant contribution of
anthropogenic sources.
• DG sets have emerged out as an important source of air pollution. Their
contribution is 13% & 25% in PM10 and PM2.5, respectively.
• Contribution of industries to the particulate matter is low in Bangalore,
primarily due to absence of any large scale air polluting unit. However,
their contribution in the industrial zone (Peenya) is high.
• Share of secondary particulates is higher in PM2.5 than PM10, depicting
their finer size.”
11
Air quality assessment,
emission inventory and
source apportionment
study for Bangalore city:
Final report, New Delhi: The
Energy Resources Institute,
186 pp. [Project Report No.
2004EE28], http://www.cpcb.
nic.in/Bangalore.pdf
14Figure: Percentage share of different sources in total PM10 and NOx emission loads
PM10 nox
Hotel 0% Hotel 0%
construction Industrial 14%
14%
Transport
42.0%
DG set
7.0%
Industrial
14%
Domestic Transport
DG set 7.0% 3% 42.0%
Domestic 3%
road dust
20%
Figure: Comparison of PM10 and PM2.5 source contribution in Bangalore city (average of 3 seasons)
PM10 PM2.5
secondary
8.7% secondary
Transport 12.7%
19.0%
Paved road
& Soil dust
3.5%
Domestic
5.8%
DG set Transport
Industrial 49.9%
13.0%
3.5%
Paved road
& Soil dust
50.6%
Industrial
4.5% DG set
24.7%
Domestic
4.2%
15Madhya Pradesh
The assessment of Air Pollution levels for cities in Madhya Pradesh
highlighted that PM10 concentrations in all 4 cities where the data was
available from pollution control board were higher than the annual average
of 60 µg/m3 as prescribed under NAAQS. PM10 concentrations in Bhopal,
Satna, Singrauli and Gawalior were respectively 158, 88, 93 and 128 µg/m3
for 2015.
PM10 concentrations across cities in Madhya Pradesh during 2015
200
PM10 (MG/M3)
100
0
bhopal satna singrauli gawalior
Annual average naaqs (annual)
The data suggests that the PM10 levels have been hazardous and very high
vehicular all around the year for 2015 for all the cities, with January to May being the
emissions, most severely polluted months. Highest recorded monthly average PM10
air born concentration exceeded 200 µg/m3 for Gwalior, in April.
dust and
industrial The average PM10 levels in Indore between September 2009 and
emissions June 2010 were 195 µg/m3 according to a study by MPPCB that also
are major mentioned vehicular emissions, airborne dust, and industrial emissions
emission load as major emission load contributors to PM10 in Indore by MPPCB12, in
contributors Comprehensive Environment Pollution Abatement action Plan for Critically
to PM10 in Polluted area Indore.
Indore
PM10 concentrations across cities in Madhya Pradesh during 2015
300
PM10 (MG/M3)
200
100
0
Jan Feb mar apr may jun jul aug sep oct nov dec
bhopal gawalior satna
singrauli Naaqs
(Annual)
12
Madhya Pradesh
Pollution Control Board,
“Comprehensive Environment
Pollution Abatment action
Plan for Critically Polluted area
Indore”, http://cpcb.nic.in/
divisionsofheadoffice/ess/F-
Indore.pdf
16Maharashtra
The assessment of Air Pollution levels for cities in Maharashtra highlighted
that PM10 concentrations in every single one of the 25 cities where the data
was available from pollution control board were higher than the annual
average of 60 µg/m3 as prescribed under NAAQS. PM10 concentrations
in Nanded, Taloja, Akola, Jalna, Thane, Mumbai and Chandrapur were
respectively 162, 126, 128, 118, 118, 107 and 103 µg/m3 for year 2015.
PM10 concentrations across cities in Maharashtra during 2015
180
160
140
120
100
PM10 (MG/M3)
80
60
40
20
0
akola
ambernath
amravati
aurangabad
badlapur
bhiwandi
chandrapur
dombivalli
jalgaon
jalna
kalyan
kolhapur
latur
mumbai
nagpur
nanded
nashik
navi mumbai
panvel
pune
sangli
solapur
taloja
thane
ullasnagar
In Mumbai,
the main
contributors
for PM,
like power Annual average naaqs (annual)
plant, open
burning,
commercial Detailed observation of the data suggests that the PM10 levels were
food sector, hazardous and very high all around the year for 2015 for all the cities
and road except for the monsoon months. October to January were the most
transport severely polluted months, with average PM10 concentrations even
exceeding 150 µg/m3.
Maji et al., 201613 mentioned, “In Mumbai, different combustion processes
are the main contributors for PM, like power plant, open burning,
13
Maji, et al., 2016, “Human health commercial food sector, and road transport, and they contribute 37, 24,
risk assessment due to air pollution
in 10 urban cities in Maharashtra, 18, and 10%, respectively. A study by National Environmental Engineering
India”, Cogent Environmental Research Institute (NEERI) found that open burning and landfill fires
Science, 2(1), 1193110, https://
www.cogentoa.com/article/10.1080 of municipal solid waste (MSW) were a major source of air pollution in
/23311843.2016. 1193110.pdf Mumbai (CPCB, 201014). The survey results show that about 2% of total
14
CPCB. (2010). Air quality
assessment, emissions inventory generated MSW is burnt on the streets and slum areas, 10% of the total
and source apportionment studies: generated MSW is burnt in landfills by management authorities or due
Mumbai [online]. Central Pollution
Control Board. Retrieved November to accidental landfill fires, thereby emitting large amounts of CO, PM,
23, 2014, from http://cpcb.nic.in/ carcinogenic HC, and NOx. In Chandrapur, primary sources of high critical
Mumbai-report.pdf
15
MPCB. (2010). Action plane pollutant concentration (i.e. SPM, PM10, SO2, and NO2) are open coal
for industrial cluster: Chandrapur. mining, lime stone mining, fluoride mining, cement industry, thermal power
Maharashtra Pollution Control
Board. Retrieved February 14, plant, road dust, natural burning of coal, and domestic coal burning by
2015, from http://cpcb.nic. local people for cooking (MPCB, 201015). Within the city of Pune, highest
in/divisionsofheadoffice/ ess/
Action%20plan%20CEPI- shares of emissions of PM10 come from road dust (61%), vehicular sources
Chandrapur.pdf (18%), industry (1.25%), vegetative burning, and solid fuels burning. For
16
ARAI. (2010). Air quality
monitoring and emission source NO2 emissions, major contributions are from vehicles (95%), industries
apportionment study for city of (2%), and domestic and commercial fuel burning (3%) (ARAI, 201016), due
Pune [online]. Pune: The Automotive
Research Association of India, [ARAI/ to absence of major industrial emitters within the city boundaries. Vehicles
IOCLAQM/R-12/2009-10]. Retrieved and industries contribute to high SO2 emission loads due to fuel burning.
March 21, 2015, from http://cpcb.
nic.in/Pune.pdf Main cause of air pollution in Nashik city is due to plastic industry, food
17(cont)
Maharashtra
processing factories, and domestic waste burning. Till December 2013,
there are 1.13 million registered vehicles in the city, constituting a major
source of pollution (TI, 201417)”.
Similarly, Kothai et al., 200818 carried out a source apportionment study
for Navi Mumbai and estimated that “percentage contribution of soil, two-
stroke emission with fugitive dust, industrial emission, motor vehicles and
sea salt to the average fine mass concentration was 3%, 18%, 23%, 29%
and 9%, respectively”
PM10 concentrations across cities in Maharashtra during 2015
200
180
160
PM10 (MG/M3)
140
120
100
80
60
40
20
0
Jan Feb mar apr may jun jul aug sep oct nov dec
akola ambernath amravati aurangabad badlapur
bhiwandi chanderpur Dombivalli jalgaon jalna
kalyan kolhapur latur mumbai nagpur
nashik navi panvel
nanded pune
mumbai
sangli solapur taloja thane ullasnagar
Naaqs
(Annual)
17
TI. (2014). Vehicles in
Nashik region rise by nearly
10% [online]. The Times of
India. Retrieved January 23,
2015, from http://timesofindia.
indiatimes.com/city/
nashik/Vehicles-in-Nashik-
region-rise-by-nearly-10/
articleshow/29924015.cms
Tominz, R., Mazzoleni, B., &
Daris, F.
18
Kothai, et al., 2008, “Source
Apportionment of Coarse
and Fine Particulate Matter at
Navi Mumbai, India”, Aerosol
and Air Quality Research,
Vol. 8, No. 4, pp. 423-436,
http://aaqr.org/VOL8_No4_
December2008/5_AAQR-08-
07-OA-0027_423-436.pdf
18odisha (orissa)
The assessment of Air Pollution levels for cities in Odisha highlighted that
PM10 concentrations in Keonjhar and Rourkela were higher than the annual
average of 60 µg/m3 as prescribed under NAAQS. PM10 concentrations in
Berhampur were found to be below the NAAQS for year 2015.
PM10 concentrations across cities in Odisha during 2015
150
PM10 (MG/M3)
100
50
0
berhampur keonjhar rourkela
Annual average naaqs (annual)
SPCB Orissa, Detailed observation of the data suggests that the PM10 levels have been
2010 carried very high all around the year for 2015 at Rourkela whereas for Keonjhar
out a and Berhampur the pollution levels were higher in months of September to
study to January.
understand
the emission SPCB Odisha, 201019 carried out a study to understand the emission
loading and loading and pollution contribution in Angul-Talcher area and found out that
pollution the average PM10 levels were between 85-110 and, “The major industries
contribution contributing to air pollution are thermal power plants of NALCO and NTPC
in Angul- and Smelter of NALCO besides sponge iron plants like BRG Iron & Steel
Talcher area and Bhusan Steel Ltd. Apart from the above sources the fugitive emissions
and found from the burning of wood and coal as domestic fuel, transportation of
out that the vehicles and emissions from the mines also contribute to air pollution in the
average PM10 area.”
levels were
between 85-
110 PM10 concentrations across cities in Orissa during 2015
160
140
120
PM10 (MG/M3)
100
80
60
40
20
0
Jan Feb mar apr may jun jul aug sep oct nov dec
berhampur keonjhar rourkela Naaqs
(Annual)
19
SPCB Orissa, 2010,
“Action plan for abatement of
pollution in critically polluted
industrial clusters (Angul-
Talcher area), http://cpcb.nic.
in/divisionsofheadoffice/ess/
Action%20Plan%20Angul-
Talcher.pdf
19Punjab
The assessment of Air Pollution levels for cities in Punjab highlighted that
PM10 concentrations in all 14 cities where the data was available from
pollution control board were higher than the annual average of 60 µg/m3
as prescribed under NAAQS. PM10 concentrations in Amritsar, Jalandhar,
Ludhiana, Mandi Gobindgarh, Khanna and Bhatinda were respectively 184,
151, 139, 130, 122 and 111 µg/m3 for year 2015.
PM10 concentrations across cities in Punjab during 2015
200
150
PM10 ( µG/M3)
100
50
0
amritsar
bhatinda
dera baba nanak
dera bassi
faridkot
jalandhar
khanna
ludhiana
mandi gobindgarh
naya nagal
patiala
rasulpur
sangrur
sbs nagar
Industrial
combustion
contributes
47% of
Annual average naaqs (annual)
the PM10
emissions
followed Detailed observation of the data suggests that the PM10 levels were
by brick and hazardous and very high all around the year for 2015 for all the cities with
open burning October to January being the severely polluted months. Highest monthly
average PM10 levels, exceeding 200 µg/m3 were recorded in Jalandhar in
December and in Amritsar in April-May.
200
“State wise emission assessment study (TERI, 201520) shows sector-wise
180
emissions for the Punjab state (Figure). Industrial combustion contributes
160
47% of the PM10 emissions followed by brick-making and open burning.
emissions Kt/yr
140
Almost 56 % of NOx emissions are contributed by transport sector in
120
Punjab including both road transport and mode of transportation used
100
during agricultural activities.”
80
60
PM10 concentrations across cities in Punjab during 2015
40
20 300
PM10 (MG/M3)
0 250
SOx nOx PM10 PM2.5 200
150
100
Figure: Sector-wise 50
emissions for criteria 0
pollutants from
different sources in Jan Feb mar apr may jun jul aug sep oct nov dec
Punjab in 2010
amritsar bhatinda dera baba dera bassi
nanak
Agricuture ind_comb
Transport jalandhar khanna ludhiana mandi
residential gobindgarh
Open Burning
Non-road patiala rasulpur sangrur sbs nagar
Brick transport
cement road transport faridkot naya nagal Naaqs
ind_proc power (Annual)
20
TERI, 2015. “Air pollution in Punjab”, New Delhi: The Energy and Resources Institute. 16 pp.,
http://www.teriin.org/projects/green/pdf/Punjab-Air-quality.pdf
20Rajasthan
The assessment of Air Pollution levels for cities in Rajasthan highlighted
that PM10 concentrations in 4 cities where the data was available from
pollution control board were higher than the annual average of 60 µg/m3 as
prescribed under NAAQS. PM10 concentrations in Alwar, Jaipur, Kota and
Udaipur were respectively 227, 171, 134 and 156 µg/m3 for year 2015.
PM10 concentrations across cities in Rajasthan during 2015
PM10 ( µG/M3) 250
200
150
100
50
0
alwar jaipur kota udaipur
Annual average naaqs (annual)
Detailed observation of the data suggests that the PM10 levels were
hazardous and very high all around the year for 2015 for all the cities, with
PM10 concen- the pollution moderating somewhat in most cities in the summer months.
trations October to January were the most severely polluted months, with PM10
in Alwar, concentrations reaching above200 µg/m3.
Jaipur,
Kota and PM10 concentrations across cities in Rajasthan during 2015
Udaipur were
respectively 350
PM10 (MG/M3)
300
227, 209, 134 250
and 156 µg/m3 200
150
for year 2015 100
50
0
Jan Feb mar apr may jun jul aug sep oct nov dec
alwar jaipur kota udaipur
Naaqs
(Annual)
21Tamil Nadu
The assessment of Air Pollution levels for cities in Tamilnadu highlighted
that PM10 concentrations in Chennai were higher than the annual average
of 60 µg/m3 as prescribed under NAAQS. Detailed observation of the data
suggests that the PM10 levels has been high all around the year for 2015 for
Chennai.
PM10 concentrations across cities in Tamil nadu during 2015
PM10 ( µG/M3) 100
80
60
40
20
0
chennai cuddalore
Annual average naaqs (annual)
No source apportionment studies were available for Tamil Nadu. Within
the city of Chennai, CPCB, 201121 highlighted that the share of vehicular
Industrial exhaust emissions was 14%, industrial sector 2%, DG sets less than 1%,
combustion construction activities approx. 9% of total PM10 emission load with nearly
contributes 72% contribution from fugitive dust emissions.
47% of
the PM10 PM10 concentrations across cities in Tamil Nadu during 2015
emissions
followed
PM10 (MG/M3)
120
by brick and 100
80
open burning 60
40
20
0
Jan Feb mar apr may jun jul aug sep oct nov dec
chennai Naaqs (Annual)
EMISSION INVENTORY PM10 CHENNAi
Others 0.11, 1%
RESTAURANTS/ BAKERIES
STREET VENDORS 0.08, 1% INDUSTRY POINT 0.22, 2.00%
DOMESTIC COMBUSTION
CONSTRUCTION 0.98, 8.89% 0.03, 0.27%
VEHICLE EXHAUST
1.59, 14%
21
CPCB, 2011, “Air quality
PAVED & UNPAVED ROAD
monitoring, emission inventory
/ DUST 8.01, 72.69%
and source apportionment
study for Indian cities: National
Summary Report”, http://
www.moef.nic.in/downloads/
public-information/Rpt-air-
monitoring-17-01-2011.pdf
22Telangana
The assessment of Air Pollution levels for cities in Telangana highlighted
that PM10 concentrations in 4 cities where the data was available from
pollution control board were higher than the annual average of 60 µg/
m3 as prescribed under NAAQS. PM10 concentrations in Mahboobnagar,
Hyderabad, Karim Nagar and Khammam were respectively 108, 99, 65 and
60 µg/m3 for year 2015.
PM10 cconcentrations across cities in Telangana during 2015
120
100
80
PM10 ( µG/M3)
60
40
20
0
r
d
l
r
m
ga
aga
aga
a
a
b
m
n
a
“Results of
m
a
n
n
er
a
r
b
im
d
a
h
o
CMB Model
w
y
k
o
r
h
ka
b
eh
showed that
m
Annual average naaqs (annual)
major source
throughout
the study Gummeneni, et al., 201122 conducted a source apportionment study for
period were Hyderabad and concluded as, “Results of CMB Model showed that major
resuspended
source throughout the study period were re-suspended dust (40%) for
dust (40%)
PM10 and 31% for PM2.5. Vehicles has also contributed significant influence
for PM10 and
on particulate matter levels at the site for both PM10 (22%) and PM2.5
31% for PM2.5”
(31%). Other major identified sources of particulate matter were industrial
emissions, combustion and refuse burning.
Figure: Source contribution to PM10 and PM2.5
PM10 PM2.5
Others 9%
Others 21%
Refuse 9% Resuspended
dust 26%
Industrial
9% Resuspended Refuse 6%
dust 40%
Industrial
Combustion 7%
12%
Combustion
9% Vehicles
31%
Vehicles
22%
22
Gummeneni, S., et al.,
Source apportionment of
particulate matter in the
ambient air of Hyderabad
city, India, Atmos. Res.
(2011), doi:10.1016/j.
atmosres.2011.05.002
23Uttar Pradesh
The assessment of Air Pollution levels for cities in Uttar Pradesh highlighted
that PM10 concentrations in all 20 cities23 where the data was available from
pollution control board were higher than the annual average of 60 µg/m3 as
prescribed under NAAQS. PM10 concentrations in Gaziabad, Braeli, Allahabad,
Kanpur, Agra, Lucknow, Varanasi24 (Average of PM10 levels from October
2015 to September 2016 is 228 µg/m3 for Varanasi) and Sonebhadra were
respectively 258, 240, 250, 201, 186, 169, 145 and 132 µg/m3 for year 2015.
PM10 concentrations across cities in Uttar Pradesh during 2015
300
250
200
PM10 ( µG/M3)
150
100
In Kanpur For
NOx emissions 50
“nearly
50% of 0
varanasi
agra
allahabad
baraeli
firozabad
gajrola
gaziabad
gorakhpur
jhansi
kanpur
khurja
lucknow
mathura
meerut
mooradabad
noida
raebareli
saharanpur
sonebhadra
unnao
emissions are
attributed
to vehicles
that occur
at ground Annual average naaqs (annual)
level”
Detailed observation of the data suggests that the PM10 levels has been
hazardous and very high all around the year for from October 2015 to September
2016 for all the cities, with October to February being the severely polluted
months when the PM10 concentrations even reached near to 400 µg/m3. Sharma,
201025 carried out a source apportionment study for Kanpur and concluded as,
FUNERAL WOOD / CREMATION
0.05, 0.58% “There are several important sources of PM10 in the city including industrial point
MEDICAL WASTE
INCINERATOR
sources (26%), industry area source (7 %), vehicles (21%), domestic fuel burning
GARBAGE
BURNING 0.002, 0.02% (19%) paved and unpaved road (15%), garbage burning (5%) and rest others.”
0.47,
5.09% AGRICULTURAL For NOx emissions “nearly 50% of emissions are attributed to vehicles that occur
WASTE BURNING
0.35, 3.84%
at ground level, probably making it the most important pollutant. Vehicle sources
DG are followed by industrial point and area sources (42%), DG sets (5%) and
DOMESTIC
SETS
0.08,
COMBUSTION domestic sources and
1.76, 18.64%
0.87% rest others (3%)”.
INDUSTRY
AREA
0.64, PM10 concentrations across cities in Uttar Pradesh during October
6.94% 2015 - September 2016
PAVED & 400
UNPAVED
350
PM10 (MG/M3)
INDUSTRY ROAD /
POINT 300
DUST
2.39, 1.35, 250
25.59% 14.46% 200
150
100
50
HOTEL /
VEHICLE 0
RESTAURANT
EXHAUST
0.30, 3.26%
1.91, 20.50%
oct nov dec Jan Feb mar apr may jun jul aug sep
CONSTRUCTION
0.003, 0.03% agra allahabad baraeli firozabad gajrola
gaziabad gorakhpur jhansi kanpur khurja
lucknow mathura meerut mooradabad noida
raebareli saharanpur sonebhadra unnao varanasi
23, 24, 25
Footnotes on page 25 Naaqs (Annual)
24Uttarakhand
The assessment of Air Pollution levels for cities in Uttarakhand highlighted
that PM10 concentrations in all 6 cities where the data was available from
pollution control board were higher than the annual average of 60 µg/m3 as
prescribed under NAAQS. PM10 concentrations in Deharadun, Haldwani,
Haridwar, Kashipur, Rishikesh and Rudrapur were respectively 186, 139,
123, 107, 121 and 124 µg/m3 for year 2015.
PM10 concentrations across cities in Uttarakhand during 2015
200
150
PM10 ( µG/M3)
100
50
0
dehradun haldwani haridwar kashipur rishikesh rudrapur
Annual average naaqs (annual)
for all the
cities with
October to Detailed observation of the data suggests that the PM10 levels has been
February hazardous and very high all around the year for from October 2015 to
being the September 2016 for all the cities with October to February being the
severely severely polluted months when the PM10 concentrations even reached near
polluted to 200 µg/m3.
months
when the PM10 concentrations across cities in Uttrakhand during 2015
PM10 concen-
trations
250
reached near
to 200 µg/m3
PM10 (MG/M3)
200
150
100
50
0
Jan Feb mar apr may jun jul aug sep oct nov dec
dehradun haldwani haridwar kashipur
rishikesh rudrapur Naaqs
(Annual)
Page 24 footnotes
23
Data for Firozabad is from
August 2014 to July 2015
24
Average PM10 concentration
from October 2015 to
September 2016 is 228 µg/
m3, whereas for 2015 calendar
year it was shown to be 145
µg/m3 by the UPPCB data
collected through RTI.
25
Sharma, 2010, “Air Quality
Assessment, Emissions
Inventory and Source
Apportionment Studies for
Kanpur City”, IIt Kanpur,
Submitted to CPCB, http://
cpcb.nic.in/Kanpur.pdf
25Way forward
Government initiative
It requires a system approach to understand pollution levels regularly and take action. The first
step in the direction is having a robust monitoring of air quality across the country to know
information in real time and using the data to arrive at strategies that would protect public health
and reduce pollution levels. The strategies to reduce pollution should become an action plan
which is time bound and has targets and penalties.
Action Plan
Governments of India should adopt time-bound national and regional action plans, which have clear
targets for regions and penalties for non-compliance. This should include providing transparent data to
the public on air quality, short term and long term measures to reduce air pollution.
Transparent Short term Long term
data measures measures
Improving NAQI monitoring Issuing red alert and Improving public transport, limiting
systems and providing health advisories during the number of polluting vehicles
access to data to the public bad air-days, shutting on the road , Introducing less
on a real time basis for the down schools, taking polluting fuel (Bharat VI), Strict
whole country. This should polluting vehicles (odd/ emission regulations and improved
be coupled with a health even) off the roads, efficiency for thermal power plants
advisory which would enable shutting down power and industries, moving from diesel
the public to take decisions plants and industries etc. generators to rooftop solar, increased
to protect their health and the use of clean renewable energy,
environment. Electric vehicles, Removing dust
from roads, regulating construction
activities, stopping biomass burning
etc.
People initiative
Public participation is critical in reducing air pollution. Our choices for electricity and transportation could
play a major role in managing pollution levels in many parts of the country. Efforts should be made in key
areas such as:
1 2 3 4
Moving Increased Using Waste
towards usage of energy minimization,
roof top public efficient segregation and
solar transport, appliances recycling, which
cycling and will reduce
and reducing burning of waste
walking household in streets as
energy well as at the
usage landfills along
with energy
reductions in
transporting
huge quantities
of waste
26Uttar Pradesh
Comparison of facts on air pollution
in the world’s four major economies26
China India U.S. EU
Change in
satellite-based
-20% (from 2005
PM2.5 levels -17% +13% -15%
to 2013)
from 2010 to
2015
Falling since Increasing steadily
2011; 2015 was for past 10 years; Falling since Falling since
PM2.5 trend
the best on 2015 was the worst measurements started measurements started
record year on record
PM2.5 in capital
city, annual 81 128 12 18
(µg/m3)
PM2.5 air
quality
35 40 15 25 (from 2020, 20)
standard,
annual (µg/m3)
Deaths per
day from air
2,700 1,800 250 640
pollution in
2013
1,500 stations 39 stations in 23
Online PM2.5 770 stations in 540 1,000 stations in 400 cities
in 900 cities & cities (as of Feb
monitoring cities & towns & towns
towns 2016)
Share of
thermal power
plants with
basic pollution
controls 95% 10% 60% 75%
(desulphu-
rization,
particle
controls)
Deadline
2030; most key 2012; violating
for meeting
cities have an areas are currently 25 by 2015
national None
interim target implementing new 20 by 2020
energy/2016/Clean%20Air%20Action%20Plan,%20The%20way%20forward.pdf
26
air quality
for 2017 plans
http://www.greenpeace.org/eastasia/Global/eastasia/publications/reports/climate-
standards
States must adopt
emission reduction
Promotion measures into law
Consequences of province that are demonstrated Cities & countries face
for missing governors None to enable meeting legal action for not
targets depends on targets; must account meeting standards
meeting targets for pollution transport
into downwind states;
periodic review
National,
regional and Mainly action in
city-level action individual cities
National air
plans with with no measurable
quality targets;
measurable targets “Clean Air For Europe”
implementation plans
5-year targets action plan
approved on federal
Recently introduced Europe-wide emission
Coverage of level and executed on
National India-wide emission standards for power
government state level
emission standards for plants, industry and cars
measures
standards for thermal power
National emission
power plants, plants; Introduction Most countries and key
standards for power
industrial of Bharat VI vehicle cities have own plans
plants, industrial
sectors and emission norms is
sectors and vehicles
vehicles proposed by April
2020
27Appendix-I PM10 Levels across India (Annual Average 201527)
City State Annual NAAQS Time Reference
Average (Annual) Frame Source28
Delhi Delhi 268 60 2015 26
Uttar
Gaziabad 258 60 2015 26
Pradesh
Uttar
Allahabad 250 60 2015 22
Pradesh
Uttar
Braeli 240 60 2015 22
Pradesh
Faridabad Haryana 240 60 2015 26
Jharia Jharkhand 228 60 2015 26
Alwar Rajasthan 227 60 2015 26
Ranchi Jharkhand 216 60 2015 26
Kusunda Jharkhand 214 60 2015 26
Bastacola Jharkhand 211 60 2015 26
Uttar
Kanpur 201 60 2015 26
Pradesh
Patna Bihar 200 60 2015 26
Uttar
Firozabad 194 60 2015 22
Pradesh
Uttar
Agra 186 60 2015 22
Pradesh
Deharadun Uttrakhand 186 60 2015 23
Amritsar Punjab 184 60 2015 16
Uttar
Gajrola 177 60 2015 22
Pradesh
Jaipur Rajasthan 171 60 2015 18
Uttar
Lucknow 169 60 2015 22
Pradesh
Dhanbad Jharkhand 168 60 2015 7
Uttar
Mooradabad 168 60 2015 22
Pradesh
Uttar
Saharanpur 168 60 2015 26
Pradesh
Uttar
Khurja 167 60 2015 26
Pradesh
Muzzafarpur Bihar 164 60 2015 26
Nanded Maharashtra 162 60 2015 11
Uttar
Gorakhpur 162 60 2015 26
Pradesh
27
For few Cities where annual averages for 2015 were not easily available, lates data as well as for Gwalior data from 2014-2015 is included
28
Provided on after the current table
28City State Annual NAAQS Time Reference
Average (Annual) Frame Source28
Uttar
Mathura 162 60 2015 26
Pradesh
Madhya
Bhopal 158 60 2015 10
Pradesh
Uttar
Raebareli 157 60 2015 26
Pradesh
Udaipur Rajasthan 156 60 2015 26
Jodhpur Rajasthan 152 60 2015 18
Jalandhar Punjab 151 60 2015 17
Uttar
Noida 148 60 2015 26
Pradesh
Uttar
Meerut 146 60 2015 26
Pradesh
April 2015 -
Siltara Chhattisgarh 145 60 26
March 2016
Uttar
Varanasi 145 60 2015 26
Pradesh
Ludhiana Punjab 139 60 2015 17
Haldwani Uttrakhand 139 60 2015 23
April 2015 -
Raipur Chhattisgarh 138 60 26
March 2016
Nagaon Assam 137 60 2015 2
Panvel Maharashtra 137 60 2015 11
Uttar
Anpara 136 60 2015 22
Pradesh
Talcher Odisha 135 60 2015 15
Jamshedpur Jharkhand 134 60 2015 26
Kota Rajasthan 134 60 2015 26
Uttar
Sonbhadar 132 60 2015 26
Pradesh
Mandi
Punjab 130 60 2015 16
Gobindgarh
Gurgaon Haryana 129 60 2015 26
Akola Maharashtra 128 60 2015 12
Madhya August 2014
Gawalior 128 60 26
Pradesh - July 2015
Taloja Maharashtra 126 60 2015 11
Jammu &
Jammu 125 60 2015 6
Kashmir
29You can also read