The Competitive Effects of the Sharing Economy: How is Uber Changing Taxis? June 2015
←
→
Page content transcription
If your browser does not render page correctly, please read the page content below
The Competitive Effects of the Sharing Economy:
How is Uber Changing Taxis?
June 2015
Scott Wallsten
1099 NEW YORK AVE, NW SUITE 520 WASHINGTON, DC 20001
PHONE: 202.828.4405 E-MAIL: info@techpolicyinstitute.org WEB: www.techpolicyinstitute.org
The Competitive Effects of the Sharing Economy:
                           How is Uber Changing Taxis?
                                              Scott Wallsten ∗
                                               June 1, 2015

Abstract

The rise of the so-called “sharing economy” has created new competition across a number of
industries, most notably hotels, through Airbnb, and taxis, through ride-sharing services like
Uber, Lyft, and Sidecar. This paper explores the competitive effects of ride-sharing on the taxi
industry using a detailed dataset from the New York City Taxi and Limousine Commission of
over a billion NYC taxi rides, taxi complaints from New York and Chicago, and information
from Google Trends on the popularity of the largest ride-sharing service, Uber. I find that
controlling for underlying trends and weather conditions that might affect taxi service, Uber’s
increasing popularity is associated with a decline in consumer complaints per trip about taxis in
New York. In Chicago, Uber’s growth is associated with a decline in particular types of
complaints about taxis, including broken credit card machines, air conditioning and heating,
rudeness, and talking on cell phones.

While the data do not make it possible to derive the magnitude of the effects or calculate changes
in consumer surplus, the results provide evidence that Uber has created an alternative for
consumers who would have otherwise complained to the regulator and encouraged taxis to
improve their own service in response to the new competition.

∗
  I am grateful to Bob Hahn, Tom Lenard, Jeffrey Macher, Greg Rosston, Amy Smorodin, and Olga Ukhaneva for
helpful comments and to Nathan Kliewer for excellent research assistance. I am responsible for any mistakes.
Introduction
Seemingly overnight, the so-called “sharing economy” has turned traditionally underused assets
into competitors to established industries. Some believe this business model will threaten
incumbents across the economy. 1 How widespread the sharing economy will be remains to be
seen, but to date it has had unquestionably large effects on the hotel industry through Airbnb and
the taxi industry through ride-sharing services like Uber, Lyft, and Sidecar. 2 The development of
new services that did not previously exist almost by definition make consumers better off. 3 The
benefits to consumers, however, are likely to extend beyond those who use these new services if
incumbents are forced to respond to new competition by improving service and/or reducing
price.
The rapid growth of ride-sharing has upended the taxicab industry, which is traditionally heavily
regulated. Incumbents’ most prominent reactions have been to lobby regulators to slow the
growth of ride-sharing. 4 They might, however, also try to retain customers by competing for
them in the market. However, regulations limit incumbents’ set of potential competitive
responses. Prices are regulated and change infrequently while taxi drivers cannot, on their own,
reduce prices or offer the frictionless payment systems ride-sharing services use. Even so, drivers
might respond by trying to offer higher quality rides than they used to provide. Improved quality
might take the form of, for example, being more courteous to passengers by turning off the radio,
not talking on a cell phone while driving, and so on. The difficulty of signalling this quality to a
potential passenger and lack of repeat business blunts this incentive, but with less business taxi
drivers may behave better in the hopes of bigger tips or to reduce the chances that a passenger
will complain. 5 If ride-sharing has generated this kind of competitive response by taxis then even
consumers who do not use ride-sharing may benefit.
In this paper I assemble data from New York City and Chicago to test that hypothesis
empirically. In particular, I test whether the growth in ride-sharing has led to a decrease in
consumer complaints about taxis. One benefit of regulation is that regulators often collect lots of
data. The New York City Taxi and Limousine Commission (TLC) provided me with data on
every taxi ride in the city from 2010 through 2014 (more than 1 billion observations). NYC’s
Open Data Project provides data on taxi complaints. Chicago does not routinely collect data on
taxi rides, but collects detailed complaint data. Ride-sharing companies are private and make
1
Or “Uber for everything,” as some seem to call it. http://techcrunch.com/2015/02/08/will-there-really-be-an-uber-
for-everything/
2
“Ride sharing” in this context does not mean multiple people sharing a cab. Instead, it means individual
transportation services where a passenger calls for a car using a mobile app and a driver responds and comes to pick
up the passenger. They are called “ride sharing” services because many of the cars are personal vehicles driven by
their owners rather than dedicated taxis.
3
See Bresnahan and Gordon (1997) for a collection of excellent essays on how economic analysis and statistics treat
new products and services. Timothy F Bresnahan and Robert J Gordon, The Economics of New Goods (Chicago:
University of Chicago Press, 1997), http://site.ebrary.com/id/10230044.
4
See Cannon and Summers (2014) for a discussion of Uber and regulators. Sarah Cannon and Lawrence Summers,
“How Uber and the Sharing Economy Can Win Over Regulators,” Harvard Business Review, October 13, 2014,
https://hbr.org/2014/10/how-uber-and-the-sharing-economy-can-win-over-regulators/.
5
Read one commentator’s view of taxis versus Uber: http://www.nytimes.com/2015/05/24/your-money/hey-driver-
hang-up-the-phone-turn-off-the-tv-and-step-on-it.html?rref=collection%2Fcolumn%2Fthe-haggler&_r=0
2little data available publicly. 6 Nevertheless, data from Google Trends on the largest of the ride-
sharing companies, Uber, makes it possible to generate an index of ride-sharing’s growing
popularity in NYC and Chicago.
The data reveal that the number of complaints per taxi trip in NYC has declined along with the
growth of Uber, even when controlling for underlying trends and seasonal events that may affect
taxi use. The results suggest that customers who used to complain now take their business
elsewhere and that taxi drivers are responding to competition from Uber by increasing the quality
of their own service. Data from Chicago also provide some evidence that cab drivers respond to
competition. In particular, in Chicago the growth of Uber was correlated with fewer complaints
by taxi riders about heating and air conditioning, broken credit card machines, and rude drivers.
To be clear, specific data on prices and quantity are necessary to estimate changes in consumer
welfare. Nevertheless, this paper is, to my knowledge, one of the first to begin to evaluate the
competitive effects of the sharing economy empirically. Hopefully future research will be able to
identify the ways in which the sharing economy affects the economy more precisely.
The “Sharing Economy” and Ride-Sharing Services
The so-called “sharing economy” generally refers to the phenomenon of turning unused or
under-used assets owned by individuals into productive resources. For example, homes and cars
represent significant investments but are underused relative to their potential. Homes are empty
much of the day or have empty rooms even when occupied by owners. Airbnb makes it possible
to rent those spaces. Cars mostly sit parked while their value depreciates. Uber, Lyft, and others
make it possible for anyone to use their cars to offer taxi-like services. Unemployed and
underemployed people, too, represent wasted productive assets. TaskRabbit and Mechanical
Turk allows anyone to offer a host of particular services.
The sharing economy generates value by matching these assets with consumers willing to pay for
the services those assets could provide. Those services, of course, have existed for ages—hotels
provide short-term accommodations, taxis provide flexible transportation for anyone, and temp
services provide jobs on short notice. The genius of the sharing economy, however, was to
harness new technologies—smartphones, GPS, payment systems, identification, feedback
mechanisms—to allow almost anyone with the right assets to make those services available
outside of the formal hotel and taxi industry. In other words, new technologies significantly
reduce the transaction costs of matching under-used assets to those willing to pay to employ
those assets. These new services are becoming ubiquitous. In a February 2015 survey,
PricewaterhouseCoopers (2015) found that 19 percent of US adults had “engaged in a sharing
economy transaction.”
Airbnb, for example, allows people to rent rooms, apartments, or houses. The services launched
in 2008, and by 2015 had more than 1 million listings in over 190 countries. 7 In October 2014
6
I contacted Uber in hopes of obtaining data, but in exchange for data the company wanted editorial input into the
paper. I appreciate Uber’s willingness to consider a data request and its concerns, but I chose not to pursue my
request as the conditions were not consistent with unbiased research.
7
https://www.airbnb.com/about/about-us
3the company was valued at more than $13 billion. By comparison, the Intercontinental Hotel
Group, the largest hotel chain in the world, had 674,000 rooms in over 100 countries had a
market cap of about $10 billion in March 2015. 8
Ride-sharing services turn vehicles that would otherwise sit unused into on-demand taxis. The
inputs have real costs, of course. While cars depreciate even when not in use, when in use they
consumer gas and are subject to wear and tear—all incremental costs relative to sitting unused in
a parking space. Additionally, drivers face an opportunity cost of their time, although an analysis
from Uber, discussed below, finds that drivers tend to work for Uber during times they would not
otherwise have worked, suggesting that the opportunity cost of time may be relatively low.
A consumer has a smartphone app that allows him to indicate he needs a pickup, and drivers on
the other side of the platform respond to the request. The app already has the consumer’s
payment information and a GPS device tracks the trip distance so the rider can enter and exit the
car while payment is charged automatically to his credit card. Neither the rider nor the driver
deal with payments. The ride-share company takes a percentage of the fare, and the rest goes to
the driver.
Lyft, Sidecar, and Uber are the most prominent ride-sharing services, with Uber by far the largest
of those. Uber was launched in 2009, and by mid-2014 had eight million users and 160,000
drivers in 250 cities across 50 countries. 9 In December 2014 venture capitalists valued Uber at
about $40 billion. 10
One reason for this remarkable success was undoubtedly the ability of technology to break down
artificial regulatory entry barriers. Most cities, for example, restrict the number of taxis allowed
to operate. As a result, either prices were higher than they would have been otherwise or there
were not enough cabs to meet demand. 11 In NYC, the lack of supply relative to demand caused
taxi medallions (permits) to sell for over $1 million by 2013. 12 By 2015, however, the price of a
medallion had fallen by about 25 percent in response to competition from ride-sharing services.
While consumers flocked to these new services, traditional hotel and taxi companies flocked to
their regulators and politicians, hoping to block these new competitors. 13 Many regulators have
been sympathetic to their claims, and some cities and countries have even banned these
8
http://www.bloomberg.com/quote/IHG:LN
9
http://expandedramblings.com/index.php/uber-statistics/
10
https://hbr.org/2014/12/making-sense-of-ubers-40-billion-valuation
11
The Federal Trade Commission has documented this effect of taxi regulation throughout the years. For an early
study, see, for example, Mark W. Frankena and Paul A. Pautler, An Economic Analysis of Taxicab Regulation,
Bureau of Economics Staff Report (Federal Trade Commission, May 1984),
https://www.ftc.gov/sites/default/files/documents/reports/economic-analysis-taxicab-regulation/233832.pdf.
12
http://www.nytimes.com/2015/01/08/upshot/new-york-city-taxi-medallion-prices-keep-falling-now-down-about-
25-percent.html?_r=0&abt=0002&abg=1
13
For some reporting on the regulatory response by the traditional taxi industry, see
http://www.bloomberg.com/news/articles/2015-03-11/inside-big-taxi-s-dirty-war-with-uber and
http://www.forbes.com/sites/larrydownes/2013/02/06/lessons-from-uber-why-innovation-and-regulation-dont-mix/.
Uber has apparently responded with its own lobbying, and employs more than 160 lobbyists, according to one
report. http://www.theverge.com/2014/12/14/7390395/uber-lobbying-steamroller
4services, 14 but demand for these services has been so strong that they have been able to
overcome much of this hostility (with exceptions, of course, like France and Las Vegas). 15
At least part of Uber’s response to regulatory threats has been to release studies highlighting
benefits to the drivers. Uber has claimed that a full-time driver can make $75,000 - $90,000
annually, compared to the $30,000 typical of a taxi driver, 16 although some have questioned
those numbers. 17 Hall and Krueger (2015) note in a study done for Uber that in the first three
months of 2014 Uber distributed $657 million to drivers in the United States. 18 They also found
that drivers tend to sign up because of the flexibility of the work and that many use Uber as a
way to smooth income, either between jobs or as a complement to other jobs. 19
The appeal among consumers is self-evident from the rapid growth of the service. And price may
not be the primary reason consumers use the service. Salnikov et al (2015) find that UberX—the
less expensive of the Uber options—is not always cheaper than a taxi for a given ride. 20 To be
sure, Uber appears to recognize that price matters, having cut prices in January 2015. 21 Even so,
the Salnikov et al (2015) results imply that consumers also value other aspects of the service,
such as frictionless payments or nicer cars.
Taxis have long faced imperfect competition—from public transportation like buses and
subways to car services that pick up passengers who request a ride (generally via telephone) and
so-called “gypsy cabs.” But Uber and other ride-sharing services appear to compete more
directly with taxis if for no other reason than their increasing ubiquity as a convenient, on-
demand, means of transportation.
As competition increases, consumers have new options and incumbents may be forced to
respond. The sharing economy is unambiguously increasing competition. Zervas et al (2015)
study the effects of Airbnb on the hotel industry in Texas, finding more rentals on Airbnb
associated with lower hotel revenues and prices. 22
In the traditional taxi world, dissatisfied consumers had few options. They could incur extra costs
to avoid taxis—in terms of convenience if switching to the bus or subway or in terms of money if
switching to car services or using one’s own car instead of taking cabs. Alternatively, they could
14
http://www.engadget.com/2015/03/18/germany-bans-uber-once-again-over-permit-issues/
15
http://www.reuters.com/article/2015/05/22/us-france-taxis-idUSKBN0O70TV20150522 ;
http://www.forbes.com/sites/harrycampbell/2015/04/17/uber-cant-get-to-las-vegas-soon-enough/
16
http://www.washingtonpost.com/blogs/innovations/wp/2014/05/27/ubers-remarkable-growth-could-end-the-era-
of-poorly-paid-cab-drivers/
17
http://www.businessinsider.com/uber-drivers-say-theyre-making-less-than-minimum-wage-2014-10
18
Jonathan V. Hall and Alan B. Krueger, “An Analysis of the Labor Market for Uber’s Driver-Partners in the
United States” (Uber, January 22, 2015), https://s3.amazonaws.com/uber-static/comms/PDF/Uber_Driver-
Partners_Hall_Kreuger_2015.pdf.
19
Ibid.
20
Vsevolod Salnikov et al., “OpenStreetCab: Exploiting Taxi Mobility Patterns in New York City to Reduce
Commuter Costs” March 10, 2015.
21
http://blog.uber.com/PriceCut2015
22
Georgios Zervas, Davide Proserpio, and John Byers, “The Rise of the Sharing Economy: Estimating the Impact of
Airbnb on the Hotel Industry” February 12, 2015, http://ssrn.com/abstract=2366898.
5complain about the poor service to the taxi regulator. Either way, taxi cabs had little incentive to
improve service.
In the new world of taxi competition, consumers can switch providers at low cost. As a result,
traditional taxis may face a new incentive to compete. Competing on price in the short run is
difficult—prices are typically regulated and change infrequently. They might also compete on
quality—making sure their cars are clean and features like credit card readers operable, running
the air conditioner in the summer, not talking on cell phones, and so on.
Of course, the incentive to improve quality is blunted by the problems of signaling and lack of
repeated interactions. In particular, how is a driver cruising for fares able to demonstrate to
potential riders that he offers a high-quality ride? One way to generate that signal might be
through newer cars, so perhaps we might expect to see the average age of taxi fleets drop over
time. 23
Taxi Complaints
Other than the age and type of vehicle (in some cities), it is not generally possible to directly
observe taxi or driver quality. However, as in most regulated industries, consumers can complain
to the regulator about service. Complaints appear to both serve as a proxy for quality and reveal
when consumers begin to have the option to exit the market rather than file complaints. In
particular, Forbes (2008) uses data from the Department of Transportation on airline complaints
to explore the relationship between complaints and quality. 24 She finds that complaints decrease
as quality increases, but also that consumers are more likely to complain when they expect high
quality.
One problem with complaints as an indicator of quality is that complaining to a regulator
requires non-trivial effort by the consumer, who has to remember the cab’s ID for the complaint
to have any meaning. 25 And in exchange for having undertaken that effort the consumer gets
nothing other than, perhaps, the satisfaction of venting their anger. While the effort required and
expected response differs by city, complaints are likely a combination of reports from people
who experienced truly egregious taxi-related problems, do not place an especially high value on
their time, and people who enjoy kvetching.
Beard, Macher, and Mayo (2015) confirm Forbes’s (2008) result, finding that competition
increases service quality by the incumbent. However, consistent with the point that complaining
23
Some evidence suggests that the taxi fleet may, in fact, be getting younger. The NYC TLC reported that in 2013
the average age of a taxi was 3.3 years (http://www.nyc.gov/html/tlc/downloads/pdf/2014_taxicab_fact_book.pdf).
Meanwhile, a current dataset of the more than NYC 13,000 taxis on the road shows the average taxi to be a 2013
model, implying an age of about 2 years (https://data.cityofnewyork.us/Transportation/Yellow-Medallion-Taxicabs-
Vehicles/g8fi-we5z). Without more data, however, it is not possible to know whether that change reflects a
competitive response or is merely following a pre-existing trend, due to routine and regular fleet turnover, or
otherwise unrelated to Uber.
24
Silke J. Forbes, “The Effect of Service Quality and Expectations on Customer Complaints,” The Journal of
Industrial Economics 56, no. 1 (March 1, 2008): 190–213, doi:10.2307/25483403.
25
It is not always straightforward how to file a complaint. NYC’s website seems to lead the consumer in an endless
loop of clicks to complain. http://www.nyc.gov/html/tlc/html/passenger/sub_consumer_compl.shtml
6entails a cost with few benefits to the complainer, they note that voice and exit can be substitutes
and construct a model of how consumers might decide between complaining and switching
firms. 26 They use data on complaints about telecommunications providers from the US Federal
Communications Commission to test their theory and find that consumers are more likely to
switch providers the more competition exists in the market.
Like those two papers, I evaluate complaint data in the presence of competition. The key insights
from Forbes (2008) and Beard, Macher, and Mayo (2009) are that a relationship between
complaints about the incumbent may indicate something about how complainers behave or how
the incumbents respond to competition. The interpretation of any results must be cognizant of
these effects.
The next section describes the datasets I use to explore the relationship between taxi complaints
and Uber.
Data and Empirical Analysis
I assembled datasets for two cities: New York and Chicago. Unfortunately, each city collects
different statistics, making it necessary to analyze the datasets separate rather than pooling them.
The key difference is that NYC has more detailed data on taxi rides while Chicago has more
detailed data on complaints.
As ride-sharing firms are private, largely-unregulated companies, data are not as easily
obtainable. New data tools, however make it possible to create an index of the popularity of ride-
sharing. In particular, Google Trends has been shown to track economic activity and can
generate an index of the popularity of ride-sharing over time.
Perhaps the first use of Google searches as an indicator was Google Flu, launched in 2008 as a
tool using searches to predict the prevalence of flu before official data could be compiled. Varian
and Choi (2009) extended this approach by demonstrating that Google search trends (now called
“Google Trends”) can be used to track economic activity in real time. 27 They show the accuracy
of Google Trends in tracking retail sales, automotive sales, home sales, and travel. Wu and
Brynjolfsson (2015) show that Google Trends make better predictors of housing sales and prices
than more traditional indicators. 28 Because Uber is by far the largest ride-sharing company, 29 I
obtained from Google Trends indices of searches for “Uber” in New York City and Chicago.
26
Randolph T. Beard, Jeffrey T. Macher, and John W. Mayo, “‘Can You Hear Me Now?’ Exit, Voice and Loyalty
under Increasing Competition” February 2015.
27
Hyunyoung Choi and Hal R. Varian, “Predicting the Present with Google Trends” April 10, 2009,
http://static.googleusercontent.com/media/www.google.com/en/us/googleblogs/pdfs/google_predicting_the_present.
pdf.
28
Lyn Wu and Erik Brynjolfsson, “The Future of Prediction: How Google Searches Foreshadow Housing Prices and
Sales,” in Economic Analysis of the Digital Economy, ed. Avi Goldfarb, Shane Greenstein, and Catherine Tucker,
2015.
29
A report of credit card charges by FutureAdvisor in 2014 found that Uber had more than ten times Lyft’s revenues
and seven times the number of rides as Lyft. http://fortune.com/2014/09/11/uber-vs-lyft-the-credit-cards-dont-lie/.
When comparing Uber and Lyft on Google Trends, the Uber index is, on average over time, 13 times larger than the
Lyft index.
7While the index should provide us with a meaningful indicator of Uber’s growth, it has certain
disadvantages. Most importantly, as an index it will not be possible to estimate useful
magnitudes of any effects. In particular, the index makes it possible to determine whether the
two are correlated, but not by how much Uber’s growth affects complaints. Nevertheless, it
provides a starting point to begin empirically exploring the competitive effects of Uber.
New York City
The NYC Taxi and Limousine Commission (NYCTLC) collects detailed data on taxi rides from
cab meters and provided those data under New York State’s Freedom of Information Law. 30 In
particular, the Commission provided data on every taxi ride from 2009 through 2014, including
information on distance traveled and fare paid. The entire dataset is over 150 Gb and included
information on over one billion rides. 31
The data show the decline in the traditional taxi industry since Uber’s entry. Figure 1 shows the
number of daily taxi trips in NYC from 2009 through 2014. Uber entered NYC in May 2011, 32
apparently leading to a generally downward trend in the number of trips.
Figure 1: Daily Taxi Trips (Thousands)
Note: Data for the second half of 2009 is missing from the dataset; I am trying to obtain it from NYC. The trend line
on the left is obtained from regressing the number of rides on a constant and time until Uber’s entry. The trend line
on the right is the same regression estimated from Uber’s entry to the present.
30
I am grateful to the staff of the TLC for providing us with this data.
31
The data actually go back to 2008, but do not appear to have been consistently reported until sometime in 2009.
Unfortunately, about six months of data from 2009 were missing, making it best to start the analysis in 2010.
32
http://sanfrancisco.cbslocal.com/2015/03/18/more-uber-cars-new-york-city-streets-traditional-taxicabs-
ridesharing/
8Just as consumers can complain to DOT or the FCC about problems with services regulated by
those agencies, so, too, can taxi riders complain to the NYCTLC. Data on taxi complaints is
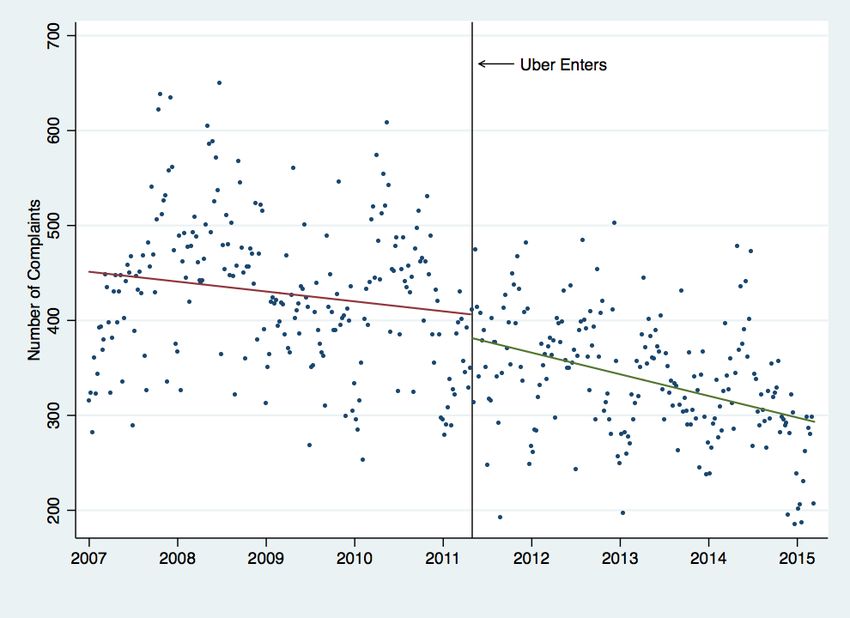
readily available for download via NYC’s Open Data platform. 33 Figure 2 shows weekly
complaint data. The figure shows that the number of complaints was already trending downward
before Uber entered the market, with the downward trend increasing somewhat after entry.
Figure 2: Number of Taxi Complaints Submitted to NYCTLC
Of course, if Uber is affecting the number of taxi rides then it will be important to normalize
complaints—obviously if the number of rides is decreasing then the number of complaints is also
likely to decrease. The normalized figure is different. Figure 3 shows the number of complaints
per ride, which was decreasing prior to Uber’s entry and continued to decrease after entry, but at
a slower rate.
33
Many cities participate in the Open Data project, but New York seems to have the most detailed data available.
https://nycopendata.socrata.com/
9Figure 3: Taxi Complaints per Hundred Thousand Rides
Of course, just as with the earlier data, a number of factors unrelated to Uber could affect these
trends, and the econometric analysis will have to control for them.
The Google Trend index for Uber’s search popularity in New York City shows a steady increase
beginning in around 2012 (Figure 4). The spike just before entry reflects Uber’s March 2011
announcement of its intended entry into NYC.
10Figure 4: Google Trend for "Uber" Search in NYC
To examine the data econometrically I aggregate to the lowest common unit of measurement,
which is that provided by Google Trends: weeks. In other words, an observation in the
econometric analysis is a week-year (to account for seasonality).
As a first step, it may be instructive to examine the relationship between the Google Uber index
and the number of taxi rides. All else equal, does Uber’s rise correspond to a decrease in the
number of taxi rides? To examine this relationship, I estimate the following regression:
yt = f(Ubert, Wt, week, year)
where yt is the natural log of taxi trips, Wt includes the natural log of variables measuring
temperature and precipitation, week is week fixed effects (i.e., indicator variables for weeks 1 –
52), year is year fixed effects, and t indexes the week-year of the observation.
The fixed effects are especially important for two reasons. First, as Figure 1 showed, the number
of trips is cyclical. Second, overall trends in taxi ridership might change for reasons other than
entry. For example, taxi fares increased by 17 percent on September 4, 2012. 34 Weather data,
from NOAA, controls for weather, which may affect demand for taxi rides. 35
34
Without the fixed effects one might add a dummy variable to indicate when the fare increase took effect, but the
fixed effects already control for the effects of the fare increase since the dummy variable indicating the fare increase
is in effect is a linear combination of certain month and year dummy variables.
35
NOAA provided daily measurements precipitation and high and low temperature readings from a weather
monitoring station in Central Park.
11Table 1 shows the results of this regression. The results show fewer taxi rides when it snows,
fewer with colder temperatures, and more with warmer temperatures. The Uber index, as
expected, consistently shows fewer taxi trips as Uber grows.
Table 1: Regression Results of Number of Taxi Trips on Uber Index, NYC
-0.001*
Uber index
(0.074)
-0.025
ln (precipitation)
(0.205)
-0.051***
ln (snow depth)
(0.000)
0.092*
ln (max temp)
(0.074)
-0.046**
ln (min temp)
(0.010)
0.759***
Constant
(0.000)
Week and year fixed effects
included
Observations 227
R-squared 0.626
pval in parentheses
*** pTable 2: New York City Regression Results
VARIABLES Complaints per Trip Complaints per Mile Complaints
uberindex -0.002** -0.002* -0.001* -0.001 -0.002*** -0.002** -0.002** -0.002** -0.003*** -0.003*** -0.003*** -0.003***
(0.041) (0.068) (0.097) (0.119) (0.008) (0.013) (0.033) (0.047) (0.001) (0.001) (0.001) (0.001)
precipitation 0.024 0.026 0.038 0.041 -0.005 -0.001
(0.458) (0.425) (0.237) (0.196) (0.872) (0.986)
snow 0.068*** 0.084*** 0.061** 0.090*** -0.010 -0.003
(0.007) (0.003) (0.018) (0.003) (0.672) (0.909)
max temp -0.006 0.022 0.003 0.034* 0.009 0.008
(0.741) (0.273) (0.879) (0.079) (0.590) (0.663)
Constant -9.005*** -8.997*** -9.032*** -9.063*** -10.030*** -10.256*** -10.049*** -10.353*** 5.830*** 5.578*** 5.833*** 5.581***
(0.000) (0.000) (0.000) (0.000) (0.000) (0.000) (0.000) (0.000) (0.000) (0.000) (0.000) (0.000)
Observations 260 258 260 258 245 243 245 243 271 268 271 268
R-squared 0.689 0.686 0.703 0.702 0.714 0.712 0.727 0.731 0.761 0.763 0.762 0.763
pval in parentheses
*** pChicago
The city of Chicago does not make detailed taxi trip data available. According to the city’s
response to a Freedom of Information Act Request, those data cannot be made public because it
would be too resource-intensive to produce them 37 and because the city believes existing reports
contain personal information not subject to disclosure rules. Chicago does, however, make public
a different measure of taxi supply: medallion prices and number of trades over time.
Figure 5 shows the average weekly medallion prices and number of transfers from 2008 through
March 2015. Prices peaked at about $400,000 in July 2012 and have trended downward slightly
since then, in contrast to the upward trend from the beginning of the data in 2008. The market
has become thinner over time, as well, with the number of transfers peaking at 538 in 2012 and
decreasing to 91 in 2014 and only seven from January through April 2015.
Figure 5: Taxi Medallion Prices and Transfers in Chicago
Chicago also tracks and makes available taxi complaints over time. Unlike NYC, Chicago
records the type of complaint. Figure 6 shows weekly counts of each type of complaint over
time. Table 3 shows the average weekly counts by year.
37
“Any need for reports would span more than one day or more than one taxicab, [sic] would require the
Department of Business Affairs and Consumer Protection to request a report from the external company that
maintains the data.” Response to Freedom of Information request, April 28, 2015. See Appendix.
14Figure 6: Taxi Complaints by Complaint Subject, Chicago
350
300 Other
Reckless Driving
250
AC Problem
Unsafe/Mechanical Problem
200
Took Long Way
150 Didn't Know Route
Verbal Assault
100 Driver on Cell Phone
Pickup Refused
50
Overcharge
CC problem
0
2008w11
2008w21
2008w31
2008w41
2008w51
2009w19
2009w29
2009w39
2009w49
2010w17
2010w27
2010w37
2010w47
2011w15
2011w25
2011w35
2011w45
2012w13
2012w23
2012w33
2012w43
2013w11
2013w21
2013w31
2013w41
2013w51
2014w19
2014w29
2014w39
2014w49
2015w17
2008w1
2009w9
2010w7
2011w5
2012w3
2013w1
2014w9
2015w7
Rude
The figure and table show that the most common complaint is regarding reckless driving and,
moreover, complaints about reckless driving spiked in early 2012. This increase was apparently
due to a new rule requiring taxis to display a bumper sticker that read, “How’s my driving?
Compliments or Concerns, Call 311 Report Taxi Number ____” and a related publicity
campaign. After reckless driving the most common complaints, in order of frequency, are about
rude drivers, credit card problems, being overcharged, not being picked up, drivers being on their
cell phones.
Table 3: Chicago Taxi Complaints by Type
Figure 7 shows the Uber index for Chicago, which Uber officially entered on September 11,
2011. 38 The index looks similar to the index for New York, which is not surprising given that
Uber entered the Chicago market only four months after it entered the New York market.
38
http://blog.uber.com/chicagotaxicrime
15Figure 7: Chicago Google Trends Uber Index
Consistent with the results from NYC data suggesting Uber’s growth being correlated with
reduced demand for traditional taxis, a similar analysis reveals a negative correlation between the
Uber index and the value of a taxi medallion in Chicago. However, although Figure 5 suggested
otherwise, the regression analysis finds no statistically significant correlation between the Uber
index and the number of medallion transactions when controlling for fixed effects.
Table 4: Regression of Medallion Prices and Transfers on Uber Index
Because I do not have the number of taxi trips for Chicago, I cannot normalize the complaint
data as above. I estimate two different specification types to mitigate the effects of this problem.
First, I use medallion prices and number of transfers as a proxy for taxi ride quantity and include
16those as a control variable in log-level regressions. That is, in the first instance I regress the
number of different types of complaints on the medallion variables as well as the other variables
discussed above.
Second, I use as the dependent variable the complaint type as a share of all complaints. 39 If taxi
drivers are trying to offer a higher quality service we might expect to see a decrease in the share
of complaints about things the driver can control and the passenger likely to notice, like
rudeness, cell phone usage, and air conditioning and heating problems. We might also expect to
see a decrease in complaints regarding broken credit card machines, both because the cab
company invests more effort into maintaining the equipment and because the driver is less likely
to claim the reader is broken because he prefers cash.
I therefore estimate several regressions, each with a different complaint (either log-share or
level) as the dependent variable. Table 2 shows the results of the levels regressions and Table 3
shows the results of the share regressions.
The most robust result is a statistically significant negative correlation between the Uber index
and complaints about a cab’s air conditioning and heating. The regressions also show a
statistically significant negative correlation between the Uber index and complaints about non-
working credit card readers and drivers on cell phones in specifications that do not control for
medallions. Complaints about rude drivers are negatively correlated with the Uber index when
controlling for the number of medallion transfers, but not when including only the other controls.
Oddly, in one of eight specifications, complaints about dirty cabs was positively correlated with
the Uber index. No other complaint types were statistically correlated with the Uber index.
39
More accurately, it is the share of complaints not including reckless driving, since that measure was affected so
strongly by the bumper sticker campaign.
17Table 5: Regression of Complaint Type on Uber Index, Chicago, log-shares
Table 6: Regression of Complaint Type on Uber Index, Chicago, Log-Levels
18Discussion and Conclusion
The results from New York City and Chicago are consistent with the idea that taxis respond to
new competition by improving quality. In New York, Uber’s rise is associated with decreases in
per-trip complaints to the city. We know from Beard, et al (2015) that competition causes some
people to switch companies instead of complain. 40 Some of the decrease in complaints, then, is
surely because people who would have complained without a taxi competitor chose to switch
rather than bother filing a complaint. But we also know from Beard, et al and Forbes (2008) that
complaints are correlated with quality, 41 implying that the results are not inconsistent with an
increase in taxi quality.
The analysis of Chicago data adds evidence that Uber has caused cabs to improve quality. In
particular, in Chicago the data suggest that complaints about things a driver might do to affect
quality—use of air conditioning, “broken” credit card machines, rudeness, and talking on cell
phones—all seem to have decreased along with Uber’s rise. Sometimes credit card machines are
“broken” (i.e., the driver refuses to use it) and sometimes they are really broken. A decrease in
complaints about credit card machines could reflect better maintenance, better behavior, or both.
At the same time, complaints about cabs cutting in line, overcharging, and taking long routes do
not appear correlated with Uber’s rise.
To be sure, this analysis has shortcomings. As discussed above, the data on Uber are not actual
measurements of Uber use. They are data on the prevalence of Google searches for “Uber” in
New York and Chicago. Because it is a search index rather than a measure of the number of
Uber trips, it is impossible to move the analysis beyond “asterisk economics.” 42
In other words, do these correlations translate into economically meaningful effects? News
reports suggest that taxi drivers want to compete with Uber. Long Beach, CA, for example,
decided to allow cabs to offer variable fares to compete with Uber. 43 If drivers are willing to
reduce prices to compete, it seems possible that they would also make changes that are relatively
costless. While the lack of repeat business in the same taxi might reduce the benefits to a driver
of better behavior, he might still benefit from higher tips and lower likelihood of complaints.
Even with its limitations, this analysis begins to shed empirical light on the competitive effects of
the sharing economy, demonstrating that benefit may accrue not just to those who avail
themselves of new options, like ride-sharing, but also to those who stick with traditional
providers. Hopefully future research can move beyond these correlations and begin to quantify
the effects.
40
Beard, Macher, and Mayo, “‘Can You Hear Me Now?’ Exit, Voice and Loyalty under Increasing Competition.”
41
Forbes, “The Effect of Service Quality and Expectations on Customer Complaints.”
42
The phrase “asterisk economics” was coined by Ziliak and MclCloskey (2004) to indicate research that focuses on
statistical significance at the expense of economic significance. Stephen T. Ziliak and Deirdre N. McCloskey, “Size
Matters: The Standard Error of Regressions in the American Economic Review,” The Journal of Socio-Economics
33, no. 5 (November 2004): 527–46, doi:10.1016/j.socec.2004.09.024.
43
Laura J. Nelson, “Long Beach Allows Taxis to Lower Fares as They Compete with Uber, Lyft,” The Los Angeles
Times, May 14, 2015, http://www.latimes.com/local/california/la-me-long-beach-uber-20150514-story.html.
19Bibliography
Beard, Randolph T., Jeffrey T. Macher, and John W. Mayo. “‘Can You Hear Me Now?’ Exit,
Voice and Loyalty under Increasing Competition,” February 2015.
Bresnahan, Timothy F, and Robert J Gordon. The Economics of New Goods. Chicago:
University of Chicago Press, 1997. http://site.ebrary.com/id/10230044.
Cannon, Sarah, and Lawrence Summers. “How Uber and the Sharing Economy Can Win
Over Regulators.” Harvard Business Review, October 13, 2014.
https://hbr.org/2014/10/how-uber-and-the-sharing-economy-can-win-over-
regulators/.
Choi, Hyunyoung, and Hal Varian. “Predicting the Present with Google Trends.” Economic
Record 88 (June 2012): 2–9. doi:10.1111/j.1475-4932.2012.00809.x.
Choi, Hyunyoung, and Hal R. Varian. “Predicting the Present with Google Trends,” April 10,
2009.
http://static.googleusercontent.com/media/www.google.com/en/us/googleblogs/
pdfs/google_predicting_the_present.pdf.
Forbes, Silke J. “The Effect of Service Quality and Expectations on Customer Complaints.”
The Journal of Industrial Economics 56, no. 1 (March 1, 2008): 190–213.
doi:10.2307/25483403.
Frankena, Mark W., and Paul A. Pautler. “An Economic Analysis of Taxicab Regulation.”
Bureau of Economics Staff Report. Federal Trade Commission, May 1984.
https://www.ftc.gov/sites/default/files/documents/reports/economic-analysis-
taxicab-regulation/233832.pdf.
Hall, Jonathan V., and Alan B. Krueger. “An Analysis of the Labor Market for Uber’s Driver-
Partners in the United States.” Uber, January 22, 2015.
https://s3.amazonaws.com/uber-static/comms/PDF/Uber_Driver-
Partners_Hall_Kreuger_2015.pdf.
Nelson, Laura J. “Long Beach Allows Taxis to Lower Fares as They Compete with Uber,
Lyft.” The Los Angeles Times, May 14, 2015.
http://www.latimes.com/local/california/la-me-long-beach-uber-20150514-
story.html.
Salnikov, Vsevolod, Renaud Lambiotte, Noulas Anastasios, and Mascolo Cecilia.
“OpenStreetCab: Exploiting Taxi Mobility Patterns in New York City to Reduce
Commuter Costs,” March 10, 2015.
Wu, Lyn, and Erik Brynjolfsson. “The Future of Prediction: How Google Searches
Foreshadow Housing Prices and Sales.” In Economic Analysis of the Digital Economy,
edited by Avi Goldfarb, Shane Greenstein, and Catherine Tucker, 2015.
Zervas, Georgios, Davide Proserpio, and John Byers. “The Rise of the Sharing Economy:
Estimating the Impact of Airbnb on the Hotel Industry,” February 12, 2015.
http://ssrn.com/abstract=2366898.
20Ziliak, Stephen T., and Deirdre N. McCloskey. “Size Matters: The Standard Error of
Regressions in the American Economic Review.” The Journal of Socio-Economics 33,
no. 5 (November 2004): 527–46. doi:10.1016/j.socec.2004.09.024.
21You can also read