CADDY Underwater Stereo-Vision Dataset for Human-Robot Interaction (HRI) in the Context of Diver Activities - MDPI
←
→
Page content transcription
If your browser does not render page correctly, please read the page content below
Journal of
           Marine Science
           and Engineering

Data Descriptor
CADDY Underwater Stereo-Vision Dataset for
Human–Robot Interaction (HRI) in the Context of
Diver Activities
Arturo Gomez Chavez 1, * , Andrea Ranieri 2 , Davide Chiarella 3 , Enrica Zereik 2 ,
Anja Babić 4 and Andreas Birk 1
 1    Robotics Group, Computer Science & Electrical Engineering, Jacobs University Bremen, Campus Ring 1,
      28759 Bremen, Germany; a.birk@jacobs-university.de
 2    Institute of Marine Engineering—National Research Council, Via E. De Marini 6, 16149 Genova, Italy;
      andrea.ranieri@cnr.it (A.R.); enrica.zereik@cnr.it (E.Z.)
 3    Institute for Computational Linguistics—National Research Council, Via E. De Marini 6, 16149 Genova, Italy;
      davide.chiarella@cnr.it
 4    Faculty of Electrical Engineering and Computing, University of Zagreb, Unska ul. 3, 10000 Zagreb, Croatia;
      anja.babic@fer.hr
 *    Correspondence: a.gomezchavez@jacobs-university.de; Tel.: +49-421-200-3189

 Received: 18 December 2018; Accepted: 10 January 2019; Published: 16 January 2019

 Abstract: In this article, we present a novel underwater dataset collected from several field trials
 within the EU FP7 project “Cognitive autonomous diving buddy (CADDY)”, where an Autonomous
 Underwater Vehicle (AUV) was used to interact with divers and monitor their activities. To our
 knowledge, this is one of the first efforts to collect a large public dataset in underwater environments
 with the purpose of studying and boosting object classification, segmentation and human pose
 estimation tasks. The first part of the dataset contains stereo camera recordings (≈10 K) of divers
 performing hand gestures to communicate with an AUV in different environmental conditions.
 The gestures can be used to test the robustness of visual detection and classification algorithms in
 underwater conditions, e.g., under color attenuation and light backscatter. The second part includes
 stereo footage (≈12.7 K) of divers free-swimming in front of the AUV, along with synchronized
 measurements from Inertial Measurement Units (IMU) located throughout the diver’s suit (DiverNet),
 which serve as ground-truth for human pose and tracking methods. In both cases, these rectified
 images allow the investigation of 3D representation and reasoning pipelines from low-texture targets
 commonly present in underwater scenarios. This work describes the recording platform, sensor
 calibration procedure plus the data format and the software utilities provided to use the dataset.

 Keywords: dataset; underwater imaging; image processing; marine robotics; field robotics;
 human–robot interaction; stereo vision; object classification; human pose estimation

1. Introduction
     From the robotics perspective, underwater environments present numerous technological challenges
for communication, navigation, image processing and other areas. There are unique sensors’ problems
due to the electromagnetic waves being attenuated very strongly: there is no GPS-based localization,
no radio communication and there are only limited possibilities of using visible light. Acoustics sensors
are mostly used, but they offer only low bandwidth and high latency transmissions. It is no surprise
that most of the applications such as biological sample acquisition, archaeological site exploration,
and industrial manipulation still require human intervention for their successful completion.

J. Mar. Sci. Eng. 2019, 7, 16; doi:10.3390/jmse7010016                               www.mdpi.com/journal/jmse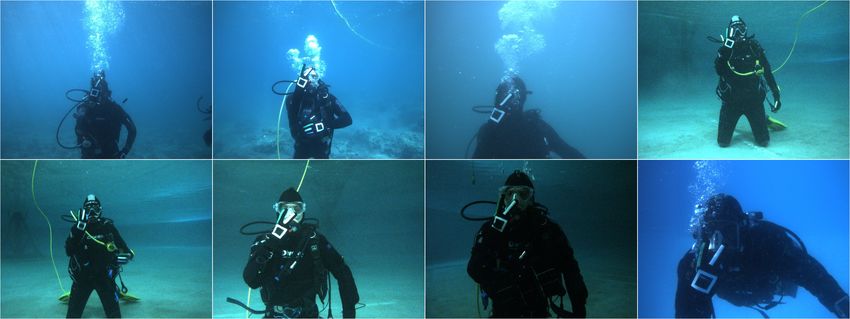
J. Mar. Sci. Eng. 2019, 7, 16                                                                       2 of 14

      For this reason, the EU FP7 project “Cognitive autonomous diving buddy (CADDY)” focused on
diver–robot cooperation. An Autonomous Underwater Vehicle (AUV) monitors the divers’ activities,
while communicating with them and performing multiple tasks on command [1]. During this project,
a unique set of data was recorded covering two main aspects: (a) diver gesture recognition on a sign
language dubbed CADDIAN [2,3] (derived from the name CADDY), which includes standard diving
signals, as well as (b) diver pose estimation using stereo images and inertial sensor measurements
mounted in a tailor-made diving suit, called DiverNet [4].
      Although exhaustive underwater surveys and performance evaluations of object recognition and
stereo systems [5,6] have been performed, commonly, these reviews benchmark scientific methods
across datasets targeted for different applications or use very constrained datasets. This is due to
the difficulty and cost of underwater data collection and the relatively small size of the datasets
compared to on-land robotics. Only recently, efforts to gather data from different closed and open-water
environments to study cutting edge data-driven (deep learning) methods [7,8] have been made.
      The work in [7] focuses on the diver-detection network architecture design, and Ref. [8] tackles
human–robot collaboration by adapting existing on-land gesture recognition methods based on skin
detection to scenarios where the diver does not need gloves. Nonetheless, these publications do not
thoroughly describe the training data, which in general can give insights to the users to develop their
own approach or about the strength and weaknesses of existing methods. In addition, these datasets
are not publicly available.
      The work presented here aims to provide (a) an open, publicly available dataset with (b) a detailed
description of the collected data by explaining qualitatively and quantitatively the environmental
conditions of each recording. The data also contain samples not only of closed and open-water settings
but of dynamic scenarios, e.g., where currents are strong and the diver or the AUV are not static. In this
way, users of our datasets can methodically study the behavior and performance of their approaches
in each type of scenario.
      Furthermore, the available rectified stereo images allow for testing 2D and 3D perception cues,
as well as a fusion of both. It is of special interest to investigate 3D algorithms in these environments
where image features are scarce and texture is often uniform. To the best of our knowledge, this is the
first public underwater dataset focusing on human–robot interaction between AUV and divers using
stereo imagery.
      It is important to note that the use of these data is not limited to recognition and pose estimation
tasks; it can serve as a basis for any vision-based algorithm in underwater applications. This stems
from the fact that the data were recorded in different environmental conditions that cause various
image distortions unique to underwater scenarios, i.e., low contrast, color distortion, and haze [9],
which cannot be easily replicated from on-land recordings or in simulation.
      The presented work is structured as follows. First, Section 2 describes the hardware and sensor
setup used to record the data. Section 3 examines the collected dataset; specifically, Sections 3.1
and 3.2 analyze the dynamic and environmental conditions from the recordings and how they impact
the quality of the captured stereo images. Sections 3.3 and 3.4 present the diver gestures and pose
estimation datasets respectively, each with subsections describing details of the data content, storage
and the provided directories and software for their usage. Finally, conclusions and remarks about the
importance of this work are made in Section 4.

2. Sensor Setup

2.1. BUDDY AUV
     To collect data and perform real diver missions, the BUDDY-AUV was specifically designed by the
University of Zagreb during the CADDY project [10]. The vehicle is fully actuated and it is equipped
with navigation sensors: Doppler velocity log (DVL) and ultra-short baseline (USBL); and perception
sensors: multibeam sonar and a stereo camera in an underwater housing. In addition, it has a tablet in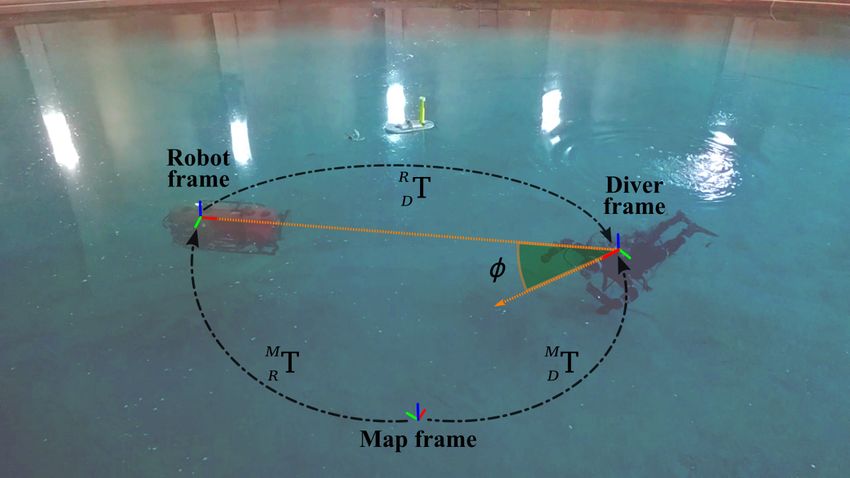
J. Mar. Sci. Eng. 2019, 7, 16                                                                       3 of 14

an underwater housing to enable bidirectional human–robot interaction capabilities (see Figure 1), i.e.,
to output feedback to the diver. As a backup vehicle for data collection only, the e-URoPe AUV [11]
from the Italian National Research Council was placed on standby.

      Figure 1. (Top) the BUDDY-AUV equipped with sensors to monitor the diver: Blueprint Subsea
      X150 USBL (Low Wood, Ulverston, UK), ARIS 3000 Multibeam Sonar (Chesapeake, VA, USA),
      BumbleBeeXB3 Stereo Camera (Richmond, BC, CAN), Underwater Tablet; (Bottom) diver issuing
      gesture commands to the AUV.

2.2. Stereo Camera and Underwater Image Rectification
      For image collection, a Point Grey Bumblebee XB3 color stereo camera (Richmond, BC, CAN) was
used, model BBX3-13S2C. This stereo camera provides raw images with 1280 × 960 pixels resolution at
16 Hz; it has 3.8 mm nominal focal length and wide baseline B = 23.9 cm. After rectification, all images
are scaled to 640 × 480, and these are the dimensions of all the stereo image pairs in the provided
datasets. The camera intrinsic parameter matrix is: K = [710 0 320; 0 710 240; 0 0 1].
      The camera was enclosed in a watertight housing with a flat glass panel (see Figure 1). When using
flat panel housings, the light is refracted twice: first on the water-glass and then on the glass-water
interface. These refraction effects cause the image to be distorted; as discussed in [12], a camera behind
a flat glass panel underwater does not possess a single viewpoint and therefore the classic pinhole
model is not valid. This problem is addressed in [13] by proposing the new Pinax (PINhole-AXial)
camera model that maps a rectified image with in-air parameters to its underwater counterpart, which
adheres to the pinhole model given a minimum distance between the camera and the housing glass.
      This method was tested on multiple types of cameras, including the Bumblebee XB3 stereo camera,
yielding higher quality results than direct underwater calibration [14], i.e., recording a calibration
pattern underwater. One of the main reasons is that this pattern detection is commonly less accurate
when performed on distorted raw underwater images, which have low contrast and radial distortions
due to magnification artifacts, than when performed on raw in-air images. Instead, Pinax uses
the physical camera model, water salinity and glass thickness to map the air-rectified image to its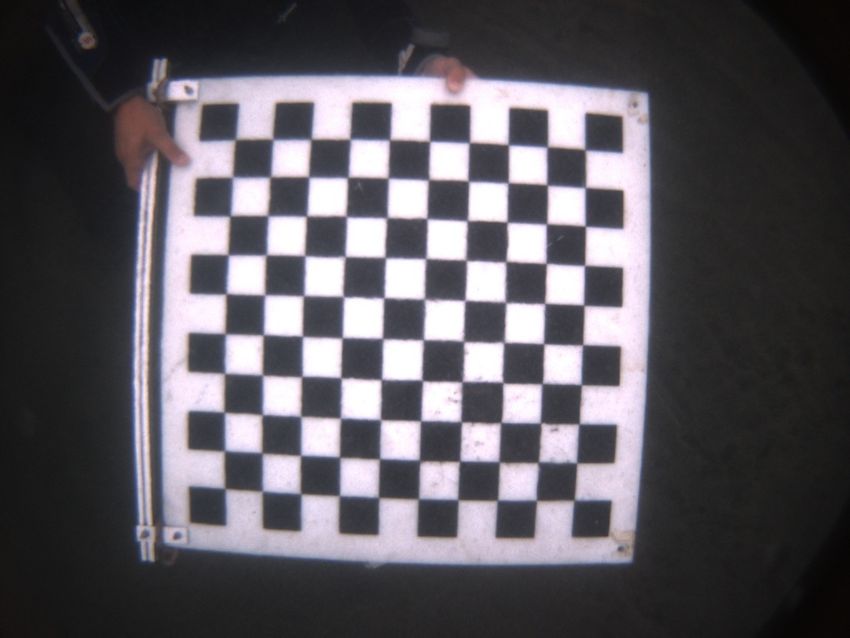
J. Mar. Sci. Eng. 2019, 7, 16                                                                                  4 of 14

underwater model. For these reasons, and the fact that many of the recordings were done during
real diver missions, underwater raw images from calibration patterns are not available for all of the
scenarios. Hence, only high-quality rectified stereo images are provided.
      Examples of this rectification process are shown in Figure 2. In-air intrinsic calibration was done
using the CamOdCal software package [15] with the camera model from [16]. The obtained calibration
files for the used BumbleBee XB3 instances are provided for the user’s inspection, along with the
CamOdCal and Pinax packages as Docker containers [17]. These can be used for underwater camera
calibration with flat-glass panels [18].

                    (a)                                 (b)                                    (c)
      Figure 2. (a) underwater raw image; (b) rectification based on in-air calibration; (c) Pinax rectification
      based on water salinity and flat-glass panel thickness.

2.3. DiverNet
     For ground truth body pose recordings, divers used the DiverNet; its hardware, software and
data acquisition modules are described in detail in [4]. In summary, DiverNet is a network of 17
Pololu MinIMU-9 Inertial Measurement Units (IMUs) with nine degrees of freedom (DoFs). They are
distributed and mounted as shown in Figure 3a,b: three on each arm and leg, one on each shoulder and
one on the head, torso, and lower back. Since it is practically impossible to have the sensors perfectly
aligned and firmly in place during tests, a calibration procedure is performed by asking the diver
to hold a T-posture and rotating each sensor’s coordinate frame to the expected pose; see Figure 3a.
This posture allows for easy access to the IMUs, a respiration monitor belt and their cabling in case
adjustments are needed; then, raw and filtered orientation are computed for each IMU as follows:
•     Raw orientation is acquired based on the magnetometer data and the gravity distribution along
      each of the accelerometer axes.
•     Filtered orientation is computed by fusing the raw orientation with the gyroscope data through a
      Madgwick–Mahony filter [19].

             (a)                          (b)                                         (c)
      Figure 3. (a) position of the DiverNet 17 IMUs—red dots; (b) Divernet suit with sewed in sensors;
      (c) computed heading φ, filtered orientation, of the diver relative to the AUV.

   For data collection, all IMU sensors operate with maximum sensitivity, i.e., accelerometer ±16 g,
magnetometer ±1.2 mT, and gyroscope ±2000 deg/s. Values are recorded at 50 Hz through a parallel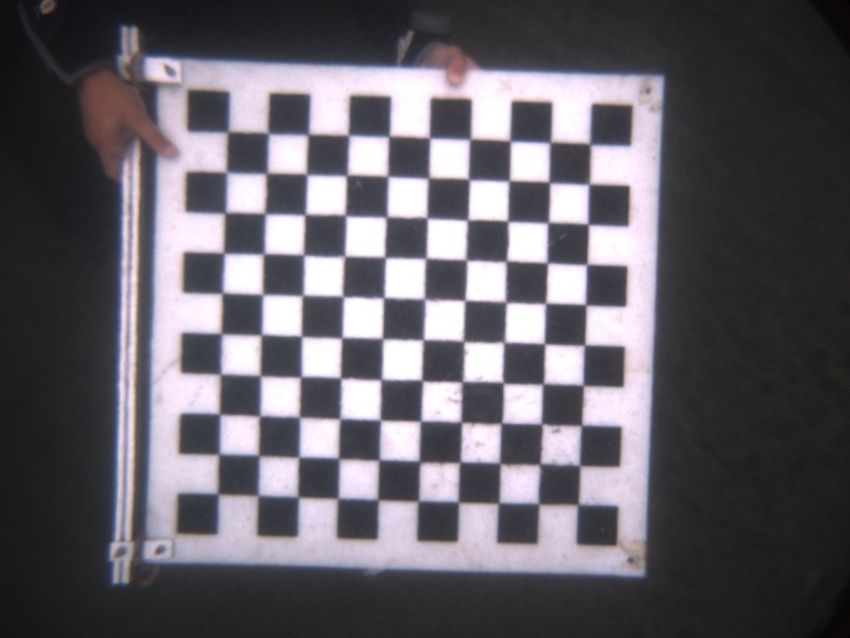
J. Mar. Sci. Eng. 2019, 7, 16                                                                              5 of 14

I2 C bus by a central acquisition unit (see Ref. [4]) and then transmitted to an on-land workstation via
an optic fiber cable.
      The filtered orientation originally consists of absolute values, globally referenced to the map
frame M. Then, its value in the BUDDY-AUV frame R is obtained through the transformation RM T.
The reported heading φ in this dataset (see Figure 3c) comes from the average input of the torso and
lower back IMU, projected onto the XY plane. As it was done in the EU-FP7 CADDY trials, the data
can be exploited to obtain the diver’s swimming direction (heading) and test tracking algorithms with
the AUV based on stereo imagery [7,20].

3. Dataset

3.1. Data Collection
     The recordings for both the underwater gesture and diver pose database took place in three
different locations in open sea, indoor and outdoor pools, respectively in Biograd na Moru—Croatia,
Brodarski Institute—Croatia, and in Genova—Italy. Then, the collected data was further divided into
eight scenarios representing the different diver missions and field experiments carried out in these
locations. Underwater gestures were recorded in all of them (≈10 K stereo pairs), whereas diver
pose/heading only in three of the scenarios (≈12.7 K stereo pairs). All of the described data and
software tools for its analysis and visualization are hosted at [21].

3.2. Data Description
     Figure 4 shows a sample image from each scenario. In order to offer and describe more details
about these image recordings and their environmental conditions, we extract image quality metrics
based on the Minkowski distance [22] for each of the scenarios. This image quality metric, denoted
as MDM, has faster computation times and provides better quality predictions than state-of-the-art
no-reference image quality assessment (NR-IQA) methods such as no-reference image quality metric
for contrast change (NIQMC) [23] or natural scene statistics (NSS) induced models [24]. Furthermore,
the MDM metrics offer a quantitative way to investigate types of contrast distortion, which are typical
in underwater scenarios due to haze and color absorption.

      Figure 4. Sample rectified images from each scenario. From left to right and top to bottom: Biograd-A,
      Biograd-B, Biograd-C, Brodarski-A, Brodarski-B, Brodarski-C, Brodarski-D, Genova-A.

     First, we compute the MDM-based image entropy H ( D ) as shown in Figure 5a, where D is
the contrast distorted image and D = 255 − D is its complement. Previous studies [25] state that
a higher entropy corresponds to images with higher contrast and more texture. Based on this only,
the recordings from Brodarski-A, Biograd-A and Biograd-C have better quality and the ones from
Brodarski-D and Genova-A the worst. Biograd-A and Biograd-C images have very similar entropy
density distributions, but Figure 5b shows that Biograd-C has lower contrast overall. This is an
example of the importance to examine all MDM measures to understand how image quality varies in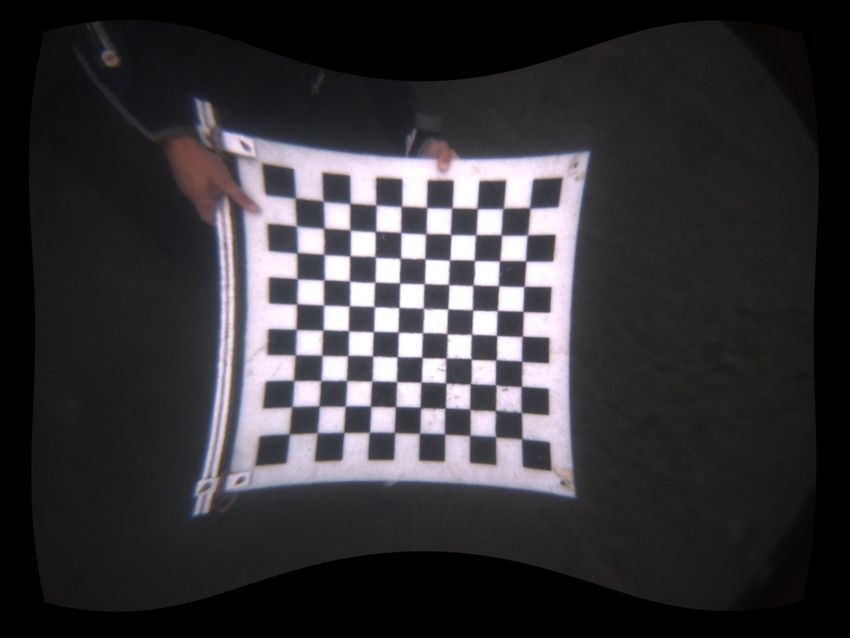
J. Mar. Sci. Eng. 2019, 7, 16                                                                                                              6 of 14

each scenario. In Figure 5b, the centroids for each recording setting are displayed and the closer they
are to the bottom left corner of the plot, the lower global contrast they have. MDM( D ) and MDM ( D )
describe the contrast behavior of colors with high and low luminance, respectively.

                                                  Biograd-A           Biograd-C                  Brodarski-B          Brodarski-D
                                                  Biograd-B           Brodarski-A                Brodarski-C          Genova-A

                                    17.5

                                    15.0

                                    12.5
                        f(H)

                                    10.0
                          Density

                                     7.5

                                     5.0

                                     2.5

                                     0.0
                                       5.50      5.75     6.00      6.25       6.50       6.75       7.00      7.25      7.50       7.75
                                                                           Entropy H(D)
                       (a) Image entropy per scenario, (top) boxplot (bottom) probability density.
                                     0.950

                                     0.925

                                     0.900

                                     0.875
                          MDM(D)

                                     0.850

                                     0.825

                                     0.800

                                     0.775

                                     0.750
                                         0.940    0.945     0.950      0.955      0.960          0.965      0.970     0.975     0.980
                                                                                MDM(D)

           (b) Minkowski based MDM metrics of the contrast distorted image D and its complement D.

        Figure 5. Dataset image quality assessment using MDM metric [22] based on Minkowski distance.

    Table 1 provides a description of all scenarios, including their dynamic and environmental
properties. Dynamics refer to the relative motion between AUV and the diver caused by currents or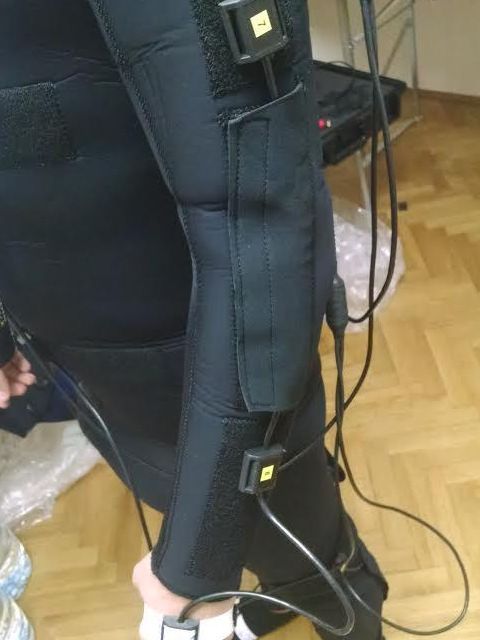
J. Mar. Sci. Eng. 2019, 7, 16 7 of 14
the diver swimming. The environmental characteristics are described using the mean and standard
deviation of the MDM metrics, also shown in Figure 5a,b. Finally, the last column of Table 1 indicates
whether underwater gestures, diver pose measurements or both were recorded. The aim is to provide
the users of our datasets with enough information to evaluate algorithms developed with images from
the different scenarios and/or to assemble their own training and testing sets.
Table 1. Description of the different dataset recording scenarios.
Location Scenario Type Dynamics Entropy H(D) MDM (D) MDM (D) Recording Action
Biograd Biograd-A Open sea No current 7.06 ± 0.12 0.960 ± 0.002 0.915 ± 0.016 Gestures
na Moru, Biograd-B Open sea No current 6.62 ± 0.14 0.958 ± 0.001 0.929 ± 0.005 Gestures, Diver pose
Croatia Biograd-C Open sea Strong currents, diver non-static 7.14 ± 0.13 0.959 ± 0.003 0.825 ± 0.031 Gestures
Brodarski-A Indoor pool No current 7.28 ± 0.03 0.967 ± 0.001 0.914 ± 0.016 Gestures, Diver pose
Brodarski
Brodarski-B Indoor pool No current 6.98 ± 0.02 0.965 ± 0.014 0.926 ± 0.001 Gestures, Diver pose
Institute,
Brodarski-C Indoor pool No current 6.75 ± 0.21 0.973 ± 0.001 0.913 ± 0.009 Gestures
Croatia
Brodarski-D Indoor pool No current 6.08 ± 0.04 0.959 ± 0.017 0.844 ± 0.006 Gestures
Genova Italy Genova-A Outdoor pool Diver non-static 6.49 ± 0.28 0.954 ± 0.005 0.904 ± 0.008 Gestures
3.3. Underwater Gestures
The underwater gesture database is a collection of annotated rectified stereo images from divers
using the CADDIAN gesture-based language [2,3]. From all the scenarios mentioned in the previous
section, 9191 annotated stereo pairs were gathered for 15 classes (gesture types), i.e., 18,382 total
samples. Likewise, we include 7190 true negative stereo pairs (14,380 samples) that contain background
scenery and divers without gesturing; these follow the same distribution per scenario as the true
positives.
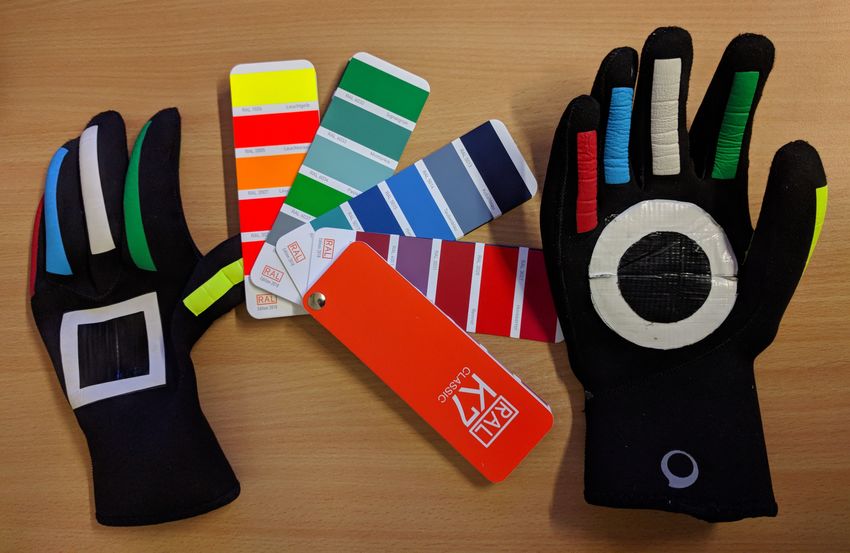
The diver’s gloves are modified by adding color stripes to each finger and known shapes as
shown in Figure 6. There is a 2.5 cm radius circle and a 5 cm square in the forehand and backhand
respectively; both with a 1 cm white border. The main goal is to augment the texture content in the
diver’s hands to allow for better feature extraction in classification and disparity computation tasks.
Pure black gloves are hard to distinguish from the rest of the diver’s body, even for the human eye.
From the viewpoint of general users of our datasets, the color stripes provide a basis to investigate
the use of color information as an additional cue for classification tasks or to develop approaches to
recover color data in underwater vision. Color attenuation underwater has been studied extensively
in the literature [26,27]. If the distance from an object to the camera can be computed, e.g., using
stereo images, it is possible to recover color information about the target. To allow for such color
constancy analysis [28–30], the average HSV (hue, saturation, value) colors of the diver’s gloves and a
RAL-K7 chart used for reference are reported in Table 2. For this, ten images were taken from different
perspectives in a set-up with uniform illumination.
Table 2. HSV colors for diver gloves and RAL-K7 chart using camera setup from Section 2.2.
RAL-K7 Value 1 RAL-K7 Value 2
Finger HSV
Code HSV Code HSV
Index 142, 98, 43 6037 131, 99, 52 6033 175, 62, 49
Middle 47, 16, 67 9003 71, 8, 98 9010 53, 14, 105
Ring 203, 82, 71 5015 213, 81, 74 5017 219, 87, 53
Little 357, 91, 64 3028 358, 96, 76 3031 355, 86, 59
Thumb 72, 83, 78 1026 62, 99, 92 1016 49, 81, 88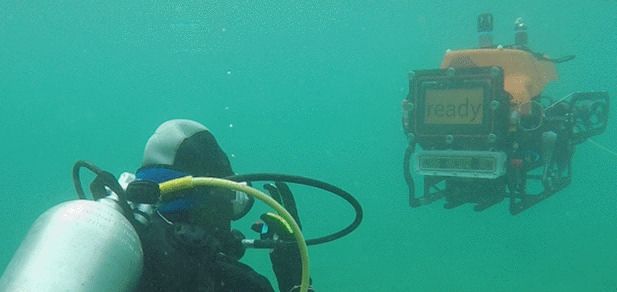
J. Mar. Sci. Eng. 2019, 7, 16                                                                        8 of 14

                                           Figure 6. Diver gloves and RAL-K7 chart.

3.3.1. Data Distribution and Processing
     As it can be seen in Figures 7–9, the number of samples and the class distribution in each scenario
vary significantly. The main reason is that the recordings were done at different development stages of
the EU FP7 CADDY project. Biograd-A and B, and Genova-A trials were organized mainly for data
collection, hence their high number of samples (Figure 7); the rest of the data was collected during real
diver missions. The data from these missions also produce a high variance in the samples per class
(Figure 8) because some gestures are used more frequently than others as it happens for some words
in our daily speech. For example, connective gestures such as start_comm, end_comm, num_delimiter are
grammatically required more times (see Ref. [3]) as the connective words and, or, but in English.

                                                                                     Biograd-A
                                                             35.9%                   Biograd-B
                                                                                     Biograd-C
                                                                                     Brodarski-A
                                                                                     Brodarski-B
                                                                                     Brodarski-C
                                   18.7%                                             Brodarski-D
                                                                                     Genova-A
                                                                              3.5%

                                                                         8.4%

                                       10.6%                           0.9%
                                                                     2.5%

                                                        19.5%

                                Figure 7. Samples distribution per scenario (True Positives).

      Based on this, Figures 7–9 are given to enable the user to decide how to build their training/testing
sets to suit their application. For instance, follow the original distribution or build a balanced data set.
The plot in Figure 7 shows the samples distribution per scenario, and Figures 8 and 9 depict the class
distribution for the complete dataset and per scenario, respectively. Due to the high variance in these
distributions, as well as the variance in environmental and dynamic conditions during the recordings,
this dataset allows to:

•     Test algorithms and/or image features robustness across different unseen settings.
•     Investigate which environmental conditions have greater impact on classification methods.
•     Balance the number of training samples used per scenario to achieve better performance, or
•     Create specific training/test sets by associating data samples across different scenarios based on a
      particular criteria, e.g., recording location, image quality, distance to camera, etc.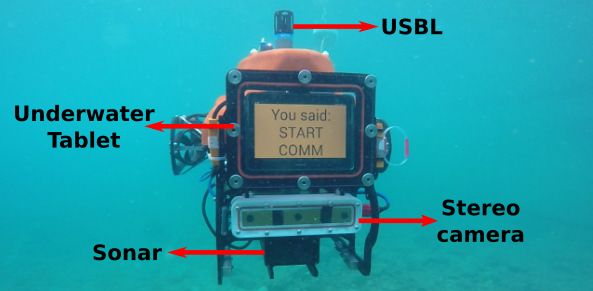
J. Mar. Sci. Eng. 2019, 7, 16                                                                                                                                    9 of 14

•     Find approaches that fuse 2D and 3D information from the stereo pairs to boost performance.
•     Test not only object classification methods but also object detectors, i.e., locate the diver’s hand,
      and color constancy algorithms.

                                                  start_comm                                                                                   3640
                                                   end_comm                                                                 2636
                                                             up                       704
                                                         down                               924
                                                         photo                                              1850
                                                   backwards                                  1122
                                   Class name

                                                         carry                                       1434
                                                           boat                       738
                                                           here               522
                                                       mosaic                452
                                                num_delimiter                                                 1984
                                                            one            322
                                                            two                        808
                                                          three                        776
                                                           four              470

                                                                  0        500        1000        1500      2000     2500     3000      3500     4000
                                                                                                         No. samples

                                                                  Figure 8. Distribution of gesture classes.

                                start_comm
                                 end_comm
                                           up
                                       down
                                       photo
                                 backwards
                 Class name

                                       carry
                                         boat
                                         here
                                     mosaic
                              num_delimiter
                                          one
                                          two
                                        three
                                         four
                                                          0           10         20          30       40       50      60          70     80          90   100
                                                                            Percentage of samples per scenario [%]
                                                         Biograd-A                      Biograd-C                   Brodarski-A                Brodarski-C
                                                         Biograd-B                      Genova-A                    Brodarski-B                Brodarski-D
                                                           Figure 9. Distribution of classes per scenario.

3.3.2. Data Parsing
     All of these data are compiled in tabular form in *.csv files as they do not require any extra software
to be handled and most data analysis packages have built-in methods to process them. One file contains
the true positives data and other the true negatives data. Table 3 shows the header/column fields
in these files; row with index 0 contains a brief description of the field data, row index 1 shows an
example of how a true positive image is referenced and row index 2 shows an example from a true
negative. An explanation of these fields is given below:

•     Scenario: Name corresponding to a location that encompasses particular settings affecting the
      quality of the image according to Table 1.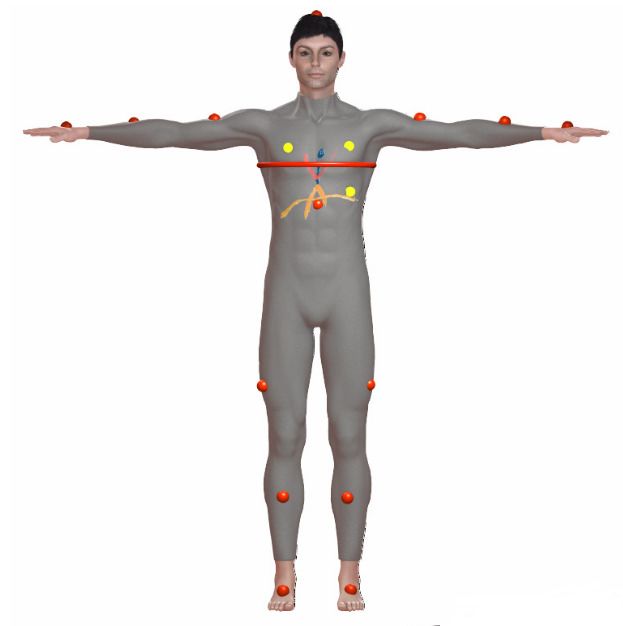
J. Mar. Sci. Eng. 2019, 7, 16                                                                                                     10 of 14

•     Stereo left/right: String to the path where the image is saved. The file basename also indicates the
      scenario from which it is taken, a sequence number and the stereo view it corresponds to, e.g.,
      biograd-A_00123_left.jpg.
•     Label name: String that identifies the gesture class.
•     Label id: Integer that identifies the gesture class.
•     Roi left/right: Arrays that describe the regions of interest in the left/right image, i.e., where the
      hand gesture is located. Each array element is separated by a comma. When two instances of the
      target object are present in the image, each array is separated by a semicolon (this is only true for
      the mosaic gesture).

      Table 3. Header from underwater gestures database *.csv file. Row 0 describes the data fields, Row 1
      and Row 2 have an example of a true positive and a true negative sample respectively.

      Scenario             Stereo Left           Stereo Right       Label         Label            Roi Left             Roi Right
                                                                    Name          Id
 0    Recording            Filepath to           Filepath to        String        Integer          Array: [top          Array: [top
      scenario name        stereo left           stereo right       class         class ID         corner X, top        corner X, top
                           image                 image              name                           corner Y,            corner Y,
                                                                                                   width, height]       width, height]
 1    biograd-A            biograd-A             biograd-A        boat            7                [231, 231, 62,       [152, 231, 62,
                           _00003_left.jpg       _00003_right.jpg                                  83]                  83]
 2    genova-A             genova-A              genova-A         true_neg        −1               NaN                  NaN
                           _00012_left.jpg       _00003_right.jpg

     To augment and complement this database, we added entries for the image quality metrics
mentioned in Section 3.2 and the parameters describing four types of image distortions: blur, contrast
reduction, channel noise and compression. These standard distortions were applied to the original stereo
pairs since they are commonly present while collecting and transmitting underwater data. The user
can utilize these synthetic images or choose to apply these or other distortions themselves. Nonetheless,
they are briefly described here because some extra header/column entries in the database are reserved
for them. Then, the user can take advantage of this format, the directory structure presented in
Figure 10 and the provided software scripts to log their own synthetic images.

                                                            Database

                                          Scenario 1        Scenario 2                Scenario N

             A
                                         True Positives                                  True                 Visualization
                                                                                       Negatives

                           Raw              Image                    Image
                                          Distortion 1             Distortion J                           ROIs         Patches

                                    dir_00       dir_01   dir_00   dir_01         dir_K

                                 Figure 10. Underwater gestures database directory tree.
J. Mar. Sci. Eng. 2019, 7, 16 11 of 14
Table 4 shows these additional columns. Image quality metrics (IQA) are only applied to the
raw rectified images, referred as non-synthetic. As for the synthetic images, the distortion column
declares the applied type of distortion and the param columns store key values that characterize it.
Blur has as only parameter the kernel size, contrast reduction has the weight α since the distortion D is
achieved by blending a gray image G with the original I, i.e., D = G × α + I × (1 − α), channel noise
requires the standard deviation of the Gaussian distribution used to add noise to each image channel,
and compression needs the compression scheme and the quality level to be used.
Table 4. Additional header/column fields for database augmentation, includes image quality metrics
and distortion parameters. Row-0 shows the column values for a non-synthetic image, and Row-1 to
Row-3 for distorted synthetic images.
Synthetic iqa_ mdm_entropy iqa _mdm_d iqa_ mdm_dcomp Distortion Param 1 Param 2
0 0 6.05 0.832 0.755 NaN NaN NaN
1 1 NaN NaN NaN blur 13 NaN
2 1 NaN NaN NaN low contrast 0.6 NaN
3 1 NaN NaN NaN compression jpeg 65
3.3.3. Database Directory and Provided Software
The provided image files follow the directory structure shown in Figure 10. As stated in Section 3.1,
the dataset is first divided by scenarios, which contain a true positives and a true negatives folder. Then,
each of these folders contains a raw directory with all the original rectified stereo pairs, plus a directory
for each image distortion applied to them. Since we can apply a particular image distortion with
different parameters, a subdirectory named dir_## is created for each different set of parameters used.
The correspondence between these subdirectories and the distortion parameters can be checked in
the database tabular file (see Tables 3 and 4). Finally, an extra folder named visualization is available
for each scenario, where images with highlighted region of interest (ROIs) or hand gesture patches
are saved.
In summary, we provide the following tools/scripts for parsing and visualizing the described
data, as well as files describing the sensor parameters (see Section 2.2). Their usage is explained in the
mentioned links [18,21].
• Parse and visualization scripts to:
– parse by label ID, label name and/or recording scenario, see Table 1.
– visualize and/or extract region of interests (ROIs).
– apply the mentioned or other image distortions with user defined parameters, and expanding
the given directory accordingly (see Figure 10).
• Camera intrinsic calibration files
• Software tools to calibrate underwater cameras with flat-glass panels (CamOdCal+Pinax).
3.4. Diver Pose Estimation
The diver pose/heading database is also a collection of annotated rectified stereo images extracted
from video sequences showing the diver free-swimming. Each stereo pair is associated with a diver
heading as explained in Section 2.3. In the CADDY project, the primary objective was to track the diver
in order to position the AUV in front him/her such that the diver always faces the camera. In this
way, the AUV can monitor the diver’s activities and communicate through gestures or the underwater
tablet as shown in Figure 1.
Thus, the dataset can be used to test human pose estimation, segmentation or scene geometry
understanding methods in this particular context, e.g., our work in [31]. For one-shot or frame-by-frame
algorithms, we offer the rectified stereo pairs, while for methods that consider the input history, i.e.,
the diver’s previous movements, we provide a sequence number explained in the next section (see
Table 5). Data were collected in the scenarios Biograd-B, Brodarski-A and Brodarski-C (see Table 1).J. Mar. Sci. Eng. 2019, 7, 16 12 of 14
Table 5. Header/column fields for diver heading database. Row 0 describes the data fields, Row 1 and
Row 2 show samples.
Scenario Sequence Stereo Left Stereo Right Heading
0 Scenario Name Integer ID c.f. Table 3 c.f. Table 3 Float (deg)
1 Brodarski-B 0 c.f. Table 3 c.f. Table 3 31.42
2 Biograd-A 3 c.f. Table 3 c.f. Table 3 −74.51
3.4.1. Data Distribution and Processing
To collect the data, divers were asked to perform three tasks in front of the AUV: (1) turn 360 deg
horizontally (chest pointing downwards, to the floor) and (2) vertically, clockwise and anticlockwise,
and (3) swim freely. For the latter, the AUV was operated manually to follow the diver. In total, 12,708
rectified stereo pair images are provided from which 3D representations can be computed as well.
The collected measurements have passed through a noise (median) filter with a buffer size 5,
and an offset correction step (sensor bias), which was done manually before each test. As mentioned,
φ is the diver’s angle in the XY plane relative to the AUV (frame R) and 0 deg is defined when the
diver is facing the camera (see Figure 3c). Hence, the range of values go from −180 deg to 180 deg.
3.4.2. Data Parsing
This dataset is also presented in tabular *.csv form as in Table 5. The explanation of its headers is
as follows:
• Scenario: Name corresponding to recording the location and specific settings as in Table 1.
• Sequence: Integer that identifies the sequence to which the stereo pair belongs. An image only
belongs to a sequence if its from the same scenario and forms part of a set continuous in time.
• Stereo left/right: c.f. Table 3.
• Heading: Float number in degrees that indicates the diver heading.
3.4.3. Database Directory and Provided Software
The provided video sequences are just split into directories for each scenario, as the first level of
the directory structure in Figure 10. We also offer software tools to:
• Extract stereo pairs sets given a scenario name, a sequence or a combination of both.
• Extract all stereo pairs associated with a range of heading values.
• Output a sequence as video file for visualization purposes.
4. Conclusions
In this article, we presented a novel dataset from divers interacting with an AUV in several field
trials in closed and open-water. The data mainly consists of stereo images with the diver performing
hand gestures to command certain tasks to the AUV, and the diver’s heading information while
swimming. The main purpose is to use the data to study underwater human–robot interaction
activities, such as diver tracking, monitoring, guidance and communication. Furthermore, the dataset
is thoroughly organized and analyzed to allow the user to utilize it in a quick and easy manner,
according to the application or research challenge they have in mind.
The rich variety of environments and situations in which the data was recorded can also be
exploited to benchmark underwater vision algorithms in general, especially with regard to their
robustness against unseen type of data or image distortions. In particular, accurately rectified stereo
images offer the opportunity to investigate 3D perception methods, which are typically performed
with acoustic sensors in underwater scenarios. Overall, there is still a scarcity of datasets for
underwater robotics applications due to the high logistic and technological costs that are required.
Commonly, the available datasets do not have enough number of samples or variety to test and deployJ. Mar. Sci. Eng. 2019, 7, 16 13 of 14
state-of-the-art perception frameworks used in on-land robotics. Hence, the work here presented aims
to set the first efforts in bridging this gap and to provide a quality research baseline to the underwater
scientific community.
Author Contributions: Conceptualization, A.G.C., D.C., E.Z. and A.B. (Anja Babić); Methodology, A.G.C., D.C.,
E.Z. and A.B. (Anja Babić); Software, A.G.C., A.R. and A.B. (Anja Babić); Validation, A.G.C. and E.Z.; Formal
Analysis, A.G.C.; Investigation, A.G.C., A.R. and D.C.; Data Curation, A.G.C. and A.R.; Writing—Original Draft
Preparation, A.G.C. and E.Z.; Writing—Review and Editing, A.G.C., D.C., E.Z. and A.R; Visualization, A.G.C. and
A.R.; Supervision, A.B. (Andreas Birk); Funding Acquisition, A.B. (Andreas Birk).
Funding: The research leading to the presented results was supported in part by the European Community’s
Seventh Framework Programme (FP7/2007-2013) under Grant No. 611373 “Cognitive Autonomous Diving
Buddy (CADDY)”.
Acknowledgments: This work was also possible thanks to the enthusiasm, collaboration and patience of all the
divers that participated in the CADDY project, especially Pavel Ankon and Maša Frleta Valić. Likewise, thanks to
Maria Elena Chavez Cereceda for her assistance and time in verifying the integrity of the data presented here.
Conflicts of Interest: The authors declare no conflict of interest. The founding sponsors had no role in the design
of the study; in the collection, analyses, or interpretation of data; in the writing of the manuscript, and in the
decision to publish the results.
References
1. Mis̆ković, N.; Pascoal, A.; Bibuli, M.; Caccia, M.; Neasham, J.A.; Birk, A.; Egi, M.; Grammer, K.; Marroni, A.;
Vasilijevic, A.; et al. CADDY project, year 3: The final validation trials. In Proceedings of the OCEANS 2017,
Aberdeen, UK, 19–22 June 2017.
2. Chiarella, D.; Bibuli, M.; Bruzzone, G.; Caccia, M.; Ranieri, A.; Zereik, E.; Marconi, L.; Cutugno, P.
Gesture-based language for diver–robot underwater interaction. In Proceedings of the OCEANS 2015,
Genoa, Italy, 18–21 May 2015.
3. Chiarella, D.; Bibuli, M.; Bruzzone, G.; Caccia, M.; Ranieri, A.; Zereik, E.; Marconi, L.; Cutugno, P. A Novel
Gesture-Based Language for Underwater Human–Robot Interaction. J. Mar. Sci. Eng. 2018, 6, 91. [CrossRef]
4. Goodfellow, G.M.; Neasham, J.A.; Rendulic, I.; Nad, D.; Miskovic, N. DiverNet—A network of inertial
sensors for real time diver visualization. In Proceedings of the 2015 IEEE Sensors Applications Symposium
(SAS), Zadar, Croatia, 13–15 April 2015.
5. Garcia, R.; Gracias, N. Detection of interest points in turbid underwater images. In Proceedings of the
OCEANS 2011 IEEE, Santander, Spain, 6–9 June 2011.
6. Rizzini, D.L.; Kallasi, F.; Oleari, F.; Caselli, S. Investigation of Vision-Based Underwater Object Detection
with Multiple Datasets. Int. J. Adv. Robot. Syst. 2015, 12, 77. [CrossRef]
7. Islam, M.J.; Fulton, M.; Sattar, J. Towards a Generic Diver-Following Algorithm: Balancing Robustness and
Efficiency in Deep Visual Detection. arXiv 2018, arXiv:1809.06849.
8. Islam, M.J.; Ho, M.; Sattar, J. Dynamic Reconfiguration of Mission Parameters in Underwater Human-Robot
Collaboration. In Proceedings of the 2018 IEEE International Conference on Robotics and Automation
(ICRA), Brisbane, QLD, Australia, 21–25 May 2018.
9. Schettini, R.; Corchs, S. Underwater Image Processing: State of the Art of Restoration and Image
Enhancement Methods. EURASIP J. Adv. Signal Process. 2010, 2010, 14. [CrossRef]
10. Stilinovic, N.; Nad, D.; Miskovic, N. AUV for diver assistance and safety—Design and implementation.
In Proceedings of the OCEANS 2015, Genoa, Italy, 18–21 May 2015.
11. Odetti, A.; Bibuli, M.; Bruzzone, G.; Caccia, M.; Spirandelli, E.; Bruzzone, G. e-URoPe: a reconfgurable
AUV/ROV for man-robot underwater cooperation. In Proceedings of the 2017 IFAC-PapersOnLine,
Toulouse, France, 9–14 July 2017.
12. Treibitz, T.; Schechner, Y.; Kunz, C.; Singh, H. Flat Refractive Geometry. IEEE Trans. Pattern Anal. Mach. Intell.
2012, 34, 51–65. [CrossRef] [PubMed]
13. Łuczyński, T.; Pfingsthorn, M.; Birk, A. The Pinax-model for accurate and efficient refraction correction of
underwater cameras in flat-pane housings. Ocean Eng. 2017, 133, 9–22. [CrossRef]
14. Łuczyński, T.; Pfingsthorn, M.; Birk, A. Image Rectification with the Pinax Camera Model in Underwater
Stereo Systems with Verged Cameras. In Proceedings of the OCEANS 2017, Anchorage, AK, USA,
18–21 September 2017.J. Mar. Sci. Eng. 2019, 7, 16 14 of 14
15. Heng, L.; Li, B.; Pollefeys, M. CamOdoCal: Automatic intrinsic and extrinsic calibration of a rig with
multiple generic cameras and odometry. In Proceedings of the 2013 IEEE/RSJ International Conference on
Intelligent Robots and Systems, Tokyo, Japan, 3–7 November 2013.
16. Kannala, J.; Brandt, S.S. A generic camera model and calibration method for conventional, wide-angle,
and fish-eye lenses. IEEE Trans. Pattern Anal. Mach. Intell. 2006, 28, 1335–1340. [CrossRef] [PubMed]
17. Merkel, D. Docker: Lightweight Linux Containers for Consistent Development and Deployment. Linux J.
2014, 2014, 2.
18. Jacobs University Bremen gGmbH. Underwater Camera Calibration (CamOdoCal+PinAx). Available online:
https://github.com/jacobs-robotics/uw-calibration-pinax (accessed on 5 January 2019).
19. Madgwick, S.O.H.; Harrison, A.J.L.; Vaidyanathan, R. Estimation of IMU and MARG orientation using a
gradient descent algorithm. In Proceedings of the 2011 IEEE International Conference on Rehabilitation
Robotics, Zurich, Switzerland, 29 June–1 July 2011.
20. Nad, D.; Mandic, F.; Miskovic, N. Diver Tracking Using Path Stabilization—The Virtual Diver Experimental
Results. IFAC-PapersOnLine 2016, 49, 214–219. [CrossRef]
21. National Research Council of Italy and Jacobs University Bremen gGmbH. CADDY Underwater
Stereo-Vision Dataset. Available online: http://caddy-underwater-datasets.ge.issia.cnr.it/ (accessed on
5 January 2019).
22. Nafchi, H.Z.; Cheriet, M. Efficient No-Reference Quality Assessment and Classification Model for Contrast
Distorted Images. IEEE Trans. Broadcast. 2018, 64, 518–523. [CrossRef]
23. Gu, K.; Lin, W.; Zhai, G.; Yang, X.; Zhang, W.; Chen, C.W. No-Reference Quality Metric of Contrast-Distorted
Images Based on Information Maximization. IEEE Trans. Cybern. 2017, 47, 4559–4565. [CrossRef] [PubMed]
24. Fang, Y.; Ma, K.; Wang, Z.; Lin, W.; Fang, Z.; Zhai, G. No-Reference Quality Assessment of Contrast-
Distorted Images Based on Natural Scene Statistics. IEEE Signal Process. Lett. 2015, 22, 838–842. [CrossRef]
25. Gu, K.; Zhai, G.; Lin, W.; Liu, M. The Analysis of Image Contrast: From Quality Assessment to Automatic
Enhancement. IEEE Trans. Cybern. 2016, 46, 284–297. [CrossRef] [PubMed]
26. McGlamery, B.L. A Computer Model For Underwater Camera Systems. Proc. SPIE 1980, 208, 221–232.
[CrossRef]
27. Bonin-Font, F.; Burguera, A.; Oliver, G. Imaging systems for advanced underwater vehicles. J. Marit. Res.
2011, 8, 65–86.
28. Ciurea, F.; Funt, B. A Large Image Database for Color Constancy Research. In Proceedings of the 11th Color
Imaging Conference, Scottsdale, AZ, USA, 13 November 2003.
29. Cheng, D.; Prasad, D.K.; Brown, M.S. Illuminant estimation for color constancy: why spatial-domain
methods work and the role of the color distribution. J. Opt. Soc. Am. A 2014, 31, 1049–1058. [CrossRef]
[PubMed]
30. Cheng, D.; Price, B.; Cohen, S.; Brown, M.S. Beyond White: Ground Truth Colors for Color Constancy
Correction. In Proceedings of the 2015 IEEE International Conference on Computer Vision (ICCV), Santiago,
Chile, 7–13 December 2015.
31. Chavez, A.G.; Mueller, C.A.; Birk, A.; Babic, A.; Miskovic, N. Stereo-vision based diver pose estimation
using LSTM recurrent neural networks for AUV navigation guidance. In Proceedings of the OCEANS 2017,
Aberdeen, UK, 19–22 June 2017.
c 2019 by the authors. Licensee MDPI, Basel, Switzerland. This article is an open access
article distributed under the terms and conditions of the Creative Commons Attribution
(CC BY) license (http://creativecommons.org/licenses/by/4.0/).You can also read