SINGAPORE 3Q 2020 - REAL ESTATE TIMES - Edmund Tie
←
→
Page content transcription
If your browser does not render page correctly, please read the page content below

REAL ESTATE
                                  TIMES

                                  OCTOBER 2020

SINGAPORE 3Q 2020
Brisk residential activity with
economic reopening and recovery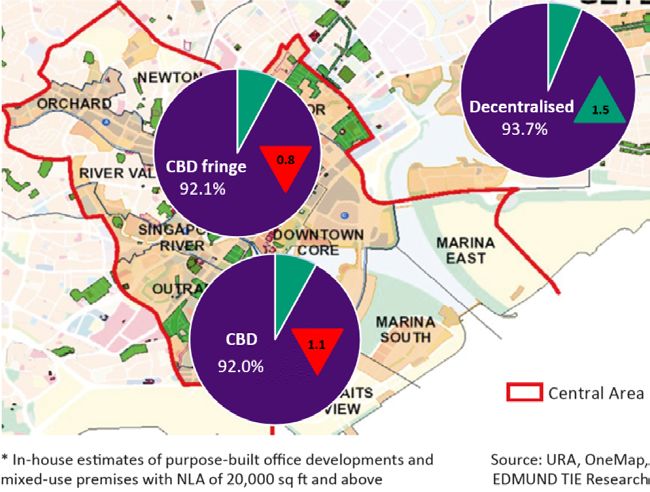
ECONOMY

Market commentary

Key economic indicators
• Based on advanced estimates released          Table 1: Singapore’s Gross Domestic Product (GDP)
  by the Ministry of Trade and Industry
  (MTI) on 14 Oct 2020, the Singapore                                                               Yoy change (%)
                                                  Selected
  economy contracted by 7.0% year-on-             indicators                    3Q           4Q           1Q           2Q           3Q
  year (yoy) in 3Q 2020 following the 13.3%                                    2019         2019         2020         2020         2020*
  yoy decline in 2Q 2020. The two quarters
                                                  Overall GDP                  0.7          1.0           -0.3        -13.3         -7.0
  marked the steepest declines in the post
  Global Financial Crisis period (Table 1).       Manufacturing                -0.7         -2.3          7.9          -0.8          2.0
  On a quarter-on-quarter (qoq) basis, the
                                                  Construction                 3.1          4.3           -1.2        -59.9         -44.7
  Singapore economy expanded by 7.9%
  in 3Q 2020, an improvement from the             Services producing
                                                                               0.8          1.5           -2.3        -13.6         -8.0
  decline of 13.2% in 2Q 2020.                    industries

                                                * Based on advanced estimates released by                                         Source: MTI
• As Singapore moved into Phase 2 of its          MTI on 14 Oct 2020
  recovery from 19 June 2020, the majority
  of industries, except for the entertainment
  sector, had restarted operations. The         • Singapore attracted $1.9bn in fixed asset investments (FAI) in 2Q
  manufacturing industry recorded a 2.0%          2020, a sharp decline from the $12.4bn reported in 1Q 2020. Both
  yoy growth in 3Q 2020, a rebound as             the manufacturing and services cluster saw great declines. The
  compared to -0.8% yoy in 2Q 2020. The           manufacturing cluster reported a sharp decline of 86.5% qoq in 2Q
  construction and services producing             2020. Within the manufacturing cluster, the chemicals, electronics
  industries also moderated to -44.7%             and transport engineering components contracted by 90.2%, 94.4%
  and -8.0% yoy in 3Q 2020 respectively as        and 77.0% on a qoq basis in 2Q 2020 respectively. The services
  compared to that in 2Q 2020.                    cluster also trended downwards by 73.5% qoq in 2Q 2020.

• Given the earlier economic contraction,
                                                Table 2: Inflation, unemployment rate and fixed asset investments
  inflationary pressures have eased
  while labour market pressures rose.                                                   3Q              4Q            1Q            2Q
                                                  Selected indicators
  Inflation declined by 0.5% in 2Q 2020,                                               2019            2019          2020          2020
  extending from the -0.1% in 1Q 2020.
                                                  Consumer Price Index
  The unemployment rate also increased to         (Core inflation)                      0.6             0.5           0.2           -0.2
  2.9% in 2Q 2020, from 2.4% in 1Q 2020           Y-o-y % change
  (Table 2).
                                                  Consumer Price Index
                                                  (All items inflation) S.A.            0.5             0.8           -0.1          -0.5
                                                  Y-o-y % change

                                                  Unemployment rate, S.A.
                                                                                        2.3             2.3           2.4           2.9
                                                  (%)

                                                  Fixed asset investments
                                                                                        0.2             6.9          12.4           1.9
                                                  (S$bn)

                                                                                                   Source: Singapore Department of Statistics

EDMUND TIE RESEARCH                                                                                                           1
INVESTMENT

Market commentary                                                Figure 1: Total investment sales (S$bn)
                                                                 $ bn                               1Q     2Q      3Q    4Q
Investment sales                                                 40
Investor confidence improved with the
                                                                 35
stabilisation of the local Covid-19 situation
and the reopening of the economy, leading to                     30

increased market activity in the investment                      25
sales market. As a result, investment sales
                                                                 20
grew by 33.8% qoq to nearly $2.5bn in 3Q
2020 after three consecutive quarters of                         15
decline (Figure 1).                                              10

There were no significant GLS sites being                         5
awarded in 3Q 2020, resulting in no public
                                                                  0
investment sales for the second consecutive                             2010   2011   2012   2013    2014       2015    2016   2017   2018       2019   2020
quarter. Apart from more transaction                                                                         Source: Various sources, EDMUND TIE Research
activity, there were also more transactions
of higher price quantums. In 3Q 2020, six                        all from the office sector, the major transactions in 3Q 2020 were from
transactions surpassed the $100mn mark                           various property sectors, with three from the industrial sector (Table
compared to only three deals in 2Q 2020.                         3). The buoyant demand for industrial and logistics assets arose from
While the significant deals in 2Q 2020 were                      rising warehousing needs during the ongoing Covid-19 pandemic.

Table 3: Investment sales summary*
                                                   2018           2019            1Q 2020                2Q 2020           3Q 2020               qoq chg
                                                   $ mn           $ mn             $ mn                   $ mn              $ mn                    %
 Total Investment Sales                           31,692         29,711            3,986                  1,853             2,480                   34
 Residential                                      20,387          7,554            1,978                   261               778                   198
 Office                                           5,000          8,386              784                   1,324              711                   -46
 Industrial                                        2,777          4,717            1,134                   174               397                   128
 Retail                                            1,757         3,548               22                     43               550                  1,179
 Hospitality                                        985           5,038               0                     0                  0                  n.m.
 Shophouse                                          786            469               15                    50                 28                   -44
 Others                                               0             0                53                     0                 16                  n.m.
 Private Sales                                    24,579         24,392            2,399                  1,853             2,480                   34
 Residential                                      13,856          3,003             615                    261               778                   198
 Office                                            4,635         8,386              784                   1,324              711                   -46
 Industrial                                        2,623          4,511             910                    174               397                   128
 Retail                                            1,757         3,548               22                    43                550                  1,179
 Hospitality                                        923           4,475               0                     0                  0                  n.m.
 Shophouse                                          786            469               15                    50                 28                   -44
 Others                                              0              0                53                     0                 16                  n.m.
 Government sales                                  7,113          5,319            1,587                    0                  0                  n.m.
 Residential                                       6,531          4,550            1,363                    0                  0                  n.m.
 Office                                             365             0                0                      0                  0                  n.m.
 Industrial                                         154            206              224                     0                  0                  n.m.
 Hospitality                                         62            562                0                     0                  0                  n.m.
 Others                                              0              0                 0                     0                  0                  n.m.

* Refers to any property transactions with value above S$10mn.                                               Source: Various sources, EDMUND TIE Research

EDMUND TIE RESEARCH                                                                                                                          2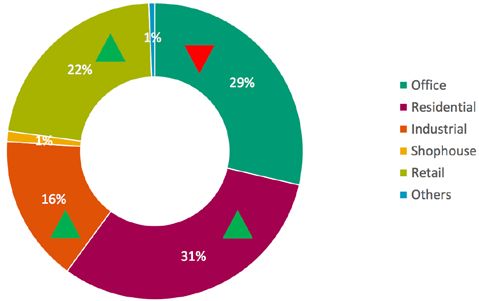
Sector trends and outlook
• After two consecutive quarters of increase, office                     with the largest being a ramp-up logistics warehouse
  investment sales declined by 46.3% qoq to $711mn                       at 7 Bulim Street for $129.6mn ($353 psf land area)
  in 3Q 2020 due to lower investment activity in the                     purchased by AIMS Apac Reit. With an existing master
  sector. Two office buildings and one strata office unit                lease, a net property income yield of nearly 7% is
  were sold in the quarter. The largest deal in 3Q 2020                  expected to be obtained, which is deemed to be
  was the sale of Robinson Point for $500mn ($3,721                      rather attractive. The sale of 26A Ayer Rajah Crescent
  psf NLA) from Tuan Sing Holdings to a British Virgin                   followed closely behind; the property was sold to
  Islands-incorporated investment holding company                        Equinix by Mapletree Industrial Trust for $125mn. A
  (Table 4). The office building was previously acquired                 seven-storey build-to-suit data centre for Equinix is
  by Tuan Sing in 2013 for $348.9mn and has undergone                    situated at the site. Another significant transaction
  asset enhancement works to the main lobby, carpark                     was the acquisition of the freehold Thye Hong Centre
  lobby and loading bays. In 3Q 2020, ABI Plaza was also                 at 2 Leng Kee Road for $112.5mn by SLB Development.
  sold to a private fund managed by CapitaLand Fund                      The industrial sector has been proven to be resilient
  Management for $200mn ($2,162 psf NLA) after it                        amid the Covid-19 pandemic, particularly with data
  was put on the market by MYP since June 2020 at a                      centres and warehouses being sought after.
  guide price of above $280mn. The ABI Plaza site will
                                                                     • Retail investment sales increased the most among the
  benefit from the grant of bonus GFA under URA’s CBD
                                                                       property sectors in 3Q 2020, recording $550mn from
  Incentive Scheme upon redevelopment into a mixed-
                                                                       $43mn in 2Q 2020. There was only one (related party)
  use project.
                                                                       transaction in 3Q 2020, which was the sale of a 50%
• On the other hand, industrial investment sales more                  stake in Northpoint City (South Wing) based on the
  than doubled to $397mn in 3Q 2020 despite lower                      property valuation of $1.1bn. Frasers Property sold
  transaction volume as the price quantums of the                      50% of its stake in the shopping mall to a division of
  transactions were significantly larger. Three of the four            TCC Group, whose controlling shareholders are that of
  investment sales in 3Q 2020 were more than $100mn,                   Frasers Property.

Table 4: Key private investment sale transactions in 3Q 2020

                                            Remaining          Purchase price
 Development                                                                               Purchaser                  Seller
                                            tenure, yrs   $ mn          $ psf
 Office
 Robinson Point                             Freehold      500.0       3,721 NLA            Unknown             Tuan Sing Holdings
 ABI Plaza                                  Freehold      200.0       2,162 NLA      CapitaLand fund entity           MYP
 Industrial
 7 Bulim Street                              22 years     129.6     353 land area       AIMS Apac Reit           Titan (Wenya)
                                                                                                                   Mapletree
 26A Ayer Rajah Crescent                     23 years     125.0       325 GFA               Equnix
                                                                                                                 Industrial Trust
 Thye Hong Centre                           Freehold      112.5    1,756 land area     SLB Development        Thye Hong Properties
 Retail
                                                                                                                 Frasers Property
 Northpoint City (South Wing) (50% stake)    94 years     550.0       3,786 NLA           TCC Group
                                                                                                               (related party deal)

                                                                                                                Source: Various sources

EDMUND TIE RESEARCH                                                                                                   3
• Residential investment sales constituted the bulk (31.4%) of total The improved transaction activity in 3Q
investment sales in 3Q 2020, a considerable increase from the 2020 offered some glimpse of hope for the
14.1% share in 2Q 2020 (Figure 2). Investment sales almost tripled investment sales market, but there are still
qoq to $778mn after three consecutive quarters of decline. This uncertainties given ongoing weakness in
was supported by the resumption of home viewings from 19 June the economy. Business sentiment among
2020. While there were only two Good Class Bungalows (GCBs) sold local firms remain pessimistic for 4Q 2020
in 2Q 2020, eight GCBs were sold in 3Q 2020. The largest GCB deal despite an improvement from 3Q 2020,
was a GCB on 101,550 sq ft of freehold land in Garlick Avenue for according to the Singapore Commercial
around $93mn ($916 psf land area). The site, which is reported to be Credit Bureau’s Business Optimism Index.
purchased by Mr Goh Cheng Liang, founder of Wuthelam Holdings, is However, some sectors such as the
large enough to be subdivided for redevelopment into 5/6 bungalows. professional and IT services, as well as the
Apart from an active GCB market, the collective sales market also manufacturing and financial services sectors
saw modest activity. After the en bloc sale of Casa Sophia in 1Q 2020, anticipated a slightly better outlook in 4Q
3Q 2020 saw the second en bloc sale in 2020 with the sale of Yuen 2020. As Singapore prepares for the next
Sing Mansion for $15.2mn, lower than the reserve price of $17mn. phase of reopening the economy, as well as
This followed its last unsuccessful tender in 2018. Separately, a more green lanes being implemented, this
four-storey residential mixed use building at 320 Balestier Road was may provide further confidence for foreign
sold in 3Q 2020 for $18.1mn to LHN Limited, which had intentions investors whose footprints in the market
to operate the property as a co-living space. LHN had previously have been on the rise in recent quarters.
developed Hmlet at Cantonment jointly with Hmlet.
Figure 2: Total investment sales by asset type
2Q 2020 3Q 2020
3%2%
9%
Office
Residential
14%
Industrial
Shophouse
Retail
72%
Source: EDMUND TIE Research
EDMUND TIE RESEARCH 4OFFICE
Office demand and occupancy rates Figure 3: Office occupancy rates* and qoq % point change (in arrows) in
3Q 2020
• Based on EDMUND TIE research,
net absorption remained in the
contractionary zone of -374,000 sq ft in
3Q 2020. The islandwide office occupancy
rate contracted by 0.3% points qoq to
92.5% in 3Q 2020 (Figure 3). The decline
was largely due to the contraction of
office space demand in the CBD, where
the occupancy rate declined by 1.1%
points to 92.0% in 3Q 2020. The majority
of employees continued to work from
home as a default in 3Q 2020.
• The technology and financial sectors
were some of the sectors that supported
demand in 3Q 2020 (Table 5). Sun Life
has set up a new office in Singapore
in One Raffles Quay North Tower. It
was also reported that technology and
e-commerce giant Amazon had leased
around 90,000 sq ft on three levels at
Asia Square Tower 1.
Table 5: Key tenant movements in 3Q 2020
Building Location Tenant Sector Remarks
Asia Square Tower 1 Interactive Brokers Group Brokerage
Marina Bay (CBD)
One Raffles Quay North Tower Sun Life Finance New office in Singapore
Ontario Teachers' Pension
One Marina Boulevard Raffles Place (CBD) Finance
Plan Board
Shenton Way/Robinson QBE Insurance (Singapore) Insurance
Guoco Tower Relocation
Road/Tanjong Pagar (CBD) Toyota Motor Asia Pacific Motor Vehicles
Source: Various sources
EDMUND TIE RESEARCH 5Rents Figure 4: Office development pipeline
Monthly rents in the various subzones of mn sq ft
the office sector showed qoq declines in 3Q 2.4 Under Construction Planned
2020 (Table 6). Within the CBD, premium
grade buildings in Shenton Way/Robinson 2.0
Road/Tanjong Pagar were generally more
resilient as compared to other subzones, 1.6
recording a 1.5% qoq contraction in 3Q 2020
as the buildings there were newer and had 1.2
more efficient floor plates. Monthly rents of
0.8
office buildings in the Decentralised areas
held steady in general as rents were already
0.4
relatively competitive.
0.0
Supply pipeline 3Q-4Q 2020 2021 2022 2023 2024
Based on EDMUND TIE Research, there is Source: EDMUND TIE Research
approximately 3.8mn sq ft of new office
space estimated to be completed from 3Q
2020 to 2024 (Figure 4). Most of the office Outlook
developments will be completed in 2022 Looking ahead, we expect a decline in overall office rents for the
(49.7% or 1.9mn sq ft). Additionally, more rest of 2020 and continued weakness in early 2021. Companies are
than half of the supply pipeline will be in CBD, considering a variety of work arrangements in view of the Covid-19
followed by 26.9% in CBD fringe. In the CBD, pandemic. Demand for office space is still broadly intact though
Afro-Asia I-Mark is estimated to complete tenants are generally asking for shorter leases. Landlords are likely to
by end of the 2020 and currently has a 62% be more flexible on lease terms and other fit-out incentives.
pre-commitment rate, with Delivery Hero
and The Great Room leasing space. Besides The growth of technology companies will continue, as businesses are
Afro-Asia I-Mark, the additions/alterations increasingly adopting greater telecommunications tools and improving
to existing HSBC building will complete in their processes. In the co-working market, we may see more mergers or
2021, with WeWork taking up the entire consolidation in co-working firms as the market becomes increasingly
office space. saturated, especially in the CBD.
Table 6: Average monthly gross office rents (S$ per sq ft)
Location Subzone Grade 2Q 2020 3Q 2020 Qoq change (%)
Marina Bay Premium 12.27 12.03 -2.0
Raffles Place A 10.47 10.26 -2.0
CBD Premium 11.14 10.97 -1.5
Shenton Way/Robinson Road/Tanjong Pagar A 8.98 8.80 -2.0
B 7.37 7.22 -2.0
Marina Centre A 9.95 9.75 -2.0
City Hall/Bugis Premium 10.77 10.72 -0.5
Orchard Road * 7.05 7.05 0.0
* 8.94 8.84 -1.2
Decentralised areas Decentralised areas
* 6.03 6.03 0.0
* Ungraded office space Source: Various sources
EDMUND TIE RESEARCH 6INDUSTRIAL
Market commentary • There was significant leasing demand coming from food factories.
All 28 strata units at SLB’s MacTaggart Foodlink were reportedly
Key indicators taken up recently. During the Circuit Breaker, F&B operators could
According to the PMI reading, the only do food delivery or takeout. As a result, some of the big
manufacturing sector recorded its second restaurant chains took up industrial space to house a central kitchen
month of expansion in August 2020 (Table 7). or consolidate their outlets. Besides food factories, there was also
This was driven by a faster rate of expansion demand coming from the logistics and warehousing sectors due to
in factory output and an improvement in the the growth in e-commerce.
new orders index in the PMI index in August
• Notable leases secured in 3Q 2020 included:
2020. However, the pace of manufacturing
expansion was slightly slower in August 2020. – Pacific Integrated Logistics, a global logistics provider, which
Besides the PMI, the NODX performance in relocated to 8 Tuas South Lane
August 2020 was driven mainly by the non- – Royal’s Engineering & Trading, a construction industry specialising
electronics sector. Both the PMI and NODX in plumbing and electrical works, which also relocated to 8 Tuas
South Lane
showed an improvement in manufacturing
performance, though it has slowed.
Figure 5: Occupancy rates of private industrial space by type
• There are continued risks arising
%
from geopolitical tensions and anti-
globalisation sentiments, such as Single-user Factory Multiple-user Factory Business Park Warehouse
increased protectionism, which could 100
result in further disruptions to global
supply chains. Such risks could adversely
impact the overall recovery of the market. 90
• Based on JTC’s statistics, overall industrial
net absorption expanded from 1.5mn sq
80
ft in 1Q 2020 to 2.2mn sq ft in 2Q 2020.
While the occupancy rates of multiple-
user factory and business park space
contracted qoq in 2Q 2020, the occupancy 70
2015 2016 2017 2018 2019 2020
rates of single-user factory space and
Source: JTC
warehouse space increased (Figure 5).
Table 7: Singapore’s NODX and PMI
Key economic indicators 2Q 2020 3Q 2020 Key trends
7.7% • NODX grew by 7.7% in August 2020, after the 5.9% increase in July 2020.
NODX 16.1%
(Aug 2020) Growth was mainly in non-electronics sectors.
• The PMI declined by 0.1 points from 50.2 in July 2020 to 50.1 in August 2020.
50.1 There were slower expansion rates in the indexes of both new exports and
PMI* 48.0 inventory.
(Aug 2020)
• The electronics sector PMI increased by 1.4 points to 50.6 in August 2020.
* Reading above 50 indicates an expansion, while below 50 indicates a contraction. Source: SIPMM
EDMUND TIE RESEARCH 7Rents Outlook
• According to EDMUND TIE research, The outlook of the industrial sector is expected to brighten gradually
while the monthly average rental rates as the global manufacturing outlook improves. However, recovery
for upper-storey multiple-user factory is expected to be different across the various industrial sectors. For
and hi-tech industrial properties declined instance, rising online and groceries sales will incentivise retailers
qoq in 3Q 2020, the monthly rents of to stockpile and expand their warehouse facilities to cater to the
warehouse/logistics as well as business increasing demand. As demand for industrial properties is also largely
park (central region) improved (Table 8). dependent on their location and efficiency of their floor plates,
industrial developments that are located close to transportation
• For example, the average monthly rents
nodes and have efficient floor plates will have greater advantage in
for warehouse/logistics improved by
attracting tenants. Landlords of older developments could make use
0.5% qoq to $1.59 psf in 3Q 2020, on
of this downtime to upgrade their facilities, so that they can meet with
the back of robust demand coming from
the demand when the market recovers.
e-commerce services and stockpiling
activities done by supermarkets.
Figure 6: Industrial development pipeline (with planning approvals and
Supply pipeline GLS sites which are pending approvals)
mn sq ft
• As at 2Q 2020, the supply pipeline from Data centres
3Q 2020 to 2023 is around 40.8mn sq ft Extensions, additions and alterations to industrial properties
Warehouse
or an average of 11.7mn sq ft per annum, Multiple-user industrial developments
which is comparable to the 3-year annual Single-user industrial developments
16 Business parks
average of 12.0mn. Around 33.8% of the
14
pipeline will be completed between 3Q to
12
4Q 2020, followed by 27.5% in 2021 (11.2m
10
sq ft). Multiple-user factories accounted
for the bulk (34.9%) of the supply pipeline 8
(Figure 6). Solaris @ Tai Seng by SB 6
(Ipark) Investment Pte. Ltd. is the largest 4
multiple-user factory development 2
at 929,000 sq ft. This development is 0
3Q-4Q 2020 2021 2022 2023
suitable for companies operating in the
Source: EDMUND TIE Research
light and clean manufacturing industries.
Table 8: Average monthly gross rents (islandwide) (S$ per sq ft)
Industrial type* Subcategory 2Q 2020 3Q 2020 Qoq change (%)
First-storey 1.84 1.84 0.0
Multiple-user factory
Upper-storey 1.35 1.32 -2.0
Warehouse/logistics Overall 1.58 1.59 0.5
High-tech industrial Overall 2.95 2.92 -1.0
Central Region 4.87 5.00 2.5
Business park
Suburban 3.68 3.68 0.0
* In-house estimates of key selected private industrial premises. Source: EDMUND TIE Research
EDMUND TIE RESEARCH 8RETAIL
Market commentary Figure 7: Retail sales growth (Three-year moving average) (excluding
motor vehicles)
Key indicators %
• As Phase 2 of Singapore’s reopening begun 20
on 19 June 2020, retail shops started
10
to operate and dine-in activities were
allowed. However, overall retail sales are 0
not back to pre-Covid-19 levels yet.
-10
• Many retailers have been introducing
various promotions to woo shoppers back
-20
to malls as it is a challenging period. For
instance, the Orchard shopping belt was -30
packed during the National Day weekend,
with long queues outside popular stores -40
like Tangs which was offering promotions. 2000 2002 2004 2006 2008 2010 2012 2014 2016 2018 2020
Source: Department of Statistics Singapore
• Besides retailers, shopping malls have
also begun adopting an online presence.
Marina Square collaborated with Lazada • In July 2020, the worst performing sectors were food and alcohol
as the platform’s first shopping mall, as well as departmental stores (Figure 8). On the other hand,
working with its tenants to create a supermarkets, computer and telecommunications and the furniture
virtual mall on the app. Frasers Property and household equipment sector reported yoy increases in retail
Retail is also launching an e-commerce sales. Overall, total retail sales (excluding motor vehicles) declined
marketplace, Frasers eStore, offering a by 7.2% yoy in July 2020.
‘store-to-door experience’ for tenants
and consumers. Figure 8: Retail sales index (Jul 2020), yoy change
• Landlords are also offering spaces to Food & Alcohol
less conventional tenants. For instance, Department Stores
Cosmetics, Toiletries & Medical Goods
co-working operator JustCo, has taken
Wearing Apparel & Footwear
up space in Cross Street Exchange and
Petrol Service Stations
Marina Square. In 4Q 2020, JustCo will Optical Goods & Books
also be opening another outlet at The Watches & Jewellery
Centrepoint. To retain its members, Others
JustCo offered rental rebates of between Total (Excluding Motor Vehicles)
15% and 30% for the month of May 2020. Recreational Goods
Mini-marts & Convenience Stores
• The three-year moving average of retail Furniture & Household Equipment
sales (excluding motor vehicles) growth Computer & Telecommunications Equipment
Supermarkets & Hypermarkets
moderated to -25.4% in July 2020 from
the -34.1% in June 2020. (Figure 7). The -80% -40% 0% 40%
various promotions introduced by malls Source: Department of Statistics Singapore
and retailers in Phase 2 of Singapore’s
reopening helped boost retail sales.
EDMUND TIE RESEARCH 9• The food and beverage index trended Figure 9: Food and Beverage index (Jul 2020), yoy change
downwards by 25.7% yoy in July 2020,
Food Caterers
and food caterers were the hardest hit,
contracting by 45.1% yoy (Figure 9).
Restaurants
Private demand and occupancy
• Based on EDMUND TIE Research, Total
islandwide net absorption contracted
further to -798,000 sq ft in 2Q 2020 from Cafes, Food Courts & Other Eating Places
-561,000 sq ft in 1Q 2020. The occupancy
rate declined by 1.9% pts qoq to 88.9% in
Fast Food Outlets
2Q 2020.
-60% -40% -20% 0%
Source: Department of Statistics Singapore
Orchard/Scotts Road (OSR) Other city areas 1 (OCA) Fringe/Suburban areas2 (FSA)
Net • Retail net absorption in Orchard/ • Net absorption in Other City Areas • Net absorption in Fringe/Suburban
absorption Scotts Road reversed to -99,000 sq stayed in negative territory for Areas contracted further to
ft in 2Q 2020, from 5,000 sq ft in 1Q the second consecutive quarter, -456,000 sq ft in 2Q 2020 from
2020. registering -243,000 sq ft in 2Q 2020. -202,000 sq ft in 1Q 2020.
Occupancy • The occupancy rate contracted by • Occupancy trended downwards by • Occupancy rates declined by 2.1%
1.2% pts qoq to 90.8% in 2Q 2020 1.9% pts q-o-q to 88.3% in 2Q 2020. pts q-o-q to 88.8% in 2Q 2020.
(Figure 10).
Openings • Luke Lobster at Shaw House • Apple at Marina Bay Sands • ChaTraMue at Paya Lebar
(3Q 2020) • Lemak Boys at Shaw Centre • Butter Bean at Funan Quarter
• Decathlon at The Centrepoint • Shake Shack at Suntec City Mall • Koung’s Wanton Mee at Jem
• Joy Luck Teahouse at ION Orchard
Closures • Esprit (all outlets) • Antoinette at Millenia Walk • Topshop and Topman at VivoCity
(3Q 2020) • The Pelican at One Fullerton • Naiise at Paya Lebar Quarter
• Tokyu Hands at Westgate
• Robinson at Jem
¹ Other City Areas refer to Downtown Core and Rest of Central Area Source: EDMUND TIE Research
² Fringe/Suburban Areas refer to Fringe Areas and Suburban Areas (Outside Central Region)
EDMUND TIE RESEARCH 10Rents Figure 10: Private retail occupancy rates (2Q 2020)
Among the various subzones in the retail
sector, monthly first-storey retail rents in
the Fringe/Suburban areas contracted the
least by 1.0% qoq in 3Q 2020. Monthly rents
of first-storey retail in the Fringe/Suburban
areas were supported by the proximity of
residential estates in these areas, as people
continued to work from home as their
default. Additionally, first-storey retail is
more well-located and visible as compared
to upper-storey retail. All other subzones
reported a decline of 2.0% qoq in 3Q 2020
(Table 9).
Source: EDMUND TIE Research
Table 9: Average monthly gross rents (S$ per sq ft)
Location Level 2Q 2020 3Q 2020 Qoq change (%)
Orchard/Scotts Road First storey 38.03 37.27 -2.0
(OSR) Upper storey 16.32 16.00 -2.0
Other city areas First storey 19.85 19.45 -2.0
(OCA) Upper storey 10.03 9.83 -2.0
Fringe/Suburban areas First storey 30.27 29.97 -1.0
(FSA) Upper storey 17.38 17.03 -2.0
Source: EDMUND TIE Research
EDMUND TIE RESEARCH 11Supply pipeline Figure 11: Retail development pipeline
mn sq ft
Based on EDMUND TIE Research, around Orchard/Scotts Road Other City Areas Fringe/Suburban Areas
708,000 sq ft of NLA (or 202,000 sq ft 0.4
per annum) is expected to be completed
islandwide from 3Q 2020 to 2023. This is
0.3
much lower than the three-year annual
average supply of 1.0mn sq ft. Most of
the supply pipeline (43.0%) is expected to 0.2
complete by end-2021 (Figure 11). One of
the developments that will be completed in
0.1
2021 is i12 Katong mall.
Outlook 0.0
3Q-4Q 2020 2021 2022 2023
Moving forward, we expect the retail Source: EDMUND TIE Research
market to remain subdued and demand for
retail space will continue to slow. The retail
market may still be weak in Orchard/Scotts
Road due to the dearth of tourist arrivals.
Similarly, in the Other City Areas, the retail
market is impacted adversely as employees
are still working from home as a default. As
employees gradually return to their offices,
we expect retail sales in the CBD area to pick
up. However, retail in the Orchard/Scotts
Road subzone will remain weighed down due
to the restrictions on foreign visitors into the
country.
The Covid-19 pandemic will accelerate
transformation in the retail scene. With
the presence of more firms offering an
omnichannel approach, retailers will need
to ensure complementary online and offline
offerings. In addition, we also see greater
use of retail spaces being converted to office
use due to the slowing demand.
EDMUND TIE RESEARCH 12RESIDENTIAL
Market commentary
Key indicators
• Based on 3Q 2020 Urban Redevelopment Table 10: URA Private Residential Price Index
Authority (URA) flash estimates, private
Type/Market segment 2Q 2020 3Q 2020* qoq % chg
home prices continued to increase by
All Residential property 152.6 153.8 0.8
0.8% qoq, after 0.3% in 2Q 2020 (Table
10). This was driven by the landed Non-Landed property 148.7 148.7 0
segment, which surged by 3.8% qoq after CCR 134.6 128 -4.9
staying constant in 2Q 2020.
RCR 150 155 3.3
• Private non-landed property prices held OCR 177.4 180.4 1.7
firm qoq in 3Q 2020 after a qoq growth Landed property 170.3 176.8 3.8
of 0.4% in 2Q 2020, with prices in the RCR
* 3Q 2020 private residential price index are based on URA flash estimates. Source: URA
and OCR expanding by 3.3% and 1.7% qoq
respectively. On the other hand, prices in
the CCR declined by 4.9% qoq, a reversal Figure 12: New housing loans limits granted
from the 2.7% growth in 2Q 2020. $ mn
14,000
• Housing loans value rose for the fourth
consecutive quarter by 9.7% yoy in 2Q 12,000
2020 (Figure 12). However, on a qoq
10,000
basis, housing loans fell by 5.0% amid the
economic gloom, job uncertainties and 8,000
prohibition of home viewings.
6,000
• On 28 September 2020, URA prohibited
developers from re-issuing options to 4,000
purchase (OTP) to the same buyer of 2,000
the same unit within 12 months after
the expiry of the earlier OTP. Upfront 0
1Q 2015 1Q 2016 1Q 2017 1Q 2018 1Q 2019 1Q 2020
agreements to buyers to re-issue OTPs
Source: Monetary Authority of Singapore
were also prohibited. The move aimed to
improve the reliability of developer sales
figures and encourage financial prudence
in home purchases amid the current
economic uncertainties.
EDMUND TIE RESEARCH 13• However, in the event that the purchasers may require This could be driven by buyers seeking stable assets in
additional time to finalise the necessary arrangements a low-interest rate environment amid volatile equity
before exercising the OTP, either the purchaser or markets and economic uncertainties, as well as having
developer can apply for the extension of the validity more choices from the increased launches.
period of the OTP up to 12 weeks from the OTP date,
• In 3Q 2020, there were six new launches (Table 11).
provided that both parties are agreeable.
Two of the projects recorded take-up rates of above
• New home sales volumes comprised the bulk of the 60%, aided by their competitive pricing. The 50-unit
private residential market in 3Q 2020 following the freehold project NoMa at District 14 saw 36 units sold,
reopening of showflats and increase in new launches, with a take-up rate of 72%. Its one-bedroom units
amounting to a total of 3,670 units. New sales were fully sold during the early bird preview sales
continued to increase for the fifth consecutive month in and 66% of the total units were sold. Prices at NoMa
September 2020, reaching 1,329 units, which was 5.6% ranged from $1,480 to $1,808 psf.
and 4.6% higher on a m-o-m and yoy basis respectively.
Table 11: Private residential launches (excluding ECs) in 3Q 2020
No. of No. of
Total units Prices
Development Property type Developer Tenure units units
in project $ psf
launched sold
CCR
Mooi Residences Non-landed Wenul HL Freehold 24 24 3 2,535 - 2,669
RCR
Forett at Bukit Timah Non-landed Qingjian Realty Freehold 633 300 236 1,647 - 2,120
Penrose Non-landed Hong Leong Holdings and CDL 99 yrs 566 566 341 1,396 - 1,856
Verdale Non-landed COLI Singapore and CSC Land 99 yrs 258 78 34 1,607 - 1,855
Myra Non-landed Selangor Dredging Berhad Freehold 85 85 15 2,016 - 2,273
NoMa Non-landed Macly Group Freehold 50 50 36 1,480 - 1,808
OCR
Landed housing
Landed Global Dragon Freehold 9 9 1 2,261
development
Source: URA
EDMUND TIE RESEARCH 14• Another new launch that saw a strong Figure 13: Private homes sales volume (excluding ECs) and URA All
reception was Penrose (District 14). Residential Price Index
No. of units Secondary Sales (LHS) 1Q09=100
About 341 units of the total 566 units
New Sales (LHS)
(60.3%) were reportedly sold on its
12,000 Property Price Index of All Residential Properties (RHS) 160
launch weekend, a remarkable reception
153.8 155
given the current climate. As at end 3Q 10,000
2020, 389 units have been sold. One-and 150
8,000
two-bedroom units priced below $1mn 145
attracted many homebuyers. 6,000
140
• Resale volume more than tripled from 4,000
135
951 units in 2Q 2020 to 3,149 units in 2,000 130
3Q 2020. This was attributed to home
0 125
viewings being allowed once again.
1Q 2011
1Q 2012
1Q 2013
1Q 2014
1Q 2015
1Q 2016
1Q 2017
1Q 2018
1Q 2019
1Q 2020
Covid-related construction delays also
may have led homebuyers to consider the
Note: 3Q 2020 property price index is based on URA flash estimates. Source: URA
resale market.
• Despite the Hungry Ghost Festival, total
Figure 14: Private home rental transactions (excluding ECs)
private homes sales volume in 3Q 2020
'000 units 1Q 2Q 3Q 4Q
amounted to 6,819 units, a significant 100
growth from the 2,664 units in 2Q 2020,
and 18.3% higher than the 5,763 units a
80
year ago (Figure 13).
• Despite the border closures, demand 60
from foreigners have improved. In 3Q
2020, foreigners purchased 225 private
40
residential properties, which was 89%
more than that in 2Q 2020 and even
20
exceeded the 216 units in 1Q 2020.
• In the private residential leasing market, 0
total rental volumes rebounded to 26,462 2011 2012 2013 2014 2015 2016 2017 2018 2019 2020
transactions in 3Q 2020 after a qoq decline Source: URA
in 2Q 2020 (Figure 14). Nevertheless, the
rental volumes were still 2.1% lower than
3Q 2019, amid pressures on the expatriate
employment market. With softening
leasing demand, rents are anticipated to
decline in 3Q 2020.
EDMUND TIE RESEARCH 15• As at 2Q 2020, there were 53,055 units Figure 15: Number of private homes in the pipeline (excluding ECs)
in the pipeline. The bulk of the pipeline '000 units
supply is slated to complete in 2022 and Completed Under construction WP/PP Others
2023 (Figure 15). Around 1,459 units will 18
be expected to complete in 2H 2020. 16
About 39% of the pipeline supply (21,113 14
units) have been sold while the remaining 12
61% (31,942 units) are unsold. Based on 10
the three-year annual average take-up of
8
new sale units of nearly 9,800 units, the
6
unsold units will take around 3.3 years to
4
be absorbed.
2
0
2020 2021 2022 2023 2024 >2024
Source: URA
Outlook
• With the recent prohibition on the • Notwithstanding current economic weaknesses, the low-interest
re-issuance of OTPs, there could be a rate environment and high liquidity is supporting end-user demand.
slight decline in new sales in 4Q 2020 Foreign demand is likely to pick up further as Singapore’s economy
as homebuyers exercise more caution. gets set to enter the next phase of reopening reopens and more
However, new sales are still expected green lanes are implemented. This may provide more confidence for
to be supported by genuine demand foreign investors to acquire properties in Singapore.
by homebuyers and a steady pace of
upcoming launches.
EDMUND TIE RESEARCH 16CONTACTS Ong Choon Fah
Chief Executive Officer
+65 6393 2318
choonfah.ong@etcsea.com
PROFESSIONAL SERVICES
Valuation Advisory Property Tax Advisory & Hospitality Property Management
Poh Kwee Eng Statutory Valuation Nicholas Cheng Kwok Sai Kuai
Executive Director Ng Poh Chue Executive Director Executive Director
Regional Head of Executive Director +65 6393 2317 Regional Head of
Valuation Advisory +65 6393 2515 nicholas.cheng@etcsea.com Property Management
+65 6393 2312 pohchue.ng@etcsea.com +65 6417 9229
kweeeng.poh@etcsea.com Tay Hock Soon saikuai.kwok@etcsea.com
Senior Director
Nicholas Cheng Research & Consulting +65 6887 0088 Paul Wong
Executive Director tayhs@treetops.com.sg Senior Director
Ong Choon Fah
+65 6393 2317 +65 6417 9225
Chief Executive Officer
nicholas.cheng@etcsea.com paul.wong@etcsea.com
+65 6393 2318
choonfah.ong@etcsea.com
Lam Chern Woon
Senior Director
+65 6393 2340
chernwoon.lam@etcsea.com
AGENCY SERVICES REGIONAL OFFICES
Investment Advisory Business Space & Retail Malaysia
Ong Choon Fah Swee Shou Fern Chua Wei Lin Eddy Wong
Chief Executive Officer Executive Director Executive Director Managing Director
+65 6393 2318 +65 6393 2523 Regional Head of +603 2024 6380
choonfah.ong@etcsea.com shoufern.swee@etcsea.com Business Space eddy.wong@ntl.my
+65 6393 2326
Poh Kwee Eng Tan Chun Ming weilin.chua@etcsea.com
Executive Director Executive Director
+65 6393 2312 Regional Investment Advisory
kweeeng.poh@etcsea.com +65 6393 2360 China Desk Thailand
chunming.tan@etcsea.com
Ong Choon Fah Ong Choon Fah
Chief Executive Officer Chief Executive Officer
Auction & Sales Residential +65 6393 2318 +65 6393 2318
choonfah.ong@etcsea.com choonfah.ong@etcsea.com
Nicholas Cheng Margaret Thean
Executive Director Executive Director Tan Chun Ming Punnee Sritanyalucksana
+65 6393 2317 Regional Head of Residential Executive Director Chief Operating Officer
nicholas.cheng@etcsea.com +65 6393 2383 +65 6393 2360 +66 2257 0499 ext 101
margaret.thean@etcsea.com chunming.tan@etcsea.com punnee.s@etcthailand.co.th
Joy Tan
Senior Director Karen Ong
+65 6393 2505 Senior Director
joy.tan@etcsea.com +65 6393 2366
karen.ong@etcsea.com
Editor: Authors:
Saleha Yusoff Lam Chern Woon Leong Kin Mun
Executive Director Senior Director Assistant Manager
Regional Head of Research & Consulting Research
Research & Consulting +65 6393 2340 +65 6393 2548
+603 2161 7228 ext 302 chernwoon.lam@etcsea.com kinmun.leong@etcsea.com
saleha.yusoff@etcsea.com
For more information, please contact us at research.sg@etcsea.com.
Disclaimer: The information contained in this document and all accompanying presentations (the “Materials”) are approximates only, is subject to change
without prior notice, and is provided solely for general information purposes only. While all reasonable skill and care has been taken in the production of the
Materials, EDMUND TIE (the “Company”) make no representations or warranties, express or implied, regarding the completeness, accuracy, correctness,
reliability, suitability, or availability of the Materials, and the Company is under no obligation to subsequently correct it. You should not rely on the Materials
as a basis for making any legal, business, or any other decisions. Where you rely on the Materials, you do so at your own risk and shall hold the Company,
its employees, subsidiaries, related corporations, associates, and affiliates harmless to you to and any third parties to the fullest extent permitted by law for any losses,
damages, or harm arising directly or indirectly from your reliance on the Materials, including any liability arising out of or in connection with any fault or negligence. Any
disclosure, use, copying, dissemination, or circulation of the Materials is strictly prohibited, unless you have obtained prior consent from the Company, and have credited
the Company for the Materials. © EDMUND TIE 2020
We are now on
Edmund Tie & Company (SEA) Pte Ltd Scan the QR code
5 Shenton Way, #13-05 UIC Building, Singapore 068808. with WeChat app
to visit our WeChat
T. +65 6293 3228 | F. +65 6298 9328 | mail.sg@etcsea.com | Please visit www.etcsea.com and follow us on account.You can also read