SINGAPORE Q4 2019 - REAL ESTATE TIMES - Soft 2019 economic growth and hopes of market recovery for commercial and residential markets in 2020 ...
←
→
Page content transcription
If your browser does not render page correctly, please read the page content below

REAL ESTATE
                                         TIMES

                                         JANUARY 2020

SINGAPORE Q4 2019
Soft 2019 economic growth and hopes of market recovery
for commercial and residential markets in 2020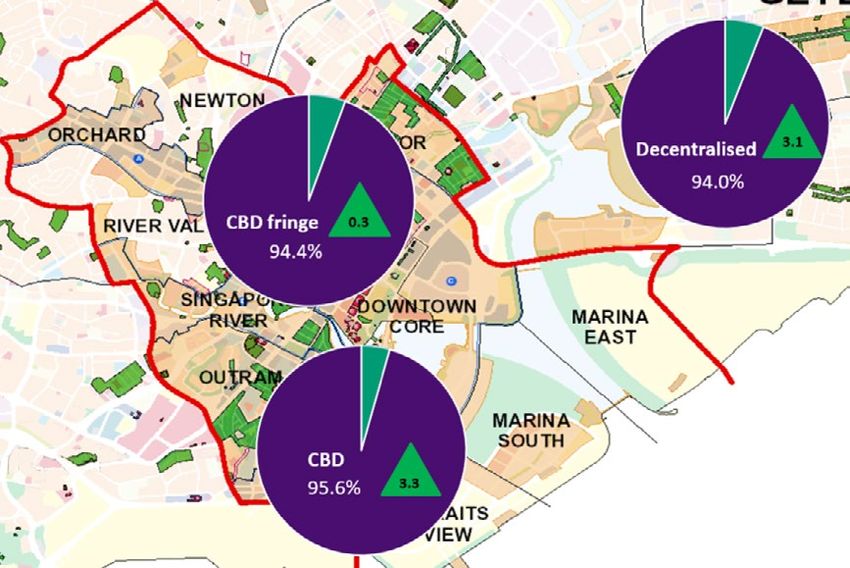
ECONOMY

Market commentary                                  In EDB’s 2019 year-in-review announcement in 16 January 2020,
                                                   Singapore far exceeded its forecast for investment commitments in
Key economic indicators                            2019 by attracting $15.2bn, 39 per cent more than In 2018. The strong
Based on advanced estimates released               figures reflect companies’ confidence in Singapore’s fundamentals and
by the Ministry of Trade and Industry on           its strategic position at the heart of a growing Asia, with strong value
2 January 2020, the Singapore economy              proposition of trust and stability along with sophisticated capabilities
grew by 0.7 per cent year-on-year (y-o-y)          of its economy.
in 2019, moderating from the 3.1 per
cent y-o-y growth in 2018 (Table 1). The           Table 1: GDP
construction sector had the strongest
performance, growing by 2.5 per cent y-o-y                                                        Y-o-y change (per cent)
                                                    Selected indicators
in 2019. However, the manufacturing sector                                                     Q3 2019                  Q4 2019
contracted by 1.5 per cent y-o-y in 2019.           Overall GDP                                  0.5                        0.8

Global growth is projected to see a modest          Manufacturing                               -1.7                        -2.1
pickup in 2020, supported by emerging               Construction                                 2.9                        2.1
markets and developing economies, while             Services producing industries                0.9                        1.4
growth of key final demand markets for
Singapore such as the US and China is              * Based on advanced estimates released by           Source: MTI, EDMUND TIE Research
                                                     MTI on 2 January 2020
expected to ease amid trade tensions.
Market watchers are cautiously positive on
the possible easing of trade frictions and         Table 2: Unemployment rate and fixed asset investments
improvements in global trade in the coming                                                               Y-o-y change
quarters. The Ministry of Trade and Industry        Selected indicators
                                                                                               Q2 2019                  Q3 2019
has forecast Singapore’s GDP growth to range
                                                    Unemployment rate                           2.2%                        2.3%
from 0.5 per cent to 2.5 per cent in 2020.
                                                    Fixed asset investments                     4.3bn                    0.2bn
Notwithstanding the continuing global
trade tensions and economic headwinds,                                                                 Source: MTI, EDMUND TIE Research

Singapore continued to attract investment
commitment. The fixed asset investment
totalled 8.3bn from Q1 2019 to Q3 2019,
with a greater proportion recorded in H1
2019. The Singapore Economic Development
Board (EDB), with its focus on key priorities
including ASEAN, advanced manufacturing,
digital, innovation and growing new industry
clusters, had planned to attract $8bn to
S$10bn in fixed asset investments in 2019, in
line with previous years.

All monetary values are in Singapore dollars ($)

EDMUND TIE RESEARCH                                                                                                     1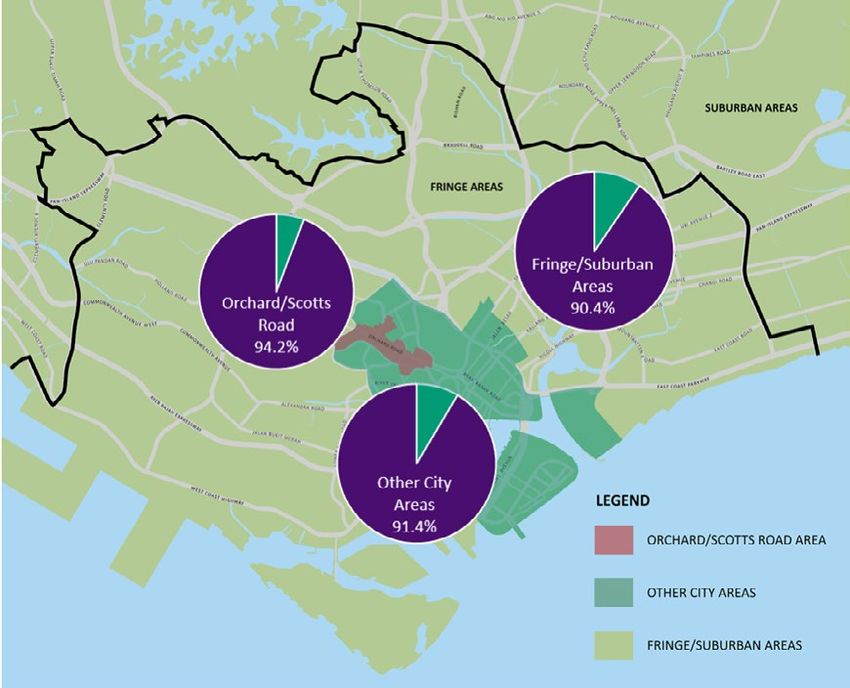
INVESTMENT

Investment sales                                                        Figure 1: Total investment sales, $bn

Against the backdrop of global geopolitical
tensions, economic slowdown and business
confidence falling to a near two-year low in Q4
2019 (according to the Singapore Commercial
Credit Bureau’s Business Optimism Index
report released on 16 September 2019),
total investment sales value fell 22.2 per cent
y-o-y to reach $23.2bn in 2019 (Figure 1).
The private sector accounted for the bulk (or
78.1 per cent) of total investment sales value
for 2019, with heightened sales activities
for commercial assets by local and foreign
institutional investors including REITs.

Sale of sites sold under the Government Land                                                                             Source: Various sources, EDMUND TIE Research

Sales (GLS) Programme (Table 3) in 2019
was 28.4 per cent lower than in 2018. The
decline was attributed to a fall in residential
sale sites as property cooling measures and
greater investor caution continued to bite
homebuyer sentiments.

Table 3: Investment sales summary*

 Key investment sale type                                          2018 ($m)                               2019 ($m)                   y-o-y change (per cent)
 Private                                                        22,745 (76.2%)                         18,139 (78.1%)                            -20.3
 Residential/Residential mixed-use                              11,313 (37.9%)                            278 (1.2%)                             -97.5
 Office/Office mixed-use                                         4,713 (15.8%)                          7,798 (33.6%)                            65.4
 Industrial/Industrial mixed-use                                  2,835 (9.5%)                          3,849 (16.6%)                            35.8
 Retail/retail mixed-use                                          1,818 (6.1%)                          3,085 (13.3%)                            69.7
 Hospitality/Hospitality mixed-use                                 923 (3.1%)                           2,547 (11.0%)                           176.0
 Shophouses                                                       1,143 (3.8%)                            581 (2.5%)                             -49.1
 Public (GLS)                                                    7,113 (23.8%)                          5,090 (21.9%)                            -28.4
 Residential/Residential mixed-use                               6,531 (21.9%)                          4,316 (18.6%)                            -33.9
 Office/Office mixed-use                                           365 (1.2%)                                  Nil                         Not meaningful
 Industrial/Industrial mixed-use                                   154 (0.5%)                             211 (0.9%)                             36.8
 Hospitality/Hospitality mixed-use                                 62 (0.2%)                              562 (2.4%)                            800.5
 Total                                                          29,858 (100%)                           23,229 (100%)                           -22.2

* Refers to the sale of land, building and multiple units with value above $5 million. It excludes single strata or      Source: Various sources, EDMUND TIE Research
  landed residential units, except for landed sites large enough to be redeveloped into two or more residential units.

EDMUND TIE RESEARCH                                                                                                                                  2
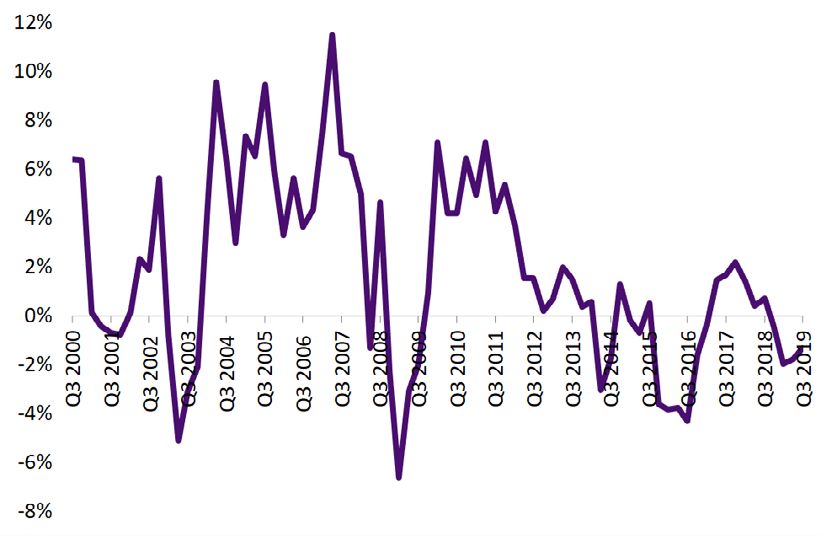
Figure 2: Total investment sales by asset type Figure 3: Estimated Residential GLS supply
2018 Retail Mixed Use Hospitality Mixed
Shophouse No. of Dwelling Units
Industrial Mixed 1.7% Use
3.8% 14,000
Use 0.0%
Retail
0.0% Hospitality 12,000
4.4%
3.3%
10,000
Industrial 8,000
10.0%
6,000
Office Mixed Use
1.2% 4,000
Residential 2,000
52.2%
Office 0
H1 2014
H2 2014
H1 2015
H2 2015
H1 2016
H2 2016
H1 2017
H2 2017
H1 2018
H2 2018
H1 2019
H2 2019
H1 2020
15.8%
Residential Mixed
Use Confirmed List Reserve List
7.5%
Source: URA, EDMUND TIE Research
Figure 4: Estimated Commercial (excluding Hotels) GLS supply
2019 Sq ft ('000)
Hospitality
4,000
Hospitality Mixed Use Residential
11.3% 2.1% 3,500
16.6%
Shophouse 3,000
2.5%
2,500
Retail Mixed Use Residential Mixed Use
2.2% 2,000
3.2%
Retail 1,500
11.0% 1,000
500
Industrial Mixed 0
Use Office
H1 2014
H2 2014
H1 2015
H2 2015
H1 2016
H2 2016
H1 2017
H2 2017
H1 2018
H2 2018
H1 2019
H2 2019
H1 2020
6.8% 26.3%
Industrial Office Mixed Use Confirmed List Reserve List
10.7% 7.3%
Source: URA, EDMUND TIE Research
Source: Various sources, EDMUND TIE Research Figure 5: Estimated Industrial GLS supply
Sq ft ('000)
2,500
2,000
1,500
1,000
500
0
H1 2014
H2 2014
H1 2015
H2 2015
H1 2016
H2 2016
H1 2017
H2 2017
H1 2018
H2 2018
H1 2019
H2 2019
H1 2020
Confirmed List Reserve List
Source: JTC, EDMUND TIE Research
EDMUND TIE RESEARCH 3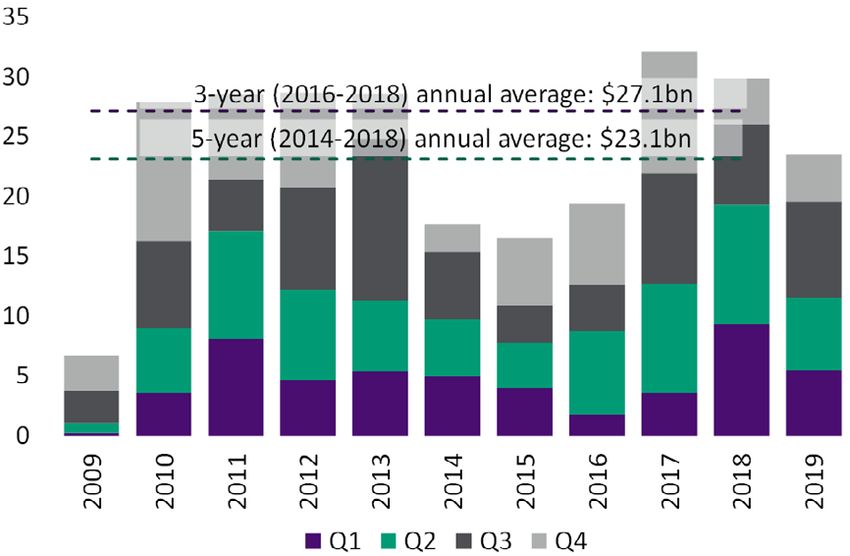
Table 4: Key private investment sale transactions in Q4 2019 (above $100m)

                                     Tenure/
 Development name/location                                Purchase price          Purchaser/investor type
                                     (remaining tenure)
 Office/Office mixed-use
                                     99 years             $547.5m                 Fund managed by Angelo Gordon and TCRE Partners
 Bugis Junction Towers
                                     (70 years)           ($2,200 psf NLA)        (Private property vehicle)
 Industrial/Industrial mixed-use
                                     99 years             $1.576bn                Mapletree Commercial Trust (local listed REIT) –
 Mapletree Business City (Phase 2)
                                     (76 years)           ($1,330 psf NLA)        related party transaction
 Retail/retail mixed-use
                                     60 years             $296m                   Rock Productions (New Creation Church)
 The Star Vista Mall
                                     (48 years)           ($1,817 psf NLA)        (Private company)
 Hospitality/hospitality mixed-use
                                     99 years             $475m                   Hoi Hup Realty Pte Ltd
 Andaz Singapore
                                     (91 years)           ($1.4m per key)         (Private property company)
                                     97 years             $163.3m                 City Developments Limited
 Liang Court
                                     (57 years)           ($975 psf GFA)          (Quoted property company)

                                                                                               Source: Various sources, EDMUND TIE Research

No GLS sites were recorded in Q4 2019.

Sector trends and outlook
• Office sector continued to stand out, increasing 53.5                     15.9m visitors in the first 10 months of the year – a
  per cent y-o-y in total private sector deals and GLS                      2.3 per cent y-o-y increase above the same period
  sites. The stronger interest is supported by investors’                   in 2018. 2018 recorded a new-high in terms of total
  confidence in office space demand and positive                            visitor arrivals of 18.5m.
  outlooks for the sector as viable source of stable
                                                                      • Residential collective sales remained lacklustre, falling
  income-recurring assets.
                                                                        from 52.2 per cent of total investment sales value in
   The largest transaction in 2019 was Chevron House,                   2018 to just 16.6 per cent in 2019.
   which transacted at $1,025m (or $2,739 psf) to US
                                                                      The overall investment sales value estimate of $23.2bn
   investment firm, AEW from Oxley Holdings. The
                                                                      for 2019 falls within our previous forecast range of
   transaction price represents more than a 35 per cent
                                                                      $22bn to $24bn. Despite the increase in investment sales
   increase in capital value over the $660m that Oxley
                                                                      for all commercial assets (barring shophouses), overall
   Holdings had initially paid to acquire the development
                                                                      investment sales value posted an annual decline in 2019,
   in March 2018. Chevron House is currently undergoing
                                                                      amid the dearth of residential collective sales. Concerns
   addition and alteration (A&A) works to increase the
                                                                      on the unsold supply glut also weighed on investors’
   NLA in the building.
                                                                      appetite for new residential sites. Along with existing
• Hospitality assets emerged as the next investors’                   property cooling measures, residential investment sales
  target, with investment sales value increasing 216 per              activity is likely to be soft in the near term until we
  cent y-o-y in 2019, underpinned by yet another record               observe a continuous recovery in new sales momentum
  year in international visitor arrivals in Singapore, with           in the next three to four quarters.

EDMUND TIE RESEARCH                                                                                                         4
OFFICE
Office demand and occupancy rates Figure 6: Office occupancy rates* and y-o-y percentage point change (in
green arrows) in Q4 2019
• Based on our estimates, occupancy rates
of office developments* island-wide
trended upwards by 2.5 percentage
points y-o-y to 94.9 per cent in Q4 2019.
This was greater than the 0.9 percentage
points growth in Q4 2018. In Q4 2019,
occupancy in the Central Business
District (CBD) increased the most by 3.3
percentage points y-o-y to 95.6 per cent
(Figure 6).
• In 2019, co-working and technology
firms remained the major occupiers
of CBD office space despite challenges
faced by selected co-working operators, Central Area
notably WeWork and Wotso. Within the
co-working market segment, there has * In-house estimates of purpose-built office developments and Source: URA, OneMap,
mixed-use premises with NLA of 20,000 sq ft and above EDMUND TIE Research
been consolidation such as the merger
of Collision 8 and Found into Found8. We
observed some co-working operators
expanding into the CBD fringe locations, in
light of the near saturation of co-working
spaces in the CBD. A notable example is
JustCo, which opened its 50,000 sq ft of
space in Manulife Centre and is expected
to house about 1,000 members (Table 5).
Table 5: Key tenant movements in Q4 2019
Building Location Tenant Sector Remarks (space occupied)
Marina Bay Financial
Littler Law New location in REGUS
Centre Tower 3 Marina Bay (CBD)
Asia Square Tower 2 First Abu Dhabi bank Finance Relocation (22,000 sq ft)
9 Battery Road Upgrade Pack Travel technology New location
Raffles Place (CBD)
OUE Bayfront Aramco Oil and Gas Relocation (30,000 sq ft)
AXA Tower Shenton Way/ Cofco Agri Agri-business Relocation (14,000 sq ft)
Robinson Road/
79 Anson Road Tanjong Pagar (CBD) Wan Hai Lines Shipping Relocation (11,000 sq ft)
Millenia Tower CSOP Asset Management Investment New location
Bugis Junction Towers ADMIS Singapore Finance Relocation (10,000 sq ft)
City fringe
Manulife Centre JustCo Co-working New location (50,000 sq ft)
Visioncrest Commercial GFK Singapore Technology Relocation (11,000 sq ft)
The Metropolis Decentralised areas Aedas Architecture Relocation (20,000 sq ft)
Source: Various sources, EDMUND TIE Research
EDMUND TIE RESEARCH 5Rental rates Table 6 : Average monthly gross office rents ($ per sq ft)
Q-o-q
The average gross monthly rents rose across
Location Grade Q3 2019 Q4 2019 change
most of the sub-locations by 0.0 to 1.7 per (%)
cent q-o-q (Table 6). Average CBD rents rose Marina Bay A+ 11.25 – 13.30 11.35 – 13.40 0.8
by 1.3 per cent q-o-q and 7.0 per cent y-o-y
Raffles Place A 9.40 – 11.50 9.60 – 11.70 1.7
for Q4 2019.
CBD A+ 10.10 – 12.10 10.20 – 12.30 1.0
Shenton Way/
Supply pipeline Robinson Road/ A 8.10 – 10.10 8.10 – 10.10 0.0
Tanjong Pagar
B 6.60 – 8.70 6.70 – 8.80 1.7
The total supply pipeline from Q4 2019 to
2023 is estimated to be approximately 4.7m Marina Centre A 8.90 – 10.90 8.90 – 10.90 0.3
sq ft (or 1.1m sq ft per annum). (Figure 7). Beach Road/ A 9.80 – 11.80 9.80 – 11.80 0.2
City Fringe North Bridge
9 Penang Road has obtained Temporary B 6.55 – 8.00 6.55 – 8.00 0.5
Road
Occupation Permit (TOP) in Q4 2019. Global
Orchard Road * 8.55 – 10.60 8.55 – 10.60 0.0
bank, UBS, will relocate its headquarters to
9 Penang Road, relocating from its offices in Decentralised Decentralised
* 5.00 – 7.50 5.00 – 7.50 0.0
One Raffles Quay North Tower and Suntec areas** areas
Tower Five. * Ungraded office space Source: EDMUND TIE Research
** Key purpose-built offices outside of CBD and CBD Fringe
Outlook
The office market is expected to expand in
Figure 7: CBD office development pipeline, million (m) sq ft
terms of footprint and leasing activity, albeit
at a moderated pace in 2020, in view of the
projected modest recovery of Singapore’s
economic growth. Demand for office space
in the CBD will continue to come from the
information & communications and finance
& insurance sectors, supported by the
healthy demand for IT and digital solutions
as well as sustained demand for payment
processing services. Firms providing asset
management and legal services could be
on the lookout for office spaces as inbound
investment to Singapore is expected to step
up on the back of investors’ search for safe
haven investment destinations in Asia. Source: URA, EDMUND TIE Research
EDMUND TIE RESEARCH 6INDUSTRIAL
Market commentary Table 7: Singapore’s NODX and PMI
Key
Key indicators Q3 Nov
economic Key trends
2019 2019
The Non-Oil Domestic Exports (NODX) and the indicators
Purchasing Managers’ Index (PMI) in November • NODX fell by 5.9 per cent in November
2019 showed tentative signs of bottoming out 2019, moderating after the 12.5 per cent
NODX -8.1 -5.9 contraction in October 2019. This was
for the manufacturing sector (Table 7). largely due to the decline in electronics
exports.
Private demand, • The PMI edged up by 0.2 points from
occupancy and supply the previous month to 49.8 points in
November 2019.
PMI* 49.5 49.8
• Based on JTC’s estimates (available at the • The electronics sector increased by 0.4
points from the previous month to report
time of this report on 17 January 2020),
a slower contraction at 49.7 points.
island-wide net absorption doubled
q-o-q to approximately 3.3m sq ft in * Reading above 50 indicates an expansion, Source: MTI, Enterprise Singapore,
while below 50 indicates a contraction. SIPMM, EDMUND TIE Research
Q3 2019, while net supply more than
doubled from 1.4m sq ft to 3.3m sq ft
q-o-q.
Figure 8: Occupancy rates of private industrial space by type
• On a quarterly basis, while net supply
100%
for single-user factories (1.1m to 2.3m
sq ft) and warehouses (0.7m to 1.1m sq 95%
ft) increased in Q3 2019, net supply for 90%
multiple-user factories remained in the 85%
negative zone (-22,000 sq ft). There was no
80%
new business park space supply in Q3 2019.
75%
• Occupancy rates of private industrial 70%
space were relatively steady in Q3 2019,
Q3 2010
Q3 2011
Q3 2012
Q3 2013
Q3 2014
Q3 2015
Q3 2016
Q3 2017
Q3 2018
Q3 2019
with slight q-o-q improvements across
industrial types – multiple-user factories
(0.1 percentage points), single-user Multiple-user factory space Single-user factory space
factories (0.3 percentage points) and Business park space Warehouse space
business parks (0.3 percentage points),
Source: JTC, EDMUND TIE Research
except for warehouses which recorded a
figure of -0.5 percentage points (Figure 8).
EDMUND TIE RESEARCH 7• Bollore Logistics has opened a new Table 8: Average monthly gross rents (island-wide)
warehouse facility, Blue Hub (538,195
Q3 2019 Q4 2019
sq ft), following the completion of the Industrial type* Q-o-q change (%)
($ per sq ft) ($ per sq ft)
warehouse in Q3. The facility is fully First-storey:
automated to support the growth 1.70 – 2.00 -0.4
Multiple-user 1.70 – 2.00
of customers in the perfumes and factory Upper-storey:
cosmetics sector. 1.40 – 1.60 -0.2
1.40 – 1.60
• Notable leases secured/expansion Warehouse/logistics 1.50 – 1.70 1.50 – 1.70 -0.8
announcements in Q3 2019 included: High-tech industrial 2.90 – 3.10 2.90 – 3.10 0.3
– Neste, a Finnish energy giant Central region:
4.40 – 4.90 1.2
4.40 – 4.90
announced expansion plans to boost Business park
its Tuas facility capacity from 1m to Suburban areas:
3.50 – 3.80 0.5
3.50 – 3.80
2.3m tonnes.
* In-house estimates of key selected Source: EDMUND TIE Research
– Amazon Singapore expanded its private industrial premises.
warehouse space in Mapletree
Logistics Hub to support its ramp-up
of its retail operations in Singapore. Figure 9: Private monthly industrial gross rents ($ psf per month) by type
– An established global technology, 6
defence and engineering company
headquartered in Singapore has 5
secured over 300,000 sq ft of space
4
in Commodity Hub (under Cache
Logistics Trust’s portfolio). 3
– P-Way Construction and Engineering
2
has secured about 168,800 sq ft of
space at 8 Tuas South Lane, a multiple- 1
user factory.
Q4 2010
Q4 2011
Q4 2012
Q4 2013
Q4 2014
Q4 2015
Q4 2016
Q4 2017
Q4 2018
Q4 2019
Rental rates
First-storey Upper-storey Hi-tech Business park (Central Region)
• Based on our estimates, monthly rental Source: EDMUND TIE Research
rates for multiple-user factories and
warehouse/logistics* moderated in Q4
2019, as industrial demand remained
lacklustre for these sub-sectors amid
weakened manufacturing performance
(Table 8 and Figure 9).
• Monthly rents for high-tech industrial and
business parks reported quarterly increases
due to the limited available supply.
EDMUND TIE RESEARCH 8Supply pipeline Figure 10: Private industrial development pipeline (with planning
approvals and GLS sites which are pending approvals), million (m) sq ft
• From Q4 2019 to 2022, there will be
approximately 26.2m sq ft NLA (or 8.1m sq
ft per annum) in the supply pipeline. This
is significantly lower than the past 3- and
5-year annual average supply (Figure 10).
• There are five business park
developments in the pipeline, totalling
1.4m sq ft, including an A&A to the
existing development at 13 International
Business Park by Pension Real Estate
Singapore Pte Ltd.
• While consultancy firm Surbana-Jurong’s
new campus is due for completion in
2021, tech companies such as Grab Source: JTC, EDMUND TIE Research
Headquarters (317,000 sq ft) and Razer
Headquarters (145,000 sq ft) are due for
completion in 2020.
Outlook
The industrial property market is expected achieve a wider global reach. An example is the Digital and Advanced
to see modest improvements in 2020, Manufacturing Programme launched on 19 December 2019, which
supported by the gradual recovery in allows companies to explore new technologies and undergo training.
the manufacturing sector. Of which, the
Additionally, Singapore continues to invest in infrastructure, partnerships
electronics and precision engineering
and innovation to boost its digital economy. This includes the introduction
exports are expected to improve with
of 5G mobile networks by 2020 to ensure Singapore’s competitive edge
possible easing of US-China trade tensions.
as a trading and connectivity hub. Amid rising labour costs, the use of
Moving forward, the Government has digital tools will also help companies to operate effectively.
introduced various initiatives to assist
With a tapered supply in the pipeline over the next few years,
industrial companies in the upgrading of
occupancy and rental rates are expected to receive some support.
their digital capabilities and facilities to
EDMUND TIE RESEARCH 9RETAIL Figure 11: Y-o-y change in retail sales index (excluding motor vehicles)
Market commentary
Key indicators
• Retail sales index (excluding motor
vehicles) trended downwards for the
fourth consecutive quarter by 1.3 per
cent q-o-q in Q3 2019 (Figure 11).
However, the decline in Q3 2019 was
moderated as compared to the -1.8 per
cent contraction in Q2 2019.
Source: Department of Statistics Singapore
• In October 2019, the top three
gainers (on y-o-y basis) were wearing
apparel and footwear as well as the Figure 12: Retail sales index (Oct 2019), y-o-y change
supermarkets, hypermarkets; mini- Wearing Apparel & Footwear 6.6%
marts and convenience stores sectors. Supermarkets & Hypermarkets 1.9%
The furniture and household equipment, Mini-marts & Convenience Stores 0.7%
optical goods and books as well as Computer & Telecommunications Equipment -0.1%
watches and jewellery sectors reported Medical Goods & Toiletries -1.3%
the largest contraction y-o-y in the same Food Retailers -1.8%
month (Figure 12). In terms of the Food Department Stores -1.9%
& Beverage services index, fast food Recreational Goods -2.7%
outlets had the largest expansion of 6.3 Watches & Jewellery -4.2%
per cent y-o-y (Figure 13). Optical Goods & Books -6.4%
Furniture & Household Equipment -7.4%
-10% -8% -6% -4% -2% 0% 2% 4% 6% 8%
Source: Retail Sales Index at Constant Prices (SSIC 2015 Version 2018)
from Department of Statistics Singapore
Figure 13: Food & Beverage services index (Oct 2019), y-o-y change
Food Caterers -7.2%
Cafes, Food Courts & Other Eating Places 1.6%
Restaurants 4.3%
Fast Food Outlets 6.3%
-10% -5% 0% 5% 10%
Source: Food & Beverage Services Index at Constant Prices (SSIC 2015 Version 2018)
from Department of Statistics Singapore
EDMUND TIE RESEARCH 10• The online retail sales proportion has Figure 14: Retail sales value and proportion of online retail sales
also been on an increasing trend since 4,500 8
the start of 2019 supported by the 4,000 7
growth in e-commerce (Figure 14). 3,500 6
3,000
• Tourism receipts declined by 1.3 per cent 5
2,500
y-o-y to $6.5bn in Q2 2019 and majority 4
2,000
of the sectors reported a decline y-o-y. 3
1,500
Visitors from Mainland China, Indonesia 2
1,000
and India were the top nationalities
500 1
that visited Singapore in Q3 2019. The
0 0
ongoing Hong Kong unrest situation have
2018 Jun
2019 Mar
2019 May
2019 Jun
2019 Jul
2018 May
2018 Jul
2018 Aug
2019 Aug
2018 Mar
2018 Dec
2019 Apr
2018 Feb
2018 Apr
2018 Sep
2019 Feb
2019 Sep
2019 Oct
2018 Oct
2018 Jan
2018 Nov
2019 Jan
also prompted more Mainland Chinese
visitors to visit Singapore.
Retail Sales Value - Estimated (millions) (LHS)
Online Retail Sales Proportion (%) (RHS)
Private demand, Source: Department of Statistics Singapore, EDMUND TIE Research
occupancy and supply
• Based on URA statistics (available at the Q3 2019 with the completion of Paya Lebar Quarter (Phase 2) (NLA:
time of this report on 17 January 2020), 291,000 sq ft) and A&A to the existing podium of China Square
the retail market saw modest demad Central (NLA: 80,000 sq ft).
with total net absorption moderating to
• From URA’s estimates, island-wide occupancy increased marginally
374,000 sq ft in Q3 2019, from 888,000 sq
by 0.1 percentage points q-o-q to 91.3 per cent in Q3 2019.
ft in Q2 2019. Net supply was positive in
Orchard/Scotts Road (OSR) Other City Areas 1 (OCA) Fringe/Suburban Areas2 (FSA)
Net • Net absorption reversed from 36,000 sq ft in • Net absorption moderated to • Net absorption moderated to
absorption Q2 2019 to -12,000 sq ft in Q3 2019. 187,000 sq ft in Q3 2019, from 199,000 sq ft in Q3 2019, from
382,000 sq ft in Q2 2019. 469,000 sq ft in Q2 2019.
Occupancy • Occupancy rate declined slightly by 0.1 • Occupancy rate increased by • Occupancy declined slightly by
percentage points q-o-q to 94.2 per cent in Q3 0.9 percentage points q-o-q 0.3 percentage points to 90.4
2019 (Figure 15). to 91.4 per cent in Q3 2019. per cent in Q3 2019.
New • Five Guys (F&B) in Plaza Singapura • Carmen’s Best (F&B) in Capitol • Yun Nans (F&B) in Westgate
Openings • Go Noodle House (F&B) in 313@Somerset Singapore • Sony (technology) in Westgate
(Q4 2019) • Nam Dae Mun (F&B) in 313@Somerset • Asus Experience Store • Don Don Donki (F&B) in Jcube
• Merci Marcel (F&B) in Palais Renaissance (technology) in Bugis Junction • Rabeanco (Leather specialist)
• Social Place (F&B) in Forum The Shopping Mall • Liverpool FC Singapore store in Jewel Changi
• Croquant Chou Zakuzaku (F&B) in Ion Orchard (Fashion) in Bugis Junction
• Style Theory (Fashion) in 313@Somerset • The Whale (F&B) in China
Square Central
• La Mer (Skincare) in The
Shoppes at Marina Bay Sands
Closures • Crate & Barrel (furniture and homeware) • Gudetama Cafe and My • Home-Fix (all outlets)
(Q4 2019) in Orchard Gateway Melody Cafe in Suntec City • Sasa (all outlets)
• Hokkaido’s Bake Cheese Tart (F&B) in
Ion Orchard
1 Other City Areas refer to Downtown Core and Rest of Central Area Source: URA, EDMUND TIE Research
2 Fringe/Suburban Areas refer to Fringe Areas and Suburban Areas (Outside Central Region)
EDMUND TIE RESEARCH 11Rental rates Figure 15: Retail occupancy rates (Q3 2019)
Based on our estimates, island-wide average
monthly rental rates increased marginally by
0.3 per cent to $22.20 per sq ft in 2019. On
a q-o-q basis, rents declined slightly in the
Orchard/Scotts Road subzone (Table 9).
Leasing demand for first storey/prime retail
spaces in other city areas recovered slightly,
as retailers sought prime spaces to capture
higher footfall and visibility.
Amid cautious consumer sentiment, we
observed a slight decline in demand for
upper-floor retail spaces in fringe/suburban
areas, with a 0.7 per cent q-o-q decline in
monthly rentals for the last quarter of 2019.
Source: URA, EDMUND TIE Research
Table 9: Average monthly gross rents ($ per sq ft)
Location Q3 2019 Q4 2019 Q-o-q change
First storey:
34.10 – 39.10 -0.2
34.20 – 39.20
OSR
Upper storey:
13.90 – 18.00 -0.3
14.00 – 18.00
First storey:
16.10 – 21.30 0.1
16.10 – 21.10
OCA
Upper storey:
8.10 – 12.10 -0.1
8.10 – 12.10
First storey:
25.30 – 31.30 0.0
25.30 – 31.30
FSA
Upper storey:
14.90 – 19.90 -0.7
15.00 – 20.00
Source: EDMUND TIE Research
EDMUND TIE RESEARCH 12Supply pipeline Figure 16: Retail development pipeline, million (m) sq ft
The supply pipeline from Q4 2019 to 2022
is projected to be limited comprising some
602,000 sq ft NLA (Figure 16). In Q4 2019, 9
Penang Road in the OSR has obtained TOP,
comprising an NLA of 15,000 sq ft.
Outlook
The retail property market remained fairly
uncertain in view of the soft retail sales
performance, tight labour regulations and
the growing e-commerce industry. Despite
these challenges, the F&B sector is viewed
as the bright spot of the industry as seen
Source: URA, EDMUND TIE Research
from the growth of 4.5 per cent y-o-y in the
F&B services index in October 2019. This is
supported by the many new F&B concepts
introduced in 2019 and some of which have Moving forward, integrating physical brick-and-mortar experience with
attracted visible crowds of customers (e.g. online retailing will be an essential strategy for asset owners and retailers
Shake Shack in Jewel Changi). In H2 2019, to expand their consumer outreach.
various sales events, such as Singles Day and
Black Friday have been introduced, which As a case in point, we have witnessed trend reversal from established
helped to boost retail sales. online retailers – such as Taobao and Love, Bonito – which have moved
into physical retail space for an omnichannel approach. Mall owners,
together with their business partners, are likely to step up their proactive
engagement strategies with retailers and visitors to continously bring
new retail concepts and activities in their retail spaces.
Island-wide overall retail rentals are projected to trend sideways
within the band range of -1.0 to 1.0 per cent in 2020 and the limited
supply pipeline from 2020 onwards will provide some support to rents
and occupancy levels.
EDMUND TIE RESEARCH 13RESIDENTIAL
Market commentary Figure 17: New housing loans limits granted
$millions
Key economic indicators 14,000
• Based on Q4 2019 Urban Redevelopment 12,000
Authority (URA) flash estimates released
10,000
on 2 January 2020, private home prices
8,000
for the fourth quarter of 2019 reflected
a marginal 0.3 per cent q-o-q and 2.5 per 6,000
cent y-o-y increase. 4,000
2,000
• Private non-landed property prices
declined by 0.7 per cent q-o-q in Q4 0
Q1 2015
Q2 2015
Q3 2015
Q4 2015
Q1 2016
Q2 2016
Q3 2016
Q4 2016
Q1 2017
Q2 2017
Q3 2017
Q4 2017
Q1 2018
Q3 2018
Q4 2018
Q2 2019
Q3 2019
Q2 2018
Q1 2019
2019, a reversal compared to the 1.3 per
cent growth in Q3 2019. Of which, prices
of non-landed properties in the CCR and Source: MAS (as of 27 December 2019), EDMUND Tie Research
RCR declined, except for non-landed
properties in the OCR, which increased Figure 18: Private homes sales volume (excluding ECs) and URA All
by 2.9 per cent q-o-q in Q4 2019. Residential Price Index
• URA Landed Property Price Index 8,000 160
trended upwards by 4.0 per cent q-o-q in 7,000 155
6,000
Q4 2019, extending from the 1.0 per cent 150
5,000
growth reported in Q3 2019. 145
4,000
140
• Housing loans increased marginally by 3,000
135
3.7 per cent y-o-y in Q3 2019 (Figure 17), 2,000
after four consecutive quarters of decline 1,000 130
amid moderated demand for housing 0 125
Q4 2019*
Q1 2015
Q2 2015
Q3 2015
Q4 2015
Q1 2016
Q2 2016
Q3 2016
Q4 2016
Q1 2017
Q2 2017
Q3 2017
Q4 2017
Q1 2018
Q2 2018
Q3 2018
Q4 2018
Q1 2019
Q2 2019
Q3 2019
loans since the July 2018 property cooling
measures with further tightening of loan-
to-value threshold for borrowers. Units Sold in Secondary Market (subsale and resale) (LHS)
New Sales Units Sold by Developers (LHS)
• New sales volume is expected to Property Price Index of All Residential Properties (RHS)
outweigh resale volume, including both * Q4 2019 sales volume based on monthly developer sales and Source: URA, REALIS,
resale and sub sale, for the second caveats from REALIS as at 27 December 2019, PPI at Q4 2019 EDMUND Tie Research
consecutive quarter in Q4 2019, albeit based on flash estimate
at a lower new sales volume compared
to the third quarter due to the lower
number of launches for the last quarter
of 2019 (Figure 18 and Table 10).
EDMUND TIE RESEARCH 14Table 10: Non-landed private residential launches (excluding ECs) in Q4 2019 (projects >20 units)
District Launch Initial Indicative
Total Units
Development Developer (market month in sell-down average price
units sold
segment) 2019 rate* (%) ($ psf)
Neu at Novena Roxy-Pacific Holdings Ltd 11 (CCR) 87 October 54 62 2,604
Midtown Bay GuocoLand Ltd 9 (CCR) 219 October 48 22 2,917
Royalgreen Allgreen Properties Limited 10 (CCR) 285 October 42 15 2,743
Midwood Hong Leong Holdings 23 (OCR) 564 October 24 4 1,641
The Iveria Macly Group 9 (CCR) 51 November 13 26 2,643
One Holland Far East Organization, Sino
10 (CCR) 296 November 87 29 2,680
Village Residences Group and Sekisui House
Pullman Residences, EL Development (Horizon)
11 (CCR) 340 November 12 4 2,992
Newton Pte Ltd
Dairy Farm
United Engineers 23 (OCR) 460 November 35 8 1,547
Residences
Sengkang Grand CapitaLand and City
19 (OCR) 680 November 235 35 1,746
Residences Developments Limited
Total units from Q4 2019 launches 2,982
* Estimates analysed from caveats lodged (from REALIS as of 3 January 2020) Source: URA, EDMUND TIE Research
• One Holland Village Residences, • Conversely, resale volume is envisaged to decline to about 2,000
comprising a total of 296 residential units in the last quarter, due in part to the end-of-year seasonal
units within One Holland Village mixed- lull and some homeowners are seen to be holding back their
use development, received positive divestment plans in anticipation of possible return of buyers from
responses with 87 units sold since the the first quarter of 2020.
end-November preview sales launch.
Buyers are observed to be predominantly • Total private homes sales volume for Q4 2019 is projected to reach
locals. The coveted address in prime approximately 4,600 units, higher compared to 3,860 units in Q4
district 10, combined with its integrated 2018.
development appeal in a vibrant location • With these Q4 estimates, we forecast that total sales volume of
are strong selling points for the project. private homes could reach close to 19,000 units for the whole of
• Other integrated developments with 2019, compared to 22,139 units in 2018.
residential units launched in the fourth • In terms of the private residential leasing market, total rental
quarter that saw encouraging responses contracts volume rose by 4.5 per cent y-o-y to reach 27,000
include Midtown Bay and Sengkang Grand transactions in Q3 2019 (Figure 19). The URA Rental Index for All
Residences. Homebuyers are attracted to Residential Property has risen for three consecutive quarters in
the multiple attributes of trade variety, 2019 with cumulative increase of 2.4 per cent from Q4 2018. These
convenience and lifestyle appeal offered trends were supported by the lower number of completed private
by these integrated developments. homes in 2019 and a firmer overall occupancy of 93.9 per cent for
the third quarter. In view of a weakened economic performance
for the second half of 2019 and dimmed job market prospects that
EDMUND TIE RESEARCH 15could have curtailed foreign workforce Figure 19: Number of private home rental transactions (excluding ECs)
growth and accommodation budgets,
we envisage overall private home rental
movement to trend sideways with -0.3
to 0.2 per cent q-o-q change in Q4 2019
(Figure 20).
Outlook
• Notwithstanding the new high pricing set
by new launch projects in 2019 compared
to previous year’s launches, there is
growing acceptance from homebuyers
on the price premium factors accorded
to well-located projects with concepts
* Preliminary estimates of rental transactions in Q4 2019, Source: REALIS,
that appeal in lifestyle and convenience. based on REALIS data as of 3 January 2020 EDMUND Tie Research
The Government’s 2019 Master Plan to
transform various precincts has provided Figure 20: Private non-landed home completions (excluding ECs)
clarity on Singapore’s future property and URA Rental Index
landscape and instilled confidence on
9,000 114
the prospects of residential property 8,000 112
investment. 7,000 110
6,000 108
• The high liquidity in the market, fuelled 5,000
106
by low interest rates, has also supported 4,000
3,000 104
demand for residential property 2,000 102
investment. With limited attractive 1,000 100
options to invest in equities and bonds 0 98
Q4 2019*
Q1 2015
Q2 2015
Q3 2015
Q1 2016
Q2 2016
Q3 2016
Q4 2016
Q2 2017
Q3 2017
Q4 2017
Q1 2018
Q3 2018
Q4 2018
Q1 2019
Q2 2019
Q3 2019
Q4 2015
Q1 2017
Q2 2018
amid compressed yields and returns,
non-institutional retail investors view
residential property as a possible long- Total Non-landed Completions (LHS) URA non-landed rental index (RHS)
term investment and a hedge against
inflation. For foreign investors, the strong * Based on forecast of -0.1 per cent q-o-q Source: URA, REALIS, EDMUND Tie Research
change for rental index in Q4 2019
Singapore Dollar which has held up well
historically against regional currencies, is • In consideration of a potential recovery in economic outlook with
another attraction. preliminary easing of trade frictions and assuming existing cooling
measures to remain status quo, we could expect private home prices
• The upcoming launches in the first half of
to trend at a steady growth path in 2020, akin to a ‘Goldilocks effect’.
2020, located mainly in the Core Central
We forecast 2 per cent to 4 per cent annual price growth for private
Region, will be closely watched as the
homes for year 2020, with possible price uptick of 0.5 per cent to 0.8
market assess demand conditions and
per cent for non-landed homes in the first quarter of 2020.
sales performance.
EDMUND TIE RESEARCH 16CONTACTS Ong Choon Fah
Chief Executive Officer
+65 6393 2318
choonfah.ong@etcsea.com
PROFESSIONAL SERVICES
Valuation Advisory Property Tax Advisory & Hospitality Property Management
Poh Kwee Eng Statutory Valuation Nicholas Cheng Kwok Sai Kuai
Executive Director Ng Poh Chue Executive Director Executive Director
Regional Head of Executive Director +65 6393 2317 Regional Head of
Valuation Advisory +65 6393 2515 nicholas.cheng@etcsea.com Property Management
+65 6393 2312 pohchue.ng@etcsea.com +65 6417 9229
kweeeng.poh@etcsea.com Heng Hua Thong saikuai.kwok@etcsea.com
Senior Advisor
Nicholas Cheng Research & Consulting +65 6393 2398 Paul Wong
Executive Director huathong.heng@etcsea.com Senior Director
Ong Choon Fah
+65 6393 2317 +65 6417 9225
Chief Executive Officer Tay Hock Soon
nicholas.cheng@etcsea.com paul.wong@etcsea.com
+65 6393 2318 Senior Director
choonfah.ong@etcsea.com +65 6887 0088
tayhs@treetops.com.sg
AGENCY SERVICES REGIONAL OFFICES
Investment Advisory Auction & Sales Business Space & Retail Malaysia
Ong Choon Fah Nicholas Cheng Chua Wei Lin Eddy Wong
Chief Executive Officer Executive Director Executive Director Managing Director
+65 6393 2318 +65 6393 2317 Regional Head of +603 2024 6380
choonfah.ong@etcsea.com nicholas.cheng@etcsea.com Business Space eddy.wong@ntl.my
+65 6393 2326
Edmund Tie Joy Tan weilin.chua@etcsea.com
Senior Advisor Senior Director
+65 6393 2386 +65 6393 2505
edmund.tie@etcsea.com joy.tan@etcsea.com China Desk Thailand
Yam Kah Heng Yam Kah Heng Ong Choon Fah
Senior Advisor Residential Senior Advisor Chief Executive Officer
+65 6393 2368 +65 6393 2368 +65 6393 2318
kahheng.yam@etcsea.com Margaret Thean kahheng.yam@etcsea.com choonfah.ong@etcsea.com
Executive Director
Heng Hua Thong Regional Head of Residential Heng Hua Thong Punnee Sritanyalucksana
Senior Advisor +65 6393 2383 Senior Advisor Chief Operating Officer
+65 6393 2398 margaret.thean@etcsea.com +65 6393 2398 +66 2257 0499 ext 101
huathong.heng@etcsea.com huathong.heng@etcsea.com punnee.s@etcthailand.co.th
Karen Ong
Swee Shou Fern Senior Director Tan Chun Ming
Executive Director +65 6393 2366 Executive Director
+65 6393 2523 karen.ong@etcsea.com +65 6393 2360
shoufern.swee@etcsea.com chunming.tan@etcsea.com
Tan Chun Ming
Executive Director
Regional Investment Advisory
+65 6393 2360
chunming.tan@etcsea.com
Editor: Authors:
Saleha Yusoff Alice Tan Isabelle Seto
Executive Director Senior Director Senior Research Analyst
Regional Head of Research & Consulting Research
Research & Consulting +65 6393 2329 +65 6393 2382
+603 2161 7228 ext 302 alice.tan@etcsea.com isabelle.seto@etcsea.com
saleha.yusoff@etcsea.com
For more information, please contact us at research.sg@etcsea.com.
Disclaimer: The information contained in this document and all accompanying presentations (the “Materials”) are approximates only, is subject to change
without prior notice, and is provided solely for general information purposes only. While all reasonable skill and care has been taken in the production of
the Materials, Edmund Tie & Company (the “Company”) make no representations or warranties, express or implied, regarding the completeness, accuracy,
correctness, reliability, suitability, or availability of the Materials, and the Company is under no obligation to subsequently correct it. You should not rely on the
Materials as a basis for making any legal, business, or any other decisions. Where you rely on the Materials, you do so at your own risk and shall hold the Company,
its employees, subsidiaries, related corporations, associates, and affiliates harmless to you to and any third parties to the fullest extent permitted by law for any losses,
damages, or harm arising directly or indirectly from your reliance on the Materials, including any liability arising out of or in connection with any fault or negligence. Any
disclosure, use, copying, dissemination, or circulation of the Materials is strictly prohibited, unless you have obtained prior consent from the Company, and have credited
the Company for the Materials. © Edmund Tie & Company 2020
Edmund Tie & Company (SEA) Pte Ltd
5 Shenton Way, #13-05 UIC Building, Singapore 068808. | www.etcsea.com | T. +65 6293 3228 | F. +65 6298 9328 | mail.sg@etcsea.comYou can also read