Public Transport during coronavirus outbreak - TU Delft ...
←
→
Page content transcription
If your browser does not render page correctly, please read the page content below
BSC THESIS - CIVIL ENGINEERING

Public Transport during
 coronavirus outbreak
A research of measures taken in Dutch and
 international PT
 C.G. (Gerben) van der Horst - 4673417
 14-6-2020

 CTB3000-16 Bachelor Eindwerk, Transport & Planning
 Coördinator: Ir. R.P. (Rolf) Koster
 Supervisors: Dr. ir. A.M. (Maria) Salomons &
 Dr. ir. Y. (Yufei )Yuan
 Expert: Dr. ir. N. (Niels) van Oort
Preface
This report is meant for people interested in public transport during the COVID-19 pandemic. No
background knowledge in the public transport field is needed to understand the report.

The conducted research can be seen as an addition to other research about COVID-19, in particular
to the UITP’s research on operators actions and practices (UITP, 2020 -a) and to Oxford University’s
research on government responses to the pandemic (Blavatnik School of Government, University of
Oxford, 2020).

I want to thank my supervisors Dr. ir. A.M. Salomons and Dr. ir. Y. Yuan as well as my peers for their
continuous feedback. I want to thank Pedro Peters for allowing me to take an interview with him and
I want to thank Dr. ir. N. van Oort for his advice and guidance throughout the research.

 1
Summary
During 2020’s coronavirus pandemic, governments took measures to reduce the spreading of the
COVID-19 virus. These measures had a major influence on everyday life and consequently on public
transport as well. Public transport (PT) had a difficult position during the pandemic, because their
service is essential for, amongst others, health workers. At the same time their service could be very
dangerous, due to the high number of people and contact points present in public transport vehicles.
This makes it interesting to know how public transport was organised during the pandemic. Leading
to the research question of this report: How was public transport organized during the COVID-19
pandemic?

The goals for this research were to find data about the actions by public transport companies or
actions on public transport by governments. The research consisted of an analysis on the actions by
Dutch public transport companies and a general global analysis on the closing of public transport and
the use of face masks, where the implementation dates for each of these measures in different
countries were found. For the Dutch public transport companies, a detailed analysis of the changes
to the timetable in specific phases was made. In general the companies reduced their service, due to
personnel reporting sick and the amount of passengers decreasing by about 90% (Puyleart, G., 2020).
Also, the physical measures were stated and the reason behind them explained. The research was
conducted as objectively as possible, no opinion on any actions will be found in this report.

The changes to the timetable for every line in the network of every major Dutch PT company, for
every mode of (public) transport and every defined phase, were compared very precisely to the
normal timetable. These were then expressed as the relative amount of service left to be able to
compare the findings between companies and to be able to compare the findings to the relative
amount of passengers. The international measures were visualized on world maps for every day from
January 1st up to June 1st.

The conclusion to this research gives an answer to the research question in the form of data. One of
the most notable things that can be concluded from the data, is that many companies, countries and
governments responded differently with both their actions and timing. People acted on their current
knowledge and experts opinion, and did not know for certain what the optimal decision would be.
However, within the Netherlands, the response between different companies was very similar,
despite there being so much uncertainty worldwide.

The research can be used in future projects, where, for example, the actions and/or companies could
be assessed or the relation between (measures in) public transport and the spreading of a virus could
be investigated.

 2
Contents
Preface .................................................................................................................................................................... 1
Summary ................................................................................................................................................................. 2
1. Introduction.................................................................................................................................................... 4
 1.1 Demarcation of the research ........................................................................................................................ 4
 1.2 Sub-goals ....................................................................................................................................................... 5
2. Methodology .................................................................................................................................................. 6
 2.1 Main focus and data collection ..................................................................................................................... 6
 2.1.1 Phases .................................................................................................................................................... 6
 2.1.2 The timetables ....................................................................................................................................... 7
 2.1.3 The measures ........................................................................................................................................ 9
 2.1.4 Foreign measures .................................................................................................................................. 9
 2.2 Concluding the research ............................................................................................................................. 10
 2.2.1 Comparison ......................................................................................................................................... 10
 2.2.2 Conclusions .......................................................................................................................................... 10
3. Results .......................................................................................................................................................... 11
 3.1 Timetables .................................................................................................................................................. 11
 3.1.1 Train..................................................................................................................................................... 11
 3.1.2 Tram .................................................................................................................................................... 12
 3.1.3 Metro ................................................................................................................................................... 13
 3.1.4 Bus ....................................................................................................................................................... 15
 3.1.5 Summary all modes of transport ......................................................................................................... 16
 3.2 Measures .................................................................................................................................................... 16
 3.3 Foreign measures ....................................................................................................................................... 18
 3.3.1 Different measures .............................................................................................................................. 18
 3.3.2 World map ........................................................................................................................................... 19
4. Discussion ..................................................................................................................................................... 22
5. Conclusion .................................................................................................................................................... 23
6. Recommendations ....................................................................................................................................... 24
References ............................................................................................................................................................ 25
Appendix A ............................................................................................................................................................ 28
Appendix B ............................................................................................................................................................ 30
Appendix C ............................................................................................................................................................ 31
Appendix D ............................................................................................................................................................ 32
Appendix E ............................................................................................................................................................ 33

 3
1. Introduction
In the year 2020, the world suffered from a global pandemic. This pandemic was caused by the SARS-
CoV-2 virus, a virus from the family of coronaviruses. The disease caused by the virus was called
Coronavirus disease 2019 (COVID-19 for short), the first signs of the virus were discovered in 2019
(Bos, R., 2020).

Due to the coronavirus outbreak, many countries have taken measures to reduce the spreading of
COVID-19, such as stay-at-home requirements, school closings and/or the usage of face masks. In the
Netherlands the government had chosen for a so called ‘intelligent lockdown’ (Rijksoverheid, 2020 -
b). This means that, in the Netherlands, in general people should stay inside. They were still allowed
to go outside, on the condition of keeping at least one and a half meter distance from each other and
avoid gatherings of (large) groups. Companies had their own responsibility when it came to making
sure this measure was obeyed. Besides that, due to the virus and the measures, the amount of
passengers in public transport drastically decreased (UITP, 2020 -a). Public transport was in a crucial
position, as they are an essential service to the public, but at the same time they are a potential high
risk area for getting infected. This leads to the research question of this thesis: How was public
transport organized during the COVID-19 pandemic?

1.1 Demarcation of the research
The research focussed on the measures taken in public transport, in particular those in the
Netherlands, by Dutch public transport companies.

In the Netherlands
The following companies were analysed, which are some major public transport companies in the
Netherlands: Arriva, GVB, Hermes, HTM, Nederlandse Spoorwegen (NS), Qbuzz and RET. More
information about the companies and other stakeholders can be found in appendix A.

When it comes to the changes to the timetable, a distinction was made between modes of transport.
Different modes of transport can’t be compared (objectively) on their timetables, as different modes
have different hours of operation and different operating fields. A company is considered for a mode
of transport if it has at least 3 different lines for that mode. This is to exclude companies with only
one or two lines, which would result in too small of a sample size to determine the relative change in
service. This will be explained in more detail in the second chapter: Methodology.

Due to time constraints, not all bus companies that fit the criteria, could be considered. Also, only
city bus lines could be considered, any regional bus lines were left out. Table 1 shows which
companies are considered per mode of transport, for the bus: Arriva, EBS, Keolis, Qbuzz and
Transdev were left out. GVB, HTM and RET were chosen, because they operate in Amsterdam, Den
Haag and Rotterdam respectively, the three largest cities in the Netherlands.

Table 1: Considered companies per mode of transport

 Mode of transport Considered companies
 Train Arriva, NS
 Tram GVB, HTM, Qbuzz (U-OV), RET
 Metro GVB, RET
 Bus GVB, HTM, RET

 4
Internationally
The research was expanded to other countries. An analysis was made on which measures were taken
in certain countries across the globe. A list of analysed countries can be found in Appendix D, which
countries were analysed was dependent on the data available.

More detailed maps were made about the mandatory use of face masks and operation levels in
public transport. Only these measures were made into maps due to time and data constraints.

The findings of all research in the report are presented and treated as objectively as possible, no
assessment was made of any actions or measures. So, no opinion on any measures will be found in
this report.

1.2 Sub-goals
To answer the main research question, data was gathered from Dutch public transport companies
and governments across the globe. This was done according to the following sub-goals:

In the Netherlands:
 • Define distinct phases, caused by government measures and subsequent PT companies`
 actions
 • Determine the changes made to the timetable per company per phase per mode of transport
 • Determine the amount of service with respect to the normal, 2020 timetable, by analysing
 the frequencies and operating hours of all lines per company per mode of transport
 • Determine the physical measures taken per phase.

Internationally:
 • Determine (some of) the measures taken in different countries
 • Determine the date of lockdown for each country
 • Determine the actions on public transport per country and the date when these actions were
 first implemented.
 • Determine the date and policy on the mandatory use of face masks per country

How the research was conducted and how the research was concluded can be read in chapter 2:
Methodology. After that, chapter 3, with the results, follows. Finalizing the report are chapters 4 and
5, the discussion and the conclusion respectively.

 5
2. Methodology
In this chapter the methodology is discussed. This was done through two major sections: The main
focus and data collection section and the finalizing section about the conclusion to the research. The
methodology will clearly state how the research was conducted, how the data was collected and how
the research was concluded.

2.1 Main focus and data collection
The changes to the timetable and the measures taken, differ over time. Therefore, it is important to
clearly define phases to which the changes and measures can be linked. Every country had its own
phases, but due to the scope of this project and the goals of the research, only the phases in the
Netherlands are defined. The main focus of this report is elaborated after the phases are defined,
and consists of the research on the timetable changes in the Netherlands, the measures in the
Netherlands and the measures in other countries.

2.1.1 Phases
Different measures were taken by public transport companies in response to government actions
and advice by the Rijksinstituut voor Volksgezondheid en Milieu (RiVM). Four distinctive phases can
be defined, these phases follow from major government measures (Rijksoverheid, 2020 -c) and are
not directly related to the virus. However, they are indirectly related, as government measures (and
relaxing of) are based on data and experts opinion off the virus. These phases are applicable to the
measures taken and the changes to the timetable.

Phases of responses by public transport companies, since the first detected case in the Netherlands
[February 27]:

 ➢ Phase 1, Lockdown: Response to intelligent lockdown [March 19 to 23 – April 28].

On the 9th of March, the government took action in the province of Noord-Brabant, issuing them to
work from home. Nationwide, washing hands more frequently and avoiding handshakes was
recommended. From the 13th of March, all gatherings of a hundred people or more were prohibited
(Rijksoverheid, 2020 -c).
On the 16th of March, prime minister Mark Rutte announced the Dutch response to the virus
outbreak. Later this response would be known as the “intelligent lockdown”. The measures included:
closing of the catering industry, work from home advice, closing of schools, prohibiting contact
labour and prohibiting gatherings of groups with more than 3 people (excluding families). From this
day, and throughout all future phases, the government told people to only use public transport if
absolutely necessary and to report sick to work, even when showing very minor symptoms.

From the 19th of March the visiting of nursing homes was prohibited as well. All these measures
meant that the amount of people not leaving their home on a regular day went from approximately
20% to approximately 50% and the amount of movements per person per day went from 2.3 to 1.2.
(Haas, M. d., Hamersma, M. & Faber, R., 2020). The public transport sector saw a decrease of about
90% in passenger amounts (Puyleart, G., 2020). Therefore, and due to more personnel reporting sick
(UITP, 2020 -b), most companies changed their timetables or introduced a new timetable on March
19 to March 23 (varying per company), where the amount of service was drastically reduced.

 6
The government announced that the measures will at least hold to the 28th of April, and around this
date a re-evaluation will take place. This caused most PT companies to also announce the special
timetables to be in effect, at least up to the 28th of April.

 ➢ Phase 2, Busier: Response to increasing amounts of passengers [April 29 – May 10].

On the 21st of April, the government announced that primary schools would be partially and day-
care’s would be fully opened by the 11th of May. Sports were allowed per April 28, for people up to
the age of 18 years old (Rijksoverheid, 2020 -c). Due to this announcement, and some general
trends, some companies noticed an increasing amount of passengers. This caused them to make
changes to the timetable, increasing the service.

 ➢ Phase 3, Relaxing: Response to relaxing of measures. [May 11 – May 31].

From the 11th of May some measures were relaxed: Contact labour was allowed again as well as
sports for all ages. The visiting of nursing homes could gradually be increased. Also, visiting a library
was allowed (Rijksoverheid, 2020 -c). Still, one and a half meter distance should be kept. The relaxing
of these measures caused many companies to adjust their schedules once more, increasing the
amount of service.

 ➢ Phase 4, Open up: Return to normal timetable and some everyday activity [June 1 - present].

From the first of June, the government issued public transport companies to return to the normal
timetable. For this research it is assumed that all companies obliged and changed their service back
to (nearly) 100% which allowed for a maximum occupation of 40% of the normal amount of
passengers (Rijksoverheid, 2020 -e). This phase, where the government requested the change to the
timetable, is inherently different from phase 1, 2 and 3, where companies acted by themselves. The
catering industry, museums, (movie-) theatres, were all opened for groups up to 30 people
(Rijksoverheid, 2020 -c). The government ordered people in public transport to wear face masks,
more about this and the specific measures in public transport for every phase can be read in the
Results part of this report. In figure 1, the defined phases can be seen on a timeline, showing that
phase 1 is the longest and phase 2 the shortest.

 First case NL: February 27 Timeline - Phases Phase 4, Open up: June 1
 Phase 2, Busier: Phase 3, Relaxing: May 11
 Phase 1, Lockdown: March 19-23 April 29

27/02 19/03 09/04 30/04 21/05
 Date (dd/mm)

Figure 1: Timeline displaying the defined phases.

2.1.2 The timetables
To research the timetables, data was found through an online search. The same goes for the changes
per phase. Most of the data comes from the timetables uploaded to the websites of respective public
transport companies. The normal timetable for 2020, before the coronavirus outbreak, was found on
OVinNederland wiki for all companies and modes of transport (OVinNederland, 2020).

 7
To determine and quantify the changes to the timetable, the change in the amount of service was
determined. The service of a regular weekday was analysed, including rush hour and evening
services. For this a general assumption was made: Morning rush hours take from 6:30 to 9:00 and
afternoon rush hours take from 16:00 to 18:30 as stated by NS (2020 -e) giving a total of 5 rush hours
on a day. When a company states different rush hours, these different hours are used. To determine
the amount of hours the service is provided per day, the normal timetable of 2020 was used for each
company. The same goes for the evening service. This information was combined with the research
on the timetable, where the frequency of every single line in every phase was found, for every mode
of transport and respective companies. This frequency was multiplied with the amount of hours for
which this frequency is used on a day. This calculation resulted in the total amount of lines served
per day. This has been denoted as the amount of service. The amount of service was calculated per
phase and for the normal timetable. To compare different companies and to compare to relative
passenger amounts, the relative amount of service with respect to the old timetable was calculated,
per phase. The method can be summarized by the following formula:

 ∑ =1( , ∗ # ℎ ℎ )
 . ℎ =
 ∑ =1( , ∗ # ℎ )

Where fn,I stands for the frequency (amount of vehicles per hour) of line n in phase i and N stands for
the total number of lines. Due to the defined phases, i can only take the values 1, 2 and 3. In phase 4,
when the government issued companies to return to the normal 2020 timetable, i = normal.

The number of total operating hours in a day is the same for a lot of companies. The operations
usually start around 6:00 and end around 0:00, resulting in about 17 operating hours, both before
and during the pandemic. When this number does play a role, is in the case of rush hour or evening
services. There, the increased rush hour or decreased evening service only last for X amount of
operating hours, usually 5. In many cases, the rush hour services were removed in the adapted
schedule, causing the service of 5 hours * (frush hour – fnormal) to be lost in the new timetable.

An important remark here is that the relative amount of service, calculated here, does not accurately
represent the actual relative amount of service, as the length of lines or the amount of stops on a line
were not taken into account, due to time (feasibility) constraints. The remark can be illustrated by
the following example: say a company has 3 very short lines and 3 very long lines, both of the same
frequency and hours of operation. If the company reduces the frequency of the 3 short lines to 0
vehicles per hour, the service will be reduced to 50% according to the calculation. However, in
reality, this percentage should be much higher, as the longer lines provide more service. The same
analogy can be applied to the amount of stops on a line.

It can also been seen that a low amount of lines can give very skewed results, as the sample size
would be too small to accurately say something about a relative amount of service. Therefore, the
cut-off point of 3 lines or more was used.

The results are limited in accuracy as not every detail about every timetable is known. However,
when a detail was known, it was taken into account. For example these details include increased
services in rush hours or reduced services in evenings and for how many hours these services are
used specifically. A few unspecified extra rides, not included in the schedule, are not considered. This
also holds for changes made to the timetable, that were not stated or displayed on the site. Only the

 8
timetables (schedules) are compared, so it should be noted that changes in service due to railway
works or maintenance are not considered.

It is believed that due to comparing the relative amount of service, most of the errors will be very
minor.

Data on the amount of passengers was found through Translink. Translink is the company behind the
Dutch OV-Chipkaart and they process all transactions in public transport, in all modes (Translink,
2020). They publish only general stats about public transport, as stats from specific regions or
companies would understandably be very sensitive data. Due to the availability of the data, the
relative amount of passengers could only be shown compared to the relative amount of service for
all modes of transport.

2.1.3 The measures
Only measures specifically taken in public transport are considered. General measures like increased
hygiene, one and a half meter distance, staying at home when showing symptoms, sneezing in the
elbow, etc. are not stated explicitly. These measures applied to every citizen of the Netherlands, and
are not unique to public transport. An example of a measure that is not stated due to this criteria is
the rule to have 4 steps between each other on the escalator. This rule follows from the 1.5 meter
distance and is not unique to public transport.

The physical measures taken were found through online research and through an interview with the
chairman of OV-NL: Pedro Peters. More info about OV-NL can be found in appendix A. The public
transport companies collaborated with each other and with the government when taking measures
(Peters., P., interview, 2020). Therefore, the measures are displayed per phase and per mode of
transport and not per company. The reason for implementing a certain measure is stated as well.

2.1.4 Foreign measures
Using the responses to a survey, which was sent out by the international association of public
transport (UITP), an overview was created of the measures taken in all countries that responded and
how often certain measures were mentioned. (UITP, 2020 -a). The data is from the 27th of April,
when some countries were still experiencing the early stages of the virus. On top of that, not every
countries response to the survey is as detailed as the others, therefore not much attention was
focussed on the numbers gathered from this data.

The measures on the closing of public transport as well as the use of face masks in other countries
were analysed. These measures were not linked to the earlier defined phases, as these phases are
defined by the Dutch public transport companies responses to government actions in the
Netherlands. Instead, they were linked to the time when a country entered lockdown or issued stay-
at-home advice. This data, as well as the data on the closing of public transport is available from the
government response tracker (Blavatnik School of Government, University of Oxford, 2020). There,
researches have categorized certain responses or measures on an ordinal scale and displayed them in
timeseries format. The data for the use of face masks was found through an online search, with the
UITP (UITP, 2020 -c) being a major data provider. This data was put into timeseries format and an
ordinal scale was determined. All data for all maps up to the 1st of June will be included. Due to the
due date of the report, this cut-off point had to be made.

 9
2.2 Concluding the research
2.2.1 Comparison
The changes to the timetable by the Dutch public transport companies were compared per phase
and per mode of transport: Train, Tram, Metro and Bus. As stated earlier in section 2.1.2, for every
mode and company the relative amount of service was determined. Finally, the relative amount of
service was compared to the relative amount of passengers. Due to the data about the passengers
only being available for all modes of public transport, this data is only included in the comparison
between all modes of transport.

Initially the measures between different companies were to be compared, but as stated in section
2.1.3, the companies collaborated resulting in the same measures for every company.

2.2.2 Conclusions
The conclusions will consist of the most notable findings from the data. This will provide an answer to
the research question: How was public transport organized during the COVID-19 pandemic?

Assessing the measures taken on effectiveness was not part of this study.

The final product of this research is an overview of the found results. This overview is presented as a
table and through different graphs. The international measures will be presented in a diagram and
three world map visualisations were made for:

 • The date of lockdown for each country
 • The actions on the closing of public transport for each country
 • The policy on the mandatory use of face masks for each country.

 10
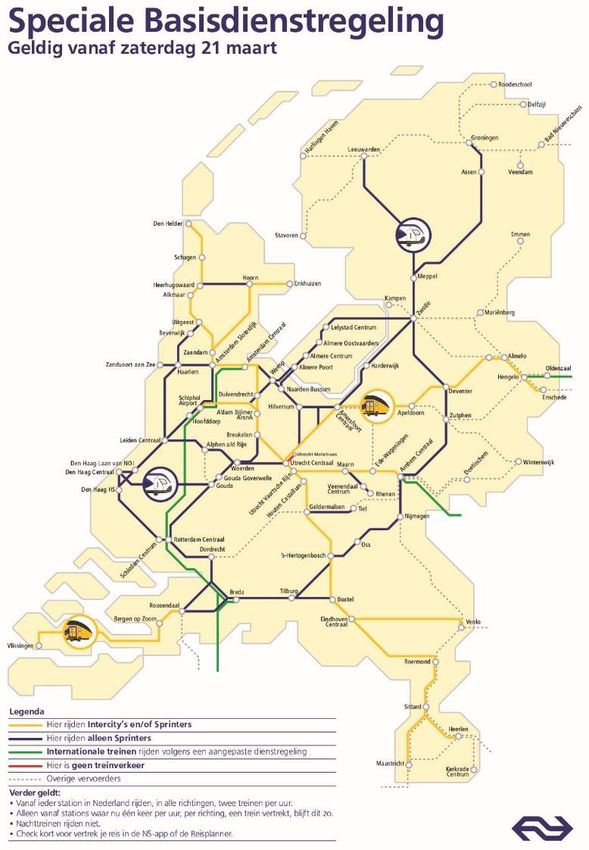
3. Results
The results to the three main parts of the research are presented in this chapter. Firstly, the results
on the timetable research are elaborated per mode of transport and per company. In appendix E and
figure 6 (section 3.1.5), an overview of all timetable results, in a table or graph respectively, can be
found. Secondly, the measures taken in public transport in the Netherlands are stated. Finally, the
measures in foreign countries are visualized.

3.1 Timetables
As stated in section 2.1.2, the companies reduced their service in phase 1. The main reason to do this
was the drastic reduction in the amount of passengers. Secondary, the large amount of personnel
reporting sick played a role in the reduction of the service. The increased stopping time, as
investigated by Goudappel Coffeng (2020) played little to no role in the reduction of the service
(Peters, P., interview, 2020).

3.1.1 Train
3.1.1.1 Arriva
Arriva made some changes to the timetable in phase 1 and some major changes on March 30 (Arriva,
2020 -a), which will be included in the changes in phase 1. These changes removed all intercity trains,
and issued a one hour stop train service on all lines, which total to 19 lines. Two lines in Groningen
and Leeuwarden form an exception, having a frequency of two trains per hour. Arriva made no major
changes in the other phases. Compared to the normal timetable (OVinNederland, 2020), Arriva had
approximately 62% of their service left in phase 1 through 3. A side note for Arriva is that their
services on ‘Blauwnet’ are not considered, because multiple different public transport companies
take part in ‘Blauwnet’.

3.1.1.2 NS
Due to a large amount of personnel reporting sick, NS reduced the rush hour service (NS, 2020 -b).
This happened on March 13th, before phase 1, and resulted in a service level of 98%. Starting from
phase 1 the NS issued a special basic timetable, which can be seen in appendix B. This timetable
consists of mainly stop trains (‘Sprinters’) from the normal timetable, which serve every station twice
per hour. Intercity trains are still used on lines to stations where no stop trains ran initially. Special
rush hour services were generally removed as well as most international trains, night trains and all
intercity direct trains. In phase 1 approximately 61% of the service was left compared to the normal
timetable. In phase 2, the amount of intercity trains was increased, one intercity direct train and the
night trains were put back into the timetable (NS, 2020 -c). This resulted in approximately 78% of the
service in phase 2. No changes were made for phase 3. The NS have 89 lines in total, including their
intercity direct lines.

3.1.1.3 Summary Trains
In figure 2 a brief summary of the result for train companies can be seen. Arriva made some changes
to their timetable on the 18th of march (Arriva, 2020 -c), however these were only in a specific region
and the info was not detailed enough to make an accurate calculation of the amount of service. This
does mean that the graph is misrepresenting the service of Arriva between the 18th of March and the
30th of March.

 11
Train
 100
 90
 80
 70
 % service left

 60
 50
 40 NS
 30 Arriva
 20
 10
 0
 27/02 19/03 09/04 30/04 21/05
 Date (dd/mm)

Figure 2: Relative amount of service of considered train companies

From the graph it can be seen that the adjusted timetables are very similar in the relative amount of
service provided. In phase 2, NS saw an increase in the amount of passenger causing them to
increase their service. Neither company made a change in phase 3.

3.1.2 Tram
3.1.2.1 GVB
In the normal timetable of 2020, GVB often has different frequencies for morning rush hour and
afternoon rush hours, these differences are taken into account. GVB has special services on shopping
evenings (Thursdays and Fridays, GVB, 2020 -b), these are not taken into account, so the service of
the normal timetable is calculated for a regular Monday, Tuesday or Wednesday. In phase 1, the GVB
reduced their tram service to four trams per hour on most lines (GVB, 2020 -d). They also removed
the rush hour trams from the timetable (line 6 and 11). This resulted in approximately 49% of their
service left in phase 1. In phase 2, GVB increased the frequency of lines 1, 13, 17 and 26, resulting in
approximately 64% of the service compared to the normal timetable (GVB, 2020 -a). In phase 3, GVB
increased the frequency of more tram lines, to match their holiday timetable. This resulted in
approximately 84% of the service compared to the normal timetable. The GVB has 15 tram lines in
total.

3.1.2.2 HTM
Originally, in the normal timetable, most tram lines of HTM had a frequency of 6 trams per hour
(HTM, n.d.). As per March 23, HTM reduced the frequency of all tram lines, which total to 12 lines, to
a frequency of 3 trams per hour and removed extra rush hour rides from the timetable
(Omroepwest, 2020). This resulted in a relative service of approximately 49% compared to the
normal timetable in phase 1. In phase 2 no changes were made and in phase 3 the frequency was
increased to 4 trams per hour, with the exception of lines 6 and 9, those were increased to 5 trams
per hour (Andriessen, K., 2020). This ultimately resulted in approximately 75% of service in phase 3.

3.1.2.3 Qbuzz (U-OV)
In the tram timetable of Qbuzz there are only three lines. Line 22, 60 and 61. Line 22 normally has a
frequency of 12 trams per hour. For lines 60 and 61 this frequency is 4 trams per hour. In all phases
Qbuzz adjusted the timetable to the Sunday timetable (U-OV, 2020). In this timetable line 22 is not

 12
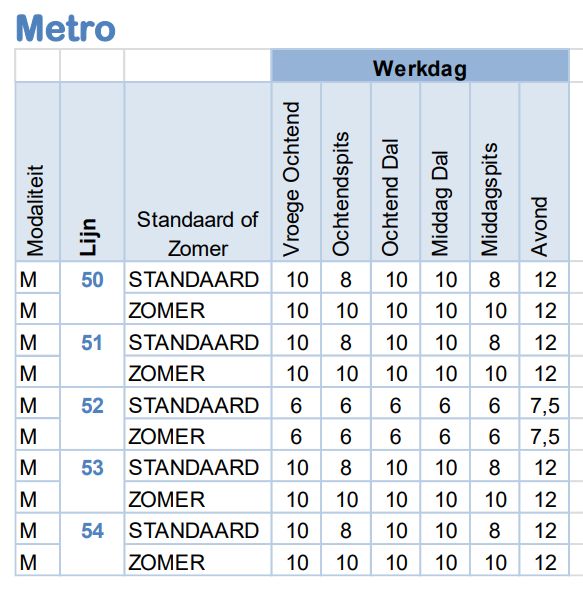
used and lines 60 and 61 are reduced to 2 trams per hour. This meant that the amount of service left
in all phases was approximately 25% compared to the normal timetable. Line 22 is the busiest line in
the network and connects, amongst others, Utrecht central station with the Utrecht Science Park.
Closing line 22 was quite logical, as activities on the Science Park and university shut down as well.

3.1.2.4 RET
In phase 1, RET reduced the tram frequency to 3 trams per hour and they removed rush hour trams
from the schedule, this includes line 20 (RET, 2020 -a). This resulted in a relative service of
approximately 51%. In phase 2, no changes were made. In phase 3 the frequency was increased for
all 10 lines, except line 21 and 24. Also line 20 started operating again, six times per hour in rush
hours. This resulted in approximately 71% of the service compared to the normal timetable.

3.1.2.5 Summary Trams
In figure 3 a brief summary of the result for tram companies can be seen.

 Tram
 100
 90
 80
 70
 % service left

 60 RET
 50
 40 GVB
 30 HTM
 20
 10 Qbuzz
 0
 27/02 19/03 09/04 30/04 21/05
 Date (dd/mm)

Figure 3: Relative amount of service of tram companies

Very noticeable in the graph Is the low amount of relative service from Qbuzz, while the other
companies have extremely similar amounts of relative service. As stated in section 3.1.2.3, Qbuzz has
only 3 tram lines, the minimum according the criteria stated in 1.1. The sample size is thus quite
small, this explains why the results are so extreme and also shows that the putting a criteria on the
sample size is valid. Seeing these results, the criteria could also have been adjusted to a minimum of
5 lines (more than 5 and the metro wouldn’t count). However, it was kept at the minimum of 3, also
to illustrate the importance of this criteria. No company made any changes in phase 2.

3.1.3 Metro
3.1.3.1 GVB Metro
As can be seen in table 2, the GVB reduced its metro services to roughly 51% compared to the
normal timetable in phase 1. They increased the service to approximately 62% of the normal
timetable in phase 2, and further to about 67% in phase 3.

In rush hours in the normal timetable, lines 50, 51, 53 and 54 have a frequency of 7.5 metros per
hour instead. This, and other details can be seen in the timetable from the GVB transport plan,
included in appendix C.

 13
Table 2: Results of the GVB metro services

 Services per hour GVB
 Line Normal Phase 1 Phase 2 Phase 3
 M50 6 4 4 4
 M51 6 0 4 4
 M52 10 6 6 8
 M53 6 4 4 4
 M54 6 4 4 4
 Percent 100% 51% 62% 67%

3.1.3.2 RET Metro
The results for the RET metro can be found in table 3. The adjusted timetable is the same in all
phases, in the adjusted timetable the service is about 63% compared to the normal timetable.

Table 3: Results of the RET metro services (Krabbendam, V., 2020)

 Services per hour RET
 Line Normal Phase 1, 2, 3
 A 6 4
 B 6 4
 C 6 4
 D 6 4
 E 6 4
 Percent 100% 63%
In rush hours, in the normal timetable, line D has a frequency of 12 metros per hour.

3.1.3.3 Summary Metro’s
In figure 4 a brief summary of the result for metro companies can be seen.

 Metro
 100
 90
 80
 70
 % service left

 60
 50
 40 RET Metro
 30 GVB Metro
 20
 10
 0
 27/02 19/03 09/04 30/04 21/05
 Date (dd/mm)

Figure 4: Relative amount of service of metro companies

From the graph it can be seen that both companies had a very similar relative amount of service.
While the GVB changed its service in every phase, the RET kept its service constant in phase 2 and 3.

 14
3.1.4 Bus
3.1.4.1 GVB
GVB made changes to their bus service levels on the 23rd and 30th of March. They removed some rush
hour services and decreased the frequency of their lines to either 4 or 2 busses per hour, dependent
on the line (GVB, 2020 -d). This reduction resulted in approximately 61% service in phase 1. Since the
4th of May, most bus lines increased their service and rush hour lines 222 and 248 started riding again
(GVB, 2020 -a). This resulted in approximately 81% service compared to the normal timetable. No
other changes were made to the bus timetable before June. The GVB has 8 rush hour lines and 27
normal lines for the city bus.

3.1.4.2 HTM
On the 23rd of March HTM reduced their bus services to about 41% compared to the normal
timetable, by decreasing the frequency of their bus lines to 2 busses per hour for all 10 bus lines.
They also removed their 2 rush hour lines from the service. HTM actually reduced their services
already on the 16th of March, however this reduction was not calculated as it was quickly overwritten
on the 23rd. Because the level of service between the 16th and the 23rd of March was not calculated,
the values for these days are incorrectly displayed in the graph. In phase 2 they made no changes and
in phase 3 they increased the frequency to 4 busses per hour and 8 busses per hour for line 25. This
resulted in a relative amount of service of roughly 91% in phase 3.

3.1.4.3 RET
RET reduced their bus services on the 23rd of March, where all lines, which total to 35 lines, had
either 2 or 3 busses per hour. Quickly thereafter on the 30th of March they made some slight
adjustments to that reduction (RET, 2020 -c), resulting in approximately 68% of the service compared
to the normal timetable, throughout most of phase 1. They made no changes to the timetable in
phase 2 and 3.

3.1.4.4 Summary Busses
In figure 5 a brief summary of the result for metro companies can be seen.

 Bus
 100
 90
 80
 70
 % service left

 60
 50 RET Bus
 40
 GVB Bus
 30
 20 HTM Bus
 10
 0
 27/02 19/03 09/04 30/04 21/05
 Date (dd/mm)

Figure 5: Relative amount of service of considered bus companies.

Not much stands out in figure 5. HTM had a greater reduction of their services in phase 1 and 2.
However, they also have the least amount of city bus lines from the three analysed companies.

 15
3.1.5 Summary all modes of transport
 Arriva (Train)
 All modes of transport
 NS (Train)
 100
 RET (Tram)
 90

 80 GVB (Tram)

 70 HTM (Tram)
% service left

 60 Qbuzz (Tram)
 50
 RET Metro
 40
 GVB Metro
 30
 RET Bus
 20

 10 GVB Bus

 0 HTM Bus
 27/02 19/03 09/04 30/04 21/05
 Date (dd/mm) Relative amount of check-ins
 compared to 2019 referencedays

 Figure 6: Relative amount of services of all companies and the relative amount of passengers compared to 2019
 referencedays.

 Included in figure 6 are the relative amount of check-ins compared to 2019 reference days, which
 were adjusted to match 2020 weekends and holidays (Translink, 2020). Note that the check-in data
 starts from the 9th of March and not from the 27th of February, like the rest of the graph. As can be
 seen in the graph the relative amount of service from all companies and all modes of transport
 stayed above the relative amount in total passengers for all phases. This indicates that there was
 always sufficient service for the demand on average, however it is not for certain that this is the case
 for every mode of transport and company individually, as it is unknown what the passenger demand
 was per company and mode of transport. The one exception was the tram service by Qbuzz, however
 as mentioned in section 2.1.2.5, the sample size for the tram service by Qbuzz is the smallest, being
 only three lines.

 3.2 Measures
 Within OV-NL all measures were taken in accordance with all public transport companies in the
 Netherlands and the Nationaal Openbaar Vervoer Beraad (NOVB). The measures were discussed with
 all directors of all companies and government officials, in meetings where the secretary of state was
 the chairman. The companies have said from the beginning that they are no experts on the virus and
 thus will follow advise from experts and the Outbreak Management Team (OMT) when taking
 measures. The companies worked together on the measures with the aim to make all measures
 unambiguous between different companies, all sending a similar message to their passengers. This
 collaboration between the companies was not only on directorial level, but also on a
 communicational and logistic level. Logistic level meaning how is it going with absenteeism,
 measures and buitengewoon opsporingsambtenaren (boa’s) (Peters, P., interview, 2020).

 16
Phase 1
 • Conductors no longer walked around and checked tickets in trains, trams and metro’s (NS,
 2020 -f).
 ➢ This measure is to prevent contact between employees and passengers
 • The door by the driver was no longer used in any vehicles.
 ➢ This measure is to avoid contact with the driver, for busses this meant that only the
 back door could be used to get on or off the bus. Public transport companies were
 not happy with this measure, however it was deemed necessary for protection of the
 bus driver. The companies started development of a screen to protect the bus driver
 and allow the front door to be used again, however due to many complications,
 including traffic safety regulations, this screen has yet to be completed (Peters, P.,
 interview, 2020)
 • The front row of seats was not available in busses
 ➢ This measure is to avoid contact with the bus driver
 • The doors on metro’s and trams opened automatically always
 ➢ Avoid physical contact with the push button. The doors on busses are opened by the
 driver and were opened by the driver, before the virus outbreak.
 • Closing of physical ticket sales by the driver.
 ➢ This measure is to limit contact between employees and passengers and is only
 applicable to trams and busses, because in metro’s or trains the driver never sold
 tickets in the first place.
 • Only use public transport if absolutely necessary
 ➢ This measures is to prevent overcrowding in public transport.

The one and a half meter distance rules had to be obeyed by the entire country. For public transport
this meant that people should not sit close to each other and give enough space when passing.
People had to keep more distance and couldn’t get on or off the vehicle together. Consequently the
stopping times increased, mainly for trams and busses, from 30 seconds to 2 minutes, according to a
calculation by Goudappel Coffeng (2020).

Phase 2 and 3
 • In phase 2 and 3 there were no changes to the previous measures and all remained in effect.

Phase 4
 • In phase 4, the wearing of face masks became mandatory in public transport. Not wearing a
 face mask could result in a €95,- fine (Rijksoverheid, 2020 -d).
 ➢ This measures was found necessary to reduce the spreading of the virus, while
 allowing more usage of public transport. The public transport companies would’ve
 liked to see medical face masks for their employees, Pedro stated during the
 interview, but understand that healthcare workers were prioritized.

The Dutch government promised public the transport companies full compensation for any
additional costs made due to taking measures and for the loss of income. Therefore, costs did not
play a role in taking the measures. Companies hope that all measure can be lifted after the virus has
left society, excluding the potential screen for the bus driver. The screen can also increase the safety
of the bus driver and help with incidents after the pandemic (Peters, P., interview, 2020).

 17
3.3 Foreign measures
The foreign measures consist of an overview of the different measures taken in different countries
per April 27, found in the response to a survey sent out by the UITP. Besides this overview, three
world map were made with visualisations of the measures taken on: Stay at home requirements
(Lockdown), the closing of public transport and the mandatory usage of face masks.

3.3.1 Different measures
The UITP has 100 members, of which 49 responded to their survey (UITP, 2020 -a). Some countries
responded more elaborate than others. Similar measures were counted in each countries response,
summarized in figure 7. Appendix D contains a list of all countries that responded and which
measures where mentioned in their response. Also included is the stay-at-home requirement
according to the government response tracker (Blavatnik School of Government, University of
Oxford, 2020), more about that requirement can be read in section 3.3.2.1 of this report.

 30
 25 Measures taken in 49 countries per April 27
 25
 20
 20
 15
 10 6 6 5 4 4
 5 3 2 2
 1 1 1 1
 0
 Measures taken
 General Measures: cleaning vehicles, social distance, isolation if showing symptoms, sneeze in arm
 Adapted schedule, reducing services
 Temperature checks for everybody
 Face masks obligated for everybody
 Complete Shutdown of all public transport
 Amount of seats limited inside the vehicle
 Lock the front door of PT vehicles or block the way to the driver
 Only essential workers allowed on PT, they have to carry proof
 Temperature checks for staff only
 Face masks obligated for staff only
 Use of an app to track proximity with others
 No cases of the virus
 No information on measures as of yet
 No measures taken

Figure 7: Measures taken 49 countries per April 27

It has to be noted that a complete shutdown of all public transport automatically implies that no
other measures were taken in that country. For face masks and temperature checks: when they are
obligated for everybody, this includes the staff as well. Due to the previously stated origin of the
data, not much thought should be put into the numbers, rather more attention should be paid to the
different measures. Interestingly, some measures were taken in other countries that were not taken
in the Netherlands, like temperature checks or the use of an app. And while the Dutch government
encouraged people to only use public transport if absolutely necessary, it was never obligated to
carry proof.

 18
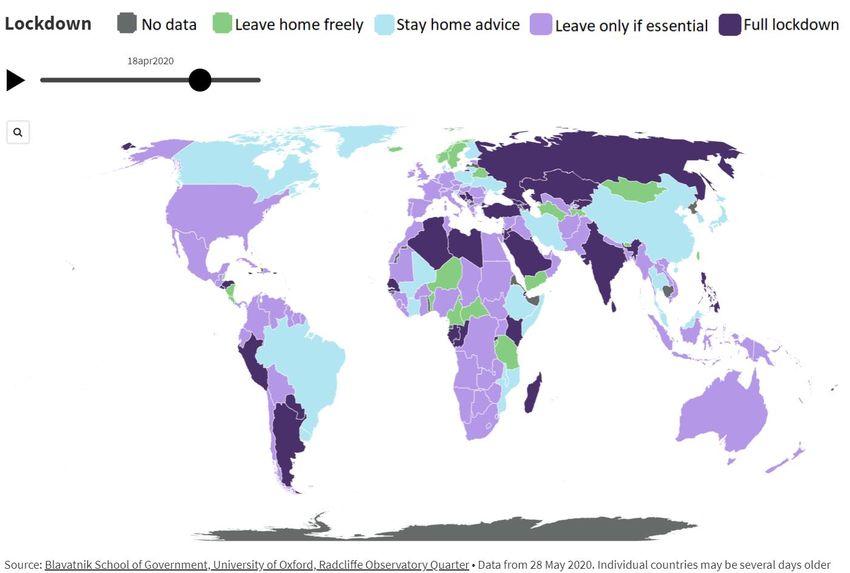
3.3.2 World map
3.3.2.1 Lockdown

Figure 8: Screenshot of the world map visualisation 'Lockdown' on the 18th of April.

Figure 8 shows the lockdown world map on the 18th of April. The 18th of April was chosen, as this day
was the peak in worldwide lockdowns. The legend contains 5 categories, including the ‘No data’
category. The categories were predetermined by the data source (GitHub, 2020), thus the definitions
are defined by the source as well. These definitions are stated in table 4.

Table 4: Overview of used terms in legend and underlying meaning of the stay-at-home data.

 Index Legend label Oxford definition (GitHub, 2020)
 -1 No data Blank
 0 Leave home freely No measures
 1 Stay home advice Recommend not leaving house
 2 Leave only if Require not leaving house with exceptions for daily exercise, grocery
 essential shopping and ‘essential’ trips
 3 Full lockdown Require not leaving house with minimal exceptions (eg. only allowed
 to leave once a week, or only one person can leave at a time, etc.)
The labels were chosen so that they fit nicely above the map. Also, ‘No measures’ might give a false
indication of what is actually meant, namely no measures with respect to stay-at-home advice. But
measures certainly could be in effect, just no stay-at-home measures.

The full visualisation can be found here: https://www.youtube.com/watch?v=k3qvQXZQrB0. All
visualisations were made with software from Flourish (Flourish, 2020). In the visualisation it can be
seen that China and Asia in general were first to enter lockdown, after some time Europe, North- and
South-America followed, and then, a bit later Africa and Australia entered lockdown as well.

 19
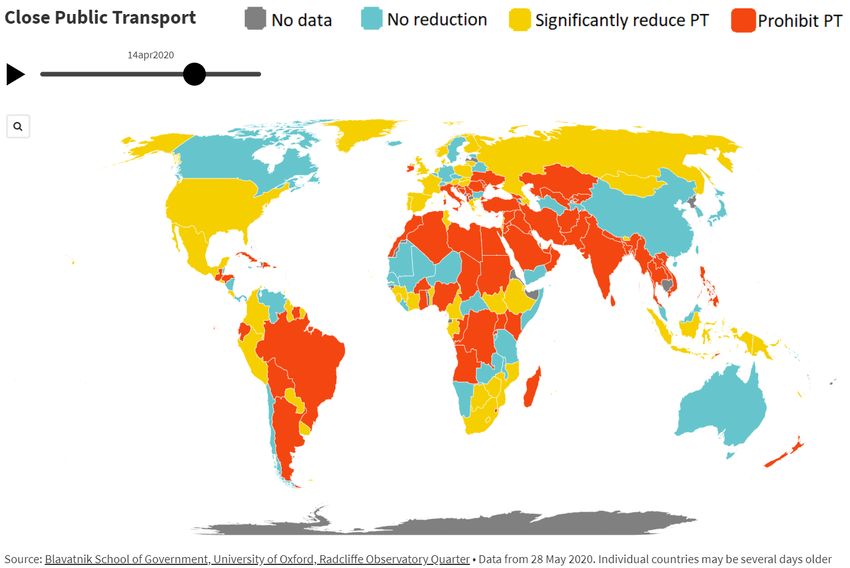
3.3.2.2 Close Public Transport

Figure 9: Screenshot of the world map visualisation 'Close Public Transport' on the 14th of April.

Figure 9 shows the ‘Close Public Transport’ visualisation on the 14th of April. This date was chosen,
because the 14th of April had the most closing measures worldwide. As this visualisation was also
made with the data from the Oxford Government Response Tracker, the definitions are from Oxford
as well, these can be found in table 5.

Table 5: Overview of used terms in legend and underlying meaning of the Close Public Transport data.

 Index Legend label Oxford definition (GitHub, 2020)
 -1 No data Blank
 0 No reduction No measures
 1 Significantly reduce PT Recommend closing (or significantly reduce
 volume/route/means of transport available)
 2 Prohibit PT Require closing (or prohibit most citizens from using it)
Once again, the legend was made to fit nicely above the map. ‘No measures’ was changed to ‘No
reduction’ as ‘No measures’ might be misleading, governments had certainly taken measures, just no
measures with respect to the closing or reduction of public transport. One thing to note with this
visualisation is that there are major differences between countries when It comes to how advanced
public transport (network) is. This might’ve played a role in the decision making of governments.

The full visualisation can be found here: https://www.youtube.com/watch?v=dA2eDdFVwqs&t=70s.
From this it can be seen that the general pattern is similar to the lockdown visualisation, but that
there is more randomness. Especially in Europe, multiple countries didn’t reduce public transport, or
only did so briefly, even when countries demanded their citizens to only leave their home for
essential trips.

 20
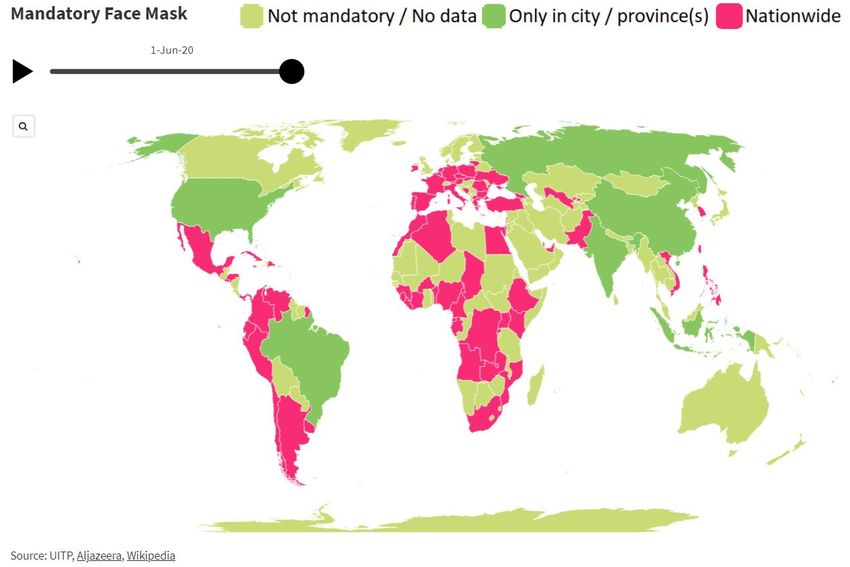
3.3.2.3 Mandatory Face masks in public transport

Figure 10: Screenshot of visualisation ‘Mandatory Face Mask’, June 1 (UITP, 2020 -c) (Aljazeera, 2020)(Wikipedia, 2020).

The 1st of June was chosen for the date of the visualisation in figure 10, because on this date the
most countries made face masks mandatory. Table 6 shows the meaning of labels in the legend. The
visualisation can be found here: https://www.youtube.com/watch?v=wUOSeEuX-E8.

Table 6: Overview of the used terms in the legend and their meaning.

 Index Legend label Meaning
 0 Not mandatory / No data Face masks are not mandatory or no data is available
 1 Only in city / province(s) Face masks are mandatory in PT, only in one or some cities or
 province(s)
 2 Nationwide Mandatory face masks in PT in the entire country
Not mandatory and no data were put into one category, because it was impossible to research every
country in the world to make sure face masks were not mandatory. On the contrary, when face
masks are mandatory, this information can more easily be found.

Mandatory face masks actually means mandatory mouth coverings, as there are some countries
where covering the face with, for example, a scarf was also allowed. Moreover, it has to be noted
that although governments made face masks mandatory, this didn’t mean people always wore them.
Sometimes due to masks being unavailable, sometimes due to a lack of enforcement of the rules.

It also has to be noted that in certain central Asian countries, like Saudi Arabia or Afghanistan, the
wearing of face coverings amongst women was already commonplace before the coronavirus. In line
with the previous note is that in some Asian countries, like China, Japan and Malaysia the wearing of
facemasks was already commonplace before the coronavirus. In for example Japan, the government
didn’t have to make the wearing of face masks compulsory, as the general public already was
wearing masks in (busy) public places.

 21
4. Discussion
The limitations of the research are presented throughout the report. This chapter will provide an
overview of the most important discussion points from the report.

Timetables
As stated prior, in section 2.1.2, the calculated relative amount of service does not accurately
represent the relative amount of service. This is due to the fact that the length of the lines and the
amount of stops were not taken into account. It is believed that by applying the same method to
every company, these errors should not play a huge role. Besides that, also not all details about the
service are known, some companies could have not made all information about the changes to the
timetable public.

A rough estimation of the accuracy on the relative amount of service would be +/- 3%. Due to
previously stated reasons, this accuracy is highly dependent on the absolute amount of services in
the timetable, which in turn comes down to the amount of lines. On the one hand more lines means
a larger sample size, which helps with the accuracy when estimating the amount of service with the
method used. On the other hand, more lines means more possible unknowns and details, which
could in theory accumulate to a large error. However, it is more likely that the errors do not
accumulate, but rather cancel each other, because the details include increased services as well as
decreased services.

Foreign measures
As mentioned in section 3.3.1, from the responses to the survey by the UITP, no objective conclusion
can be drawn, as this data is incomplete. Therefore the choice was made to not use the numbers, but
to limit this part of the research to the different measures.

The maps about the closing of public transport and the lockdown were made using data from the
Blavatnik School of Government and University of Oxford. This data is believed to be reliable. The
data was updated daily by the source providers, the used dataset was last updated on the 10th of
June, cut-off at the 1st of June for the maps.

The map about the face masks, however, was made with data from multiple sources. Major data
providers were the UITP, Aljazeera and Wikipedia. When a country makes the use of masks
mandatory, this will be known to the public and have a high probability of being reported and found
through the online research. However, when a country doesn’t make the use of masks mandatory
and maybe only recommends them, this has a lower probability of being found. Therefore the
categories in the map were chosen binary, either mandatory use of masks or not. The research was
very thorough, but some countries might have still been missed, and especially with the dates there
are some inconsistencies between different sources. On top of that, some countries have even
different dates within them, as provinces (or states) are able to make their own choices and make
masks mandatory or not. When this was the case, the date where the first province or city made
masks mandatory was used.

 22
5. Conclusion
This chapter contains the conclusion to the research. The conclusion to this research will be an
answer to the research question: How was public transport organized during the COVID-19
pandemic?

In the Netherlands

During the COIVD-19 pandemic, public transport companies made changes to their timetable. They
reduced their service, mainly to make up for the large decrease in passenger amounts. The changes
in relative amounts of service are very similar between the companies and modes of transport. From
figure 6 it can be seen that the relative amount of passengers was below the relative amount of
service for all phases for all companies. Only Qbuzz’ tram service forms an exception. This exception
is explained in more detail in chapter 4: Discussion.

Many measures were taken to reduce the spreading of the virus. Most interestingly, all companies
cooperated and took the same measures. The decisions were made in meetings where government
parties and healthcare experts were present. Some of the measures include: automatic opening of
doors, wearing of face masks and measures to avoid contact with the driver.

Internationally

In other countries some different measures were taken than in the Netherlands, including
temperature checks, the use of an app to track proximity to others and the obligation to carry proof
of an essential trip when using public transport. There are also countries where public transport was
completely shut down.

On the visualisations behind figures 8, 9 and 10 it can be seen that the lockdown measures and the
measures on the closing of public transport follow a similar pattern. From East-Asia to Europe, North-
and South-America and finally to Australia and Africa. Interestingly, the visualisation behind figure
10, about the mandatory use of face masks, shows a very different pattern. There, after China,
South-America, Eastern Europe and some countries in Africa are the first to make face masks
mandatory.

 23
You can also read