Livestock, Dairy, and Poultry Outlook - USDA ERS
←
→
Page content transcription
If your browser does not render page correctly, please read the page content below
Economic Research Service | Situation and Outlook Report

                             Economic Research Service | Situation and Outlook Report

                             LDP-M-323 | May 18, 2021                            Next release is June 16, 2021

Livestock, Dairy, and Poultry Outlook
Modest 2022 Production Changes Forecast for Animal
Proteins
Total red meat and poultry production is forecast to increase by less than 1 percent in 2022 compared
with 2021. Beef production in 2022 is expected to decrease about 2 percent as drought conditions
quicken the pace of cattle slaughter in second-half 2021, likely reducing cattle supplies in 2022. Pork
production is forecast to increase about 1 percent as hog producers are expected to respond to
favorable 2021 returns and anticipated continued-strong pork demand from economic expansion next
year. Lamb and mutton production in 2022 is expected to decline 3 percent, in line with recent trends.
While strong consumer demand is expected to drive both broiler and turkey demand next year, higher
feed costs are likely to constrain production growth in both sectors to about 1 percent. Egg production
is forecast to increase by more than 1 percent—driven by consumer demand in an expanding U.S.
economy—but to be constrained by feed costs. Milk production is expected to increase by about 1
percent as higher expected yield per cow more than offsets lower expected milk cow numbers.

2022 production forecasts compared with 2021: year-over-year percent changes

   2
 1.5                                                                      1.4
                          1.1                          1.2       1.1                  1.1
   1
 0.5
   0
-0.5                      Pork                       Broilers   Turkey   Eggs        Dairy
  -1
-1.5
  -2
           -2.0
-2.5
           Beef
  -3
                                        -3.0
-3.5
                                    Lamb and Mutton

Source: USDA, World Agricultural Supply and Demand Estimates.

                                                            1
                            Livestock, Dairy, and Poultry Outlook, LDP-M-323, May 18, 2021
                                          USDA, Economic Research Service

   Approved by USDA’s World Agricultural Outlook Board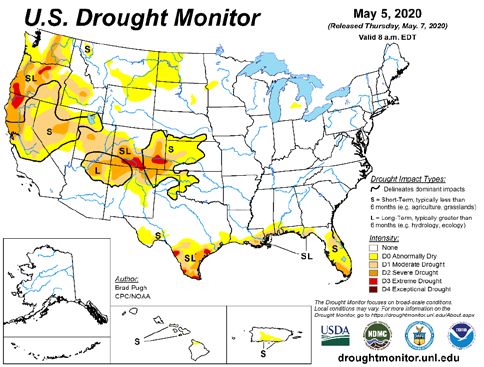
Beef/Cattle: Drought conditions are causing deteriorating pasture conditions and increasing feed costs
for producers. The pace of cattle slaughter is expected to rise in 2021, and the 2021 beef production
forecast was raised 260 million pounds to 27.9 billion pounds. To the extent drought conditions and
increasing feed prices quicken the pace of cattle placements and marketings in 2021, cattle supplies
will be lower in 2022, implying a lower-year-over year forecast for 2022 beef production of 27.3 billion
pounds. Fed cattle prices in 2021 are about unchanged from last month at $116.30 per hundredweight
(cwt), but strong beef demand and tighter cattle supplies in 2022 are expected to lift prices 5 percent to
$122.00 per cwt. The 2021 forecast for beef imports is 2.961 billion pounds, and 2022 imports are
forecast at 2.950 billion pounds. The forecast for 2021 beef exports is 3.227 billion pounds, and exports
in 2022 are forecast at 3.225 billion pounds.

Lamb/Sheep/Mutton: Lamb price and lamb-mutton production forecasts for the rest of 2021 have been
increased because of higher-than-expected prices and production in the early weeks of the second
quarter of 2021. Lamb imports for the first quarter of 2021 were well below forecasts, leading to lower
forecast imports for the second quarter of 2021.

Dairy: The milk production forecast for 2021 has been raised due to higher expected milk cow numbers
for the year. In 2022, milk production is expected to increase modestly as higher milk per cow is
expected to more than offset lower milk cow numbers. The 2021 export forecast has been raised on a
milk-fat basis but lowered on a skim-solids basis. In 2022, exports are expected to decrease on a milk-
fat basis but increase on a skim-solids basis. Domestic use forecasts for 2021 have been raised on
both the milk-fat and skim-solids bases. In 2022, domestic use is expected to increase modestly over
2021. The all-milk price forecast for 2021 is $18.95 per hundredweight (cwt), $0.55 higher than last
month’s forecast. The all-milk price forecast for 2022 is 18.50 per cwt.

Pork/Hogs: Seasonally declining numbers of market hogs and continued-strong pork demand are likely
to support second-quarter hog prices. Hog prices are forecast to remain year-over-year higher through
the end of 2021, supported also by post-pandemic economic growth and continued-low pork cold
stocks. Moderate pork production is forecast for 2022: 28.5 billion pounds, about 1 percent higher than
expected production this year. March pork exports were 729 million pounds, almost 4 percent higher
than a year ago, on strong demand in major foreign markets. Exports this year are expected to be 7.4
billion pounds, about 2 percent higher than last year. For 2022, exports are forecast at about the same
volume as anticipated in 2021.

Poultry/Eggs: Broiler production forecasts are unchanged in 2021 and forecast to increase by 1
percent in 2022. Broiler exports were adjusted up in the second quarter of 2021. Exports are expected
to increase in 2022 by 1 percent, the same rate of growth as production. Quarterly broiler prices were
adjusted up in 2021, reflecting recent price data and strong demand. With rising feed costs expected to
dampen production growth, prices are expected to stay high in 2022; both 2021 and 2022 average
prices are forecast at 93 cents per pound. Turkey production was adjusted down in the second and
third quarters of 2021, reflecting recent hatchery data. In 2022, turkey production is expected to
increase by 1 percent over 2021. Turkey exports were adjusted down in 2021. Exports are expected to
increase in 2022, reflecting expected production increases. The average turkey price forecast in 2021
was adjusted up by 2 cents to 114 cents per pound. In 2022, the annual average price is forecast at
116 cents per pound. The 2021 average egg price forecast was revised up to 112.5 cents per dozen,
and the 2021 total egg production was revised down to 9.3 billion dozen following expectations of
higher feed costs. The current year’s exports of eggs and egg products were revised up based on
higher-than-expected shipments during the first quarter. Relative to 2021, the 2022 forecasts include a
1.4-percent increase in total egg production, a 2-percent increase in average egg price, and a 3.6-
percent decrease in export levels.
                                                      2
                      Livestock, Dairy, and Poultry Outlook, LDP-M-323, May 18, 2021
                                    USDA, Economic Research Service
Beef/Cattle
Russell Knight and Christopher Davis
Producers Face Elevated Drought Conditions and Feed Costs
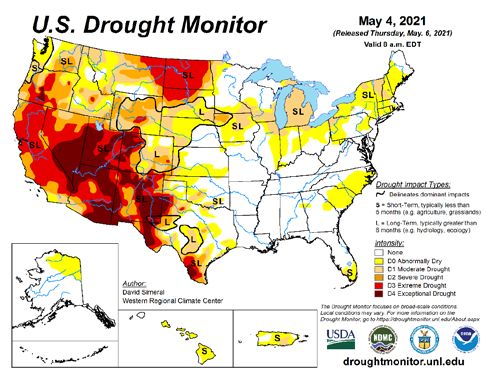
As reported by the U.S. Drought Monitor on May 4, 2021, 66 percent of the country was experiencing
some level of drought, compared to just 31 percent the same week last year (see maps below). Further,
23 percent of the Nation is in the top two worst categories of extreme to exceptional drought, whereas
last year less than 1 percent fell under these designations. This has put 36 percent of the cattle
inventory in an area experiencing drought, and 14 percent of the herd is in the worst two tiers.
Source: U.S. Drought Monitor, www.droughtmonitor.unl.edu.
Furthermore, based on the USDA, National Agricultural Statistics Service (NASS) Crop Progress report
for the week ending May 9, 2021, 44 percent of pastures are in poor to very poor condition compared to
just 16 percent for the same week last year.
These effects on pastures have likely led to greater hay usage and, consequently, to higher hay prices.
According to the latest USDA, NASS Crop Production report, hay stocks on farms on May 1, 2021,
were lower by 12 percent from last year. Although stocks are 21 percent above May 1, 2019, levels,
they are below the 5-year and 10-year averages for the same period.
Based on elevated drought levels, poor pasture conditions, and higher hay and feed costs than a year
ago, it is expected that the pace of placements in feedlots in 2021 will be quicker than was expected
last month, which may result in lower year-over-year placements in 2022. Further, if pastures do not
develop as the year progresses, the pace of slaughter for breeding stock is likely to increase in 2021,
lowering expectations for the beef cow inventory on January 1, 2022.
3
Livestock, Dairy, and Poultry Outlook, LDP-M-323, May 18, 2021
USDA, Economic Research ServicePace of Slaughter Constraining Beef Supplies
In first-quarter 2021, the beef industry was faced with greater volumes of market-ready fed cattle 1
compared to recent years (see chart below), a result of greater year-over-year placements in second-
half 2020 and a packing industry that is struggling to process the cattle in a timely manner.
Consequently, maximum weekday volumes of federally inspected (FI) fed cattle slaughter were 2,000-
3,000 below pre-pandemic levels. However, the average weekday slaughter volume in first-quarter
2021 (see chart below) was about 5,000 head below last year and over 1,000 head below 2019, which
suggests that fed cattle slaughter was about 25,000 head fewer per week. However, packers largely
made up for the limitation through increased Saturday slaughter levels that average about 21,000 head
more than 2020 and about 30,000 head more than in 2019. As a result, on April 1, 2021, feedlots had
11 percent more cattle on feed over 150 days than last year and about 1 percent more than in 2019.
Cattle on feed over 150 days on the first of the month
Percent
2019 2020 2021 2015-19
29
28
27
26
25
24
23
22
21
20
19
18
17
16
15
14
13
12
Jan Feb Mar Apr May Jun Jul Aug Sep Oct Nov Dec
Source: USDA, Economic Research Service calculations using USDA, National Agricultural Statistics Service data.
Packers appear unable to increase weekday slaughter levels to process the market-ready supply in a
timely manner as the sector enters a period of typically higher fed cattle slaughter. This appears to be
in part due to labor disruptions that packers have dealt with since the beginning of the pandemic, but
also interruptions in slaughter due to extreme weather in February and scheduled plant maintenance
events. Because this time period spans the peak of the pandemic’s impact on packing plants, it is
necessary to make comparisons to 2019 statistics to appreciate the changes. In the first 6 weeks of
second-quarter 2021, average weekday slaughter levels, as suggested in the chart below, have fallen
to about 3,000-4,000 head below 2019, and Saturday kills are just 5,000 head above 2019. As a result,
thus far in second-quarter 2021, packers are processing about 10,000-15,000 head fewer a week than
in 2019.
1
Fed cattle consist mainly of steers and heifers marketed from feedlots for slaughter.
4
Livestock, Dairy, and Poultry Outlook, LDP-M-323, May 18, 2021
USDA, Economic Research ServiceAverage weekday FI steer and heifer slaughter in 2019-2021
Thousand head 2019 2020 2021 2015-19
102
100
98
96
94
92
90
88
86
84
82
80
78
76
74
72
70
68 Weekday averages
66 in Q1 for each year
64
62
60
58
56
1 3 5 7 9 11 13 15 17 19 21 23 25 27 29 31 33 35 37 39 41 43 45 47 49 51
Week number
Note: FI = federally inspected.
Source: USDA, Economic Research Service calculations using USDA, Agricultural Marketing Service data.
2021 Production Raised; 2022 Production To Drop First Time in 7
Years
The 2021 beef production forecast was raised to 27.9 billion pounds, a difference of 260 million pounds
from last month. Second-quarter 2021 beef production was raised slightly on higher nonfed cattle 2
slaughter that more than offset anticipated lower fed cattle slaughter due to concerns with packer
capacity. Carcass weights were also adjusted higher as weights have stayed relatively flat in a range of
5 pounds for 8 weeks in a row, even as they should typically begin to fall this time of year.
Second-half 2021 production was raised on higher anticipated fed and nonfed cattle slaughter. A
greater-than-expected number of feeder cattle were placed in first-quarter 2021, raising the expected
pace of fed cattle marketed for slaughter. In second-quarter 2021, poor pasture conditions and higher
feed costs will likely favor a faster pace of cattle entering feedlots, supporting higher fed cattle
marketings in the second half of 2021. Further, in the face of expected tightening forage supplies,
producers will likely increase culling of breeding stock—both cows and bulls—in second-half 2021. The
USDA, AMS report on Federally inspected cattle slaughter by region through the week ending April 24
shows recent elevated cow slaughter levels in the Southwest, Southern Plains, and Midwest.
2
Nonfed cattle pertains to cows and bulls that are marketed by producers for slaughter.
5
Livestock, Dairy, and Poultry Outlook, LDP-M-323, May 18, 2021
USDA, Economic Research ServiceConversely, beef production in 2022 is expected to decline by 2 percent year-over-year to 27.3 billion
pounds, the first drop in beef production in 7 years. This is a result of the quickening pace of fed and
nonfed cattle slaughter leaving fewer supplies of cattle available for slaughter in 2022. However,
carcass weights are expected to increase year over year as nonfed cattle will be a smaller portion of
the slaughter mix.
Fewer Supplies and Robust Beef Demand in 2022 Support Higher
Prices
Weekly fed steer prices rallied in April, topping at about $122 per hundredweight (cwt) (see chart
below), likely in response to the surge in wholesale prices. Wholesale prices have continued to soar
into early May, albeit still below 2020 levels, but fed steer prices have not responded similarly, likely
due to the constraint on beef packing capacity.
Weekly live steer prices for 2019-2021, and the 2021 comprehensive cutout price
Dollar per cwt Dollar per cwt
140 300
135 290
130 280
125 270
120 260
115 250
110 240
105 230
100 220
95 210
90 200
Jan Feb Mar Apr May Jun Jul Aug Sep Oct Nov Dec
2021 Cutout Price 2015-19 2019 2020 2021
Note: cwt = hundredweight.
Source: USDA, Economic Research Service calculations, USDA, Agricultural Marketing Service data.
The second-quarter 2021 fed steer price forecast was raised $1 on current price data, but third-quarter
2021 was lower by $1 because of a greater expected market-ready supply of fed steers at that time.
The 2021 fed steer price is forecast at $116.30 per cwt.
The 2022 outlook for the fed steer price is $122.00 per cwt, a 5-percent increase year over year and the
highest price since 2017. Fewer fed cattle marketings and continued robust beef demand are expected
to bolster prices in 2022.
Regarding 2021 feeder steer prices, feedlots are constrained in their ability to market cattle in a timely
manner; as producers face poor pasture conditions and rising feed costs, they will compete for space in
feedlots in an environment with higher expected feed prices and little optimism for fed cattle prices.
Accordingly, the second-quarter 2021 feeder steer price forecast was lowered $1 on current prices and
the third-quarter 2021 price was dropped $2, for a 2021 annual forecast of $139.30 per cwt.
6
Livestock, Dairy, and Poultry Outlook, LDP-M-323, May 18, 2021
USDA, Economic Research ServiceIn 2022, if forage production reflects normal growing conditions, higher fed cattle prices and fewer cattle
supplies outside feedlots should support improved feeder steer prices year over year, but higher feed
costs are expected to partially offset that support. As a result, the 2022 feeder steer price is forecast to
improve 3 percent above 2020 to $144.00 per cwt.
Cattle Imports and Exports
The U.S. import cattle forecast is lowered by 25,000 head to 1.95 million head in 2021, largely based
on current data on imports from Mexico. The annual forecast for 2022 imports is 2.025 million head due
to tighter expected cattle supplies in the United States. The forecast for exports of cattle is raised by
20,000 head to 380,000 head on larger shipments to Mexico and Canada in 2021. The annual forecast
for 2022 cattle exports is 350,000 head.
Beef Imports Up in March but Down in 2021 First Quarter and
Remain Relatively Flat in 2022
Beef imports in March totaled 273 million pounds, down 8.6 percent (25.8 million pounds), compared to
a year ago. This decrease was fueled by low shipments from Oceania (Australia and New Zealand).
For Australia, beef exports continue to be limited as inventories have been drawn down by drought the
prior year and more heifers and cows are being held back for breeding. Imports from Australia have
been down year over year since October 2020. In March, imports from Australia were the second-
lowest volume of beef to the United States since it started herd rebuilding in 2020. Shipments from New
Zealand were also lower in March relative to a year earlier, for several reasons. First, tighter supplies—
a result of cattle being kept on pasture longer after favorable rainfalls—has reduced exports. Other
competing markets also have pulled beef supplies away from the United States in March. New
Zealand’s beef production has remained relatively steady, and its beef shipments to China, Australia,
and Switzerland have increased by 45, 15, and 16-percent, respectively, year-to-date, while New
Zealand exports to the United States have fallen 7 percent. Imports from Mexico were down year over
year, but the total volume shipped was sizeable, including Mexico’s second-largest import ever in
March.
In contrast, shipments from Brazil registered as the largest volume year over year in March since 2007.
Canada, which is the top U.S. beef supplier, accounting for more than 26 percent of U.S. beef imports
in March, had a modest increase in March.
7
Livestock, Dairy, and Poultry Outlook, LDP-M-323, May 18, 2021
USDA, Economic Research ServiceU.S. year-over-year beef imports from major suppliers
March 2020 March 2021 Difference Year-over- Import Share Import Share
in volume year change March 2020 March 2021
- Million pounds- --- Percent -- --- Percent --
Canada 70.3 71.6 1.3 1.8 23.9 26.2
Australia 56.8 29.8 -27.0 -47.5 17.1 10.9
Mexico 56.8 56.1 -0.7 -1.2 27.8 20.5
New Zealand 63.8 56.0 -7.8 -12.2 15.5 20.5
Brazil 9.2 21.8 12.6 137.0 4.1 8.0
Nicaragua 21.8 18.4 -3.4 -15.6 4.8 6.7
Uruguay 10.3 9.9 -0.4 -3.9 4.4 3.6
Argentina 2.6 3.3 0.7 26.9 1.3 1.2
ROW 7.4 6.2 -1.2 -16.2 2.5 2.3
Total Imports 299.0 273.2 25.8 -8.6 100.0 100.0
ROW = Rest of the World.
Source: USDA, Economic Research Service calculations using data from U.S. Department of Commerce, Bureau of the Census.
Beef imports in the first quarter of 2021 totaled 696 million pounds, down 78 million pounds or 10
percent from a year ago. In 2020, first-quarter imports were the third-largest in volume since 2006,
while annual beef imports were the second-largest on record. Imports from Australia were down 87.3
million pounds in the first quarter and accounted for only 11.7 percent of the U.S. total beef imports in
first 3 months, compared to 21.8 percent in 2020. The chart below shows the percentage share of
imports in 2021 first quarter. Despite the increases in percentage share shown for six of the eight major
U.S. beef suppliers in first quarter-2021, the sum of their exports was not large enough to offset the
reduction in imports from Australia.
U.S. first-quarter share from major beef suppliers
Percentage
2021 Q1 2020 Q1 2015-19 Q1
35
30
25
20
15
10
5
0
Australia Canada New Mexico Brazil Nicaragua Uruguay Argentina ROW
Zealand
ROW= Rest of the World
Source: USDA, Economic Research Service calculations using data from U.S. Department of Commerce, Bureau of
the Census.
The forecast for beef imports in the second and third quarters was raised by 30 and 10 million pounds
from last month’s forecast to 790 and 780 million pounds, respectively. This anticipated increase is
expected to be driven mostly by North and South America. While the fourth-quarter forecast was
unchanged from last month, the annual forecast for 2021 beef imports was raised to 2.961 billion
8
Livestock, Dairy, and Poultry Outlook, LDP-M-323, May 18, 2021
USDA, Economic Research Servicepounds. In 2022, the forecast for the first quarter is relatively flat at 700 million pounds. The annual
forecast for 2022 is also relatively flat at 2.95 billion pounds from last year on depressed cattle
slaughter and limited exportable supplies in Oceania.
Beef Exports Up in March on Robust Shipments to China, but
Forecast in 2022 Is Flat Relative to 2021
In March, the United States exported the most beef (in volume) ever recorded, totaling 300 million
pounds, an increase of 12.3 percent (or 32.9 million pounds) from a year ago. Besides the year-over-
year increase in beef shipments to South Korea, Hong Kong, and Mexico, there was a significant rise in
exports to China. U.S. beef exports there totaled 43.1 million pounds, by far the largest volume the
United States has ever exported to China. Year-to-date, China ranks the third-largest U.S. beef
destination, surpassing both Mexico and Canada. The rise in exports to China reflects, in part, China’s
growing demand for beef and its ongoing challenges with the African swine fever as the country works
to rebuild its swine inventory and industry.
In contrast, beef exports to Japan, the United States’ largest market, were down more than 10 million
pounds or 12 percent from last year. In March, Japan accounted for 25 percent of the U.S. total
exports, notably lower than the 32 percent in March 2020. There were some reductions in shipments to
other major U.S. beef destinations. Shipments of U.S. beef to Canada, which accounted for 7.1 percent
of U.S. beef exports in March 2021, fell 4.0 million pounds year over year. U.S. exports to Taiwan
dropped to 2.5 million pounds lower than a year ago to 15.2 million pounds, the lowest for March since
2017.
U.S. year-over-year beef exports to major destinations
March 2020 March 2021 Difference Year-over- Export Share Export Share
in volume year change March 2020 March 2021
Japan 86.3 75.7 -10.6 -12.3 32.3 25.2
South Korea 61.1 66.6 5.5 9.0 22.9 22.2
China 1.4 43.1 41.7 2900.8 0.5 14.4
Mexico 28.4 28.7 0.3 1.1 10.6 9.6
Canada 25.3 21.3 -4.0 -15.8 9.5 7.1
Taiwan 17.8 15.3 -2.5 -14.0 6.7 5.1
Hong Kong 11.4 14.9 3.5 30.7 4.3 5.0
ROW 35.4 34.5 -0.9 -2.5 13.3 11.5
Total Exports 267.1 300.1 33.0 12.4 100.0 100.0
ROW = Rest of the World.
Source: USDA, Economic Research Service calculations using data from U.S. Department of Commerce,
Bureau of the Census.
First-quarter beef exports totaled 797 million pounds, 3.6 percent larger than last year. The chart below
shows U.S. beef export shares in first-quarter 2021. Japan and South Korea continue to account for the
greatest share of U.S. beef exports. Among major U.S. beef destinations, China’s share increased from
less than 1 percent in March 2020 to over 11 percent in March 2021. South Korea had the second-
largest increase in share of 2 percentage points more than a year ago. The export shares to other
major U.S. beef destinations and the Rest of the World were all lower in 2021 relative to a year earlier.
9
Livestock, Dairy, and Poultry Outlook, LDP-M-323, May 18, 2021
USDA, Economic Research ServiceU.S. first-quarter export share to major beef destinations
Percentage
2021 Q1 2020 Q1 2017-21 Q1
35
30
25
20
15
10
5
0
Japan South China Mexico Canada Taiwan Hong Kong ROW
Korea
ROW = Rest of the Word.
Source: USDA, Economic Research Service calculations using data from U.S. Department of Commerce, Bureau
of the Census.
The forecast for the second and third quarters was increased by 20 and 15 million pounds from last
month to 810 and 825 million pounds on expectations for continued strong exports to China. No
changes were made to the fourth-quarter export forecast from last month. The annual forecast for 2021
beef exports is 3.227 billion pounds. The first-quarter 2022 is forecast to be slightly lower than 2021
due to lower expected cattle slaughter and tighter beef supplies. The 2022 annual forecast for beef
exports is 3.225 billion pounds, flat relative to 2021 due to limited exportable supplies.
10
Livestock, Dairy, and Poultry Outlook, LDP-M-323, May 18, 2021
USDA, Economic Research ServiceLamb, Sheep and Mutton
William F. Hahn
2021 Forecasts Revised, 2022 Forecasts Released
Easter was April 4, 2021, and Ramadan ran from April 12 to May 12, 2021. Both holidays tend to
expand lamb demand, which increases lamb prices and the supply of lamb to meat packers. Both
production and prices in April and early May were higher than expected. Price and production forecasts
are higher in this report than in April’s report. The April 2021 lamb and mutton production forecast was
134 million pounds; the May forecast is 138 million pounds, 3 percent higher.
The April report lamb price forecast was flat for the last three quarters of this year; the forecasts for the
second, third, and fourth quarters were all 161 dollars per hundredweight (cwt). The 2021 second-
quarter forecast is now 176 dollars per cwt. The forecasts for the third and fourth quarters are both 170
dollars per cwt.
Lamb and mutton import data for the first quarter of this year are 68.5 million pounds, much lower than
April’s estimate of 83 million pounds. This month’s forecast of imports for the second quarter of 2021
are 60 million pounds, 8 million pounds lower than forecast in April. This report’s third and fourth
quarter 2021 forecasts are the same as those in the April report.
This report has the first forecasts for 2022: The annual 2022 lamb and mutton forecast is 134 million
pounds, approximately 3 percent lower than the 2021 annual forecast. (Lamb and mutton production
has been trending downward for decades). The lamb price forecast for 2021 is 169 dollars per cwt. The
lamb and mutton import forecast for 2022 is 277 million pounds, 23 million pounds more than the 2021
forecast.
11
Livestock, Dairy, and Poultry Outlook, LDP-M-323, May 18, 2021
USDA, Economic Research ServiceDairy
Jerry Cessna and Angel Teran
Recent Wholesale Dairy Product Prices
From the week ending April 10 to the week ending May 8, all dairy product prices reported in the USDA
National Dairy Products Sales Report (NDPSR) increased. The price of 40-pound blocks of Cheddar
cheese increased 4.2 cents to $1.8248 per pound, and the price of 500-pound barrels (adjusted to 38-
percent moisture) rose 31.5 cents to $1.8267 per pound. Prices for butter, nonfat dry milk (NDM), and
dry whey were $1.8043 (+2.9 cents), $1.2177 (+5.3 cents), and $0.6441 (+3.7 cents) per pound,
respectively.
Dairy wholesale product prices
from USDA National Dairy Products Sales Report (dollars per pound)
For the week ending
April 10 May 8 Change
Butter 1.7750 1.8043 0.0293
Cheddar cheese
40-pound blocks 1.7824 1.8248 0.0424
500-pound barrels * 1.5122 1.8267 0.3145
Nonfat dry milk 1.1646 1.2177 0.0531
Dry
whey 0.6070 0.6441 0.0371
* Adjusted to 38-percent moisture.
Source: USDA, Agricultural Marketing Service, National Dairy Products Sales Report, May 12, 2021.
For the trading week ending March 14, spot prices for Cheddar cheese blocks and barrels traded on
the Chicago Mercantile Exchange (CME) were lower than the most recent NDPSR prices, averaging
$1.7725 and $1.7300 per pound, respectively. CME spot prices for butter and NDM were higher than
the most recent NDPSR prices, averaging $1.8370 and $1.3125 per pound, respectively. The dry whey
price was lower than the most recent NDPSR price, averaging $0.6320 per pound.
Most U.S. wholesale prices of major dairy products have been very competitive with international export
prices in recent weeks. 3 In April, Oceania and Western Europe export prices for butter were $2.61 and
$2.21 per pound, respectively. Skim milk powder (SMP) export prices for Oceania and Western Europe
were $1.55 and $1.39 per pound, respectively. The Oceania export price for cheese was $2.01 per
pound. However, the United States is facing increased price competition in international whey markets,
with the Western Europe export price for April averaging $0.57 per pound.
3
The source for Oceania and Western Europe prices is USDA Dairy Market News. International prices are in U.S.
dollars, free on board (F.O.B.) port. Prices listed in this report are at the midpoints of the ranges.
12
Livestock, Dairy, and Poultry Outlook, LDP-M-323, May 18, 2021
USDA, Economic Research ServiceRecent Dairy Supply and Use Data
According to USDA National Agricultural Statistics Service (NASS), March milk production in the United
States totaled 19.750 billion pounds, 1.8 percent higher than March 2020. Milk cows numbered 9.468
million head in March, 8,000 more than the previous month, and 77,000 head more than March 2020.
Milk per cow averaged 2,086 pounds per head in March, 20 pounds higher than March 2020. For the
first quarter of the year (2021-Q1), U.S. milk production totaled 56.7 billion pounds, up 1.0 percent from
2020-Q1. The average number of milk cows during 2021-Q1 was 9.458 million head, 80,000 head more
than the 2020-Q1. Since June 2020, there has been a notable increase in the number of dairy cows.
Milk cows in the United States
Million head
9.480
9.440
9.400
9.360
9.320
2020 Feb Mar Apr May Jun Jul Aug Sep Oct Nov Dec 2021 Feb Mar
Jan Jan
Source: USDA, National Agricultural Statisics Service.
March dairy exports on a milk-fat milk-equivalent basis totaled 1.014 billion pounds,172 million pounds
above February and 190 million pounds higher than March 2020. On a skim-solids milk-equivalent
basis, March dairy exports totaled 4.811 billion pounds, 864 million above the previous month and 923
million pounds higher than March 2020. Notably, exports of cheese totaled 81.4 million pounds in
March, 14.9 million higher than February and 7.9 million higher than March 2020. Exports of dry skim
products totaled 190.8 million in March, 33.0 million higher than February and 53.3 million higher than
March 2020. Even though the United States faces substantial price competition from foreign
competitors in whey markets, U.S. dry whey exports were robust in March; at 52.7 million pounds, they
were 12.0 million higher than February and 14.4 million higher than March 2020.
In March, imports on a milk-fat basis were 589 million, 265 million pounds higher than the previous
month and 103 million higher than March 2020. On a skim-solids basis, March imports were 560 million
pounds, 189 above February and 59 million pounds higher than March 2020. Notably, in March, butter
imports totaled 10.2 million pounds, 6.7 million pounds higher than February and 6.6 million pounds
above March 2020. In March, imports for other-than-American cheese totaled 23.2 million pounds, 7.0
million pounds higher than the previous month and 4.0 million pounds above March 2020. March
imports of milk protein products 4 totaled 29.4 million pounds, 14.2 higher than February and 8.8 higher
than March 2021.
4
Milk protein products include milk protein concentrate, milk protein isolate, and casein products.
13
Livestock, Dairy, and Poultry Outlook, LDP-M-323, May 18, 2021
USDA, Economic Research ServiceDuring 2021-Q1, daily 5 domestic use of most dairy products increased. On a milk-fat basis, daily
domestic use totaled 586.4 million pounds, 2.8 percent higher than the 2021-Q1. On a skim-solids
basis, 2021-Q1 domestic use was 497.8 million pounds, 1.1 percent higher than 2020-Q1. Daily
domestic uses of cheese, butter, dry skim products, and lactose were higher in 2021-Q1 than 2020-Q1.
Domestic daily use numbers for dry whey and whey protein concentrate (WPC) in 2021-Q1 were lower
than 2020-Q1 of the previous year by 20.1 percent and 17.8 percent, respectively. On a milk-fat basis,
March ending stocks were 18.1 billion pounds, 7.3 percent above March 2020. On a skim-solids basis,
March ending stocks were 11.6 billion pounds, 0.8 percent higher than March 2020.
Daily domestic use of milk and dairy products
2020 2021 Percent
Product Units first quarter first quarter Change change
Milk in all products
Million
Milk-fat basis pounds 570.7 586.4 15.7 2.8
Skim-solids basis 492.4 497.8 5.4 1.1
Dairy products (million pounds)
American type cheese 13.7 14.6 0.9 7.0
Other-than-American type cheese 20.3 20.3 0.1 0.3
Butter Million 5.3 5.6 0.4 7.0
Dry skim milk products pounds 1.8 1.9 0.1 4.7
Dry whey 1.6 1.2 -0.3 -20.1
Whey protein concentrate 0.7 0.6 -0.1 -17.8
Lactose 0.7 0.9 0.2 36.0
Sources: USDA, National Agricultural Statistics Service; USDA, Farm Service Agency; USDA, Foreign Agricultural Service; U.S. Dept. of
Commerce, Bureau of the Census; and USDA, Economic Research Service (ERS) calculations. Numerous sources were used for
conversion factors. For more information, see the ERS Dairy Data Documentation webpage.
Commodity Purchase and Reimbursement Programs in Transition
USDA recently announced that the Farmers to Families Food Box program will sunset at the end of
May. The program was designed to respond to disruptions caused by the global pandemic. For more
information, see the website for the USDA Farmers to Families Food Box Program. Due to recent
Congressional actions, food-insecure Americans now have greater access to an expanded Federal
nutrition safety net, including the Supplemental Nutrition Assistance Program (SNAP); the Special
Supplemental Nutrition Program for Women, Infants, and Children (WIC); the Pandemic Electronic
Benefit Transfer (P-EBT); school and summer meals for children; The Emergency Food Assistance
Program (TEFAP); Commodity Supplemental Food Program (CSFP); and the Food Distribution
Program on Indian Reservations (FDPIR).
On April 13, 2021, USDA provided notice of retroactive reimbursements under the Dairy Donation
Program (DDP). The program, which was established through the Consolidated Appropriations Act of
2021, will facilitate donation of dairy products to nonprofit organizations that distribute food to persons
in need. Regulations for the program have not yet been published. Because the statute allows
retroactive reimbursements before donation and distribution plans are approved, USDA provided
advance notice of the minimum provisions to be included in the program to encourage the dairy
5
We discuss daily domestic use for the first quarter of each year instead of total domestic use since 2020-Q1 had
one more day than 2021-Q1 due to leap year.
14
Livestock, Dairy, and Poultry Outlook, LDP-M-323, May 18, 2021
USDA, Economic Research Serviceindustry to process and donate surplus milk through the spring season. For more information, see the
April 13 notice provided on the USDA AMS website.
Outlook for Feed Prices
The 2020/21 corn price estimate is $4.35 per bushel, and the 2021/22 price projection is $5.70. The
2020/21 soybean meal price estimate is $405 per short ton, and the 2021/22 price projection is $400. 6
For more information, see Feed Outlook, published by USDA, Economic Research Service. The alfalfa
hay price in March was $181 per short ton, $6 higher than February and $9 higher than March 2020.
The 5-State weighted-average price for premium alfalfa hay in March was $210 per short ton, $1 lower
than February but $5 higher than March 2020. The milk-feed ratio in March was 1.75; it has declined
each month since November, when it was 2.56.
Dairy Forecasts for 2021
The U.S. milking herd is projected to average 9.470 million head in 2021, 10,000 head higher than last
month’s forecast. The number of milk cows is expected to trend upward into 2021-Q3 and then decline
in the 2021-Q4 due to relatively high feed prices. Although milk-feed ratios have already fallen from
2020-Q4, dairy operations usually respond to price signals with a lag of several months. The milk per
cow forecast for 2021 is 24,070 pounds, unchanged from last month’s forecast. With the higher
anticipated number of milk cows, the milk production forecast for 2021 has been raised to 227.9 billion
pounds, 0.2 billion higher than last month’s projection.
On a milk-fat basis, the annual dairy export forecast for 2021 is 10.8 billion pounds, 0.1 billion higher
than last month’s forecast, as exports on a milk-fat basis in 2021-Q1 were higher than expected. On a
skim-solids basis, the dairy export projection has been lowered to 49.5 billion pounds, 0.3 billion lower
the last month’s forecast. Although exports of dry skim milk products have been robust, they are
expected to decline in the second half of the year due to stronger price competition from foreign
suppliers.
The 2021 forecast for dairy imports on a milk-fat basis has been increased to 6.2 billion pounds, 0.2
billion pounds higher than last month’s forecast. On a skim-solids basis, the dairy import forecast has
been raised to 5.5 billion pounds, 0.2 billion higher than last month’s projections. Higher imports are
expected for butterfat products, 7 milk protein products, and cheese primarily in the first half of the year.
However, this increase is not expected to be sustained into the second half as retaliatory tariffs on
many dairy products from the European Union and the United Kingdom are scheduled to resume in
early July. 8
Domestic commercial use in 2021-Q1 was stronger than expected, by 0.2 billion pounds on a milk-fat
basis and by 0.5 billion on a skim-solids basis. Due to recent data for domestic use, expectations of
fewer pandemic-related restrictions, and increasing foodservice expenditures, forecasts for 2021
domestic use have been raised to 222.8 billion on a milk-fat basis (+0.3 billion) and 183.2 billion pounds
6
The marketing year begins September 1 for corn and October 1 for soybean meal.
7
Butterfat products include butter, anhydrous milkfat, butteroil, and spreads with high milk-fat content.
8
In March, the United States announced a 4-month suspension of tariffs related to a dispute involving large
civilian aircraft. Several dairy products from various EU countries and the United Kingdom had been assessed the
retaliatory tariffs.
15
Livestock, Dairy, and Poultry Outlook, LDP-M-323, May 18, 2021
USDA, Economic Research Serviceon a skim-solids basis (+0.7 billion). The forecasts for ending stocks have been lowered to 15.0 billion
pounds on a milk-fat basis (-0.1 billion) and 10.5 billion pounds on a skim-solids basis (-0.1 billion)
With expectations for greater domestic demand, most wholesale dairy product price forecasts for 2021
have been raised. The price forecasts for Cheddar cheese, dry whey, and NDM are $1.740 (+3.0
cents), $0.575 (+5.0 cents), and $1.240 (+8.0 cents) per pound, respectively. The butter price forecast
has been lowered by 2.0 cents to $1.710 per pound. Although butter demand is anticipated to remain
relatively strong, higher milk production is expected to limit upward movements in the butter price.
With higher price forecasts for Cheddar cheese and dry whey, the Class III milk price forecast has been
raised by $0.60 to $17.70 per hundredweight (cwt). The Class IV milk price forecast has also been
raised by $0.60 to $15.75 per cwt, as the higher NDM price forecast more than offsets the lower butter
price projection. The all-milk price forecast for 2021 is $18.95 per cwt, $0.55 higher than last month’s
forecast.
Dairy Forecasts for 2022
Usually, we discuss forecasts compared to projections from the previous month. Since these are the
first USDA projections for 2022, these forecasts are discussed in terms of year-over-year comparisons
with 2021 forecasts.
The U.S. milking herd is projected to average 9.465 million head in 2022, 5,000 less than the 2021
projection. Some contraction is expected due to relatively high feed prices and weaker milk prices. Milk
per cow is projected to average 24,335 per head, a year-over-year increase of 1.1 percent. The milk
production forecast for 2022 is 230.3 billion pounds, 1.1 percent higher than the 2021 projection.
Dairy exports on a milk-fat basis are projected to total 10.3 billion pounds in 2022, 0.5 billion lower than
the forecast for 2021. On a skim-solids basis, exports are projected to total 50.0 billion pounds, 0.5
billion higher than the 2021 projection. With U.S. butter prices expected to become less competitive,
exports of butterfat products are expected to decline year over year. With strong foreign demand and
weaker domestic prices, exports of cheese, dry skim milk products, and whey products are anticipated
to increase year over year.
Dairy imports on a milk-fat basis are projected to total 5.9 billion pounds in 2022, 0.3 billion lower than
2021. On a skim-solids basis, 2022 imports are projected to total 5.4 billion pounds, 0.1 billion lower
than 2021. Imports of cheese and butterfat products are expected to be lower than 2021. The lower
import numbers in 2022 reflect, in part, effects of retaliatory tariffs on some dairy products from the
European Union and the United Kingdom since we assume current Government policies remain in
place.
Domestic use is expected to increase modestly in 2022. The domestic use forecast on a milk-fat basis
is 224.8 billion pounds, an increase of 2.0 billion (0.9 percent) higher than 2021. On a skim-solids basis,
the projection is 184.7 billion pounds, 1.5 billion (0.8 percent) higher. The ending stock forecast for
2022 on a milk-fat basis is 15.0 billion pounds, the same as the end of 2021. On a skim-solids basis,
the ending stock forecast for 2022 is 10.4 billion pounds, a year-over-year decrease of 0.1 billion
pounds.
In 2022, the Cheddar cheese price is projected to fall to $1.715 per pound, 2.5 cents lower than 2021,
as a greater proportion of milk is expected to move into cheese production in 2022. The price of dry
16
Livestock, Dairy, and Poultry Outlook, LDP-M-323, May 18, 2021
USDA, Economic Research Servicewhey is projected to fall to $0.475 per pound (-10.0 cents) due to relatively large cheese production and
competitive pressure from foreign exporters. Foreign price competition is expected to contribute to a
decline in the NDM price to $1.195 (-4.5 cents). The butter price is expected to rise to $1.790 per pound
(+8.0 cents) as demand increases and a smaller proportion of milk fat moves into butter production.
The Class III milk price forecast for 2022 is $16.85 per cwt, $0.85 lower than the projection for 2021.
The Class IV milk price projection for 2022 is $15.70 per cwt, a year-over-year decline of $0.05. The all-
milk price forecast for 2022 is $18.50 per cwt, $0.45 lower than the projection for 2021.
17
Livestock, Dairy, and Poultry Outlook, LDP-M-323, May 18, 2021
USDA, Economic Research ServicePork/Hogs
Mildred Haley
Second-Quarter Hog Prices Supported by Declining Hog Numbers
and Solid Pork Demand
Seasonally declining numbers of market hogs and continued strong demand for pork are expected to
keep hog prices high in the second quarter of 2021. The estimated number of federally inspected hogs
slaughtered in April was about 10.5 million head. While year-over-year comparisons of April 2021
slaughter numbers and prices with those of a year ago are distorted due to COVID-19-related market
turbulence last spring, at least two factors suggested lower numbers of available market hogs in April.
First, the April slaughter number appears consistent with the Quarterly Hogs and Pigs issued by USDA
on March 25 reporting that slaughter-ready weight classes for the second quarter (180 pounds and
over, and 120-179 pounds) were both 3 percent below a year earlier. Negotiated hog prices also
suggested that fewer hogs were available for slaughter in April. While negotiated prices typically trade
at a discount to 51-52 percent lean hog prices, in April negotiated prices averaged $4 per
hundredweight (cwt) higher than 51-52 percent base-cost hog prices. Higher negotiated hog prices
often signal processors’ willingness to bid up hog prices in order to increase animal deliveries to
processing plants.
Weekly hog prices, Iowa-Southern Minnesota-negotiated and 51-52 percent lean base cost, 2020 and 2021
2020: 51-52 percent lean
Dollars per hundredweight 2020: negotiated
130 2021: 51-52 percent lean
120 2021: negotiated
110
100
90
80
70
60
50
40
30
20
1 4 7 10 13 16 19 22 25 28 31 34 37 40 43 46 49 52
Week number
Source: USDA, Agricultural Marketing Service.
Wholesale pork prices continued to signal solid demand for pork products in the first month of the
second quarter. Wholesale pork prices in April averaged $111.17 per cwt, 69 percent above a year
earlier. Almost 70 percent of the $45.37 difference between the wholesale values in April 2021 and
April 2020 are attributable to the ham and belly primals. While most bellies are consumed domestically
(as bacon), exports often account for an important component of ham consumption.
18
Livestock, Dairy, and Poultry Outlook, LDP-M-323, May 18, 2021
USDA, Economic Research ServiceEstimated wholesale pork carcass cutout
Average 2017-2019 2020 2021
Dollars per hundredweight
120
115
110
105
100
95
90
85
80
75
70
65
60
Jan. Feb. Mar. Apr. May Jun. Jul. Aug. Sep. Oct. Nov. Dec.
Source: USDA, Agricultural Marketing Service.
Demand-side factors are expected to support pork demand through the second quarter and likely for
the balance of 2021. Continued reopening of the U.S. economy, with accompanying expansion of
employment and economic opportunities, is likely to drive pork demand, wholesale pork prices, and by
extension, hog prices. Also contributing to hog price strength will likely be continued-low pork stock
levels—USDA reported March pork cold stocks at 6.5 percent below reported February levels and 26.8
percent below a year ago.
Second-quarter pork production is expected to be about 6.7 billion pounds, a forecast mostly
unchanged from last month. Quarterly pork production forecasts for the second through fourth quarters
were adjusted downward slightly, however, to reflect lower average dressed weights due to higher feed
costs. Pork production for 2021 is expected to be about 28.2 million pounds, slightly lower than a year
ago.
Quarterly hog price forecasts, on the other hand, were adjusted upwards to reflect strong processor
demand—even as processor margins deteriorate seasonally—in response to domestic and foreign
demand for pork products. Prices for live equivalent 51-52 percent lean hogs are expected to average
$79 per cwt in the second quarter of 2021, $74 per cwt in the third quarter, and $60 per cwt in the fourth
quarter. For 2021, hog price forecasts average about $67 per cwt, almost 56 percent above prices in
2020.
Pork Production To Increase Moderately in 2022
Pork production in 2022 is expected to increase about 1 percent over forecast 2021 production, to 28.5
billion pounds. With lower third-quarter 2021 farrowing intentions indicated in the March Quarterly Hogs
and Pigs report and expected trend growth in pigs per litter, first-quarter 2022 production is forecast at
about 7 billion pounds, about the same as in first-quarter 2021. Further increases next year derive from
expectations of moderate rises in quarterly farrowings and trend increases in litter rates. Expected
positive producer returns in 2021 help to reset quarterly farrowings in a positive direction next year.
Significant risk factors remain in 2022, however, including high feed costs, new variants of PRRS
(Porcine Reproductive and Respiratory Syndrome), labor supply and utilization in processing plants,
and the potential for increased State regulation of sow housing. Prices of live equivalent 51-52 percent
lean hogs are expected to average about $56 per cwt in 2022, 17 percent lower than the forecast
average price for 2021. First-quarter hog prices are forecast at $58 per cwt, more than 4 percent above
19
Livestock, Dairy, and Poultry Outlook, LDP-M-323, May 18, 2021
USDA, Economic Research Serviceprices in the first quarter of this year. Hog prices, as always, derive from demand for pork products.
Lower 2022 hog prices reflect expectations that pork consumption dynamics will more closely resemble
those established prior to 2020 and will be more consistent with a reopened, post-COVID U.S
economy.
Pork Exports Accelerate In March
U.S. pork exports in March were 729 million pounds, almost 4 percent greater than a year ago.
Shipments to Mexico, Japan, the Philippines, and South and Central America were particularly strong.
While exports to China\Hong Kong were year-over-year lower, they led the list of the 10 largest foreign
destinations for U.S.-exported pork in March. (See table below)
With expectations that higher feed costs and continuing problems with swine diseases will limit
domestic pork production in several major importing countries, forecasts for U.S. pork exports were
increased in the second quarter of 2021 by 75 million pounds to 1.85 billion pounds, and by 50 million
pounds in the third quarter to 1.7 billion pounds. For 2021, total U.S. pork exports are expected to total
about 7.4 billion pounds, almost 2 percent higher than exports last year.
U.S. pork exports: March volumes and first- quarter 2021 volumes
of the 10 largest foreign destinations
Percent Percent
Country
Exports Exports change Exports Exports change
First-quarter First-quarter
March 2020 March 2021 (2021/2020) 2020 2021 (2021/2020)
(Million pounds) (Million pounds) (Million pounds) (Million pounds)
World 702 729 3.9 2,023 1,927 -4.7
China\Hong Kong 196 174 -11 597 461 -23
Mexico 141 149 6 435 423 -3
Japan 114 129 13 322 329 2
Canada 59 55 -8 154 147 -4
South Korea 55 52 -5 157 145 -8
Philippines 7 37 453 17 66 295
Colombia 24 28 16 60 73 22
Australia 23 23 0 81 67 -18
Dominican
14 19
Republic 36 35 51 46
Honduras 12 15 31 27 37 37
Source: USDA, Economic Research Service.
Steady Pork Export Volumes Likely in 2022
Expectations are that U.S. pork exports in 2022 will be about 7.4 billion pounds, almost the same as
this year. Export volumes are likely to be determined by factors similar to those driving foreign demand
for U.S. pork this year, namely swine diseases, economic recovery from the COVID-19 virus, and feed
costs.
20
Livestock, Dairy, and Poultry Outlook, LDP-M-323, May 18, 2021
USDA, Economic Research ServicePoultry
Grace Grossen and Adriana Valcu-Lisman
Broilers in Cold Storage at Record Lows; Production Expected To
Grow in 2022
In March, broiler production totaled 4 billion pounds. This was 3.6 percent above production in March
2020 but a 1-percent year-over-year decrease in production on a per day basis. First-quarter production
totaled 10.884 billion pounds, 3 percent below first-quarter 2020, but reflected an additional slaughter
day in 2020. Low chicken supply is currently being compounded by record-low stocks in cold storage.
Broiler meat in cold storage at the end of March totaled 700 million pounds; November 2014 was the
last time chicken stocks were this low. Chicken wings, which have been in high demand as a takeout
item during the pandemic, are at their lowest level in cold storage since 2012. As the restaurant sector
begins to reopen, in the short term, supplying the growing demand for chicken will be a challenge.
Total broiler meat in cold storage at the end of Chicken wings in cold storage at the end of the
the month 2020 month 2020
2021 2021
Million pounds Million pounds
2018-2020 avg 2018-2020 avg
1000 80
950
70
900
850 60
800 50
750
40
700
650 30
600 20
Source: USDA, National Agricultural Statistics Service.
As hatchery data and preliminary weekly production data remain consistent with expectations,
production forecasts for the outlying quarters of 2021 are unchanged. The 2021 total forecast is 44.764
billion pounds, an increase of less than half-a-percent over the 2020 total. In 2022, broiler production is
forecast to total 45.3 billion pounds, a year-over-year increase of 1 percent over the 2021 forecast.
Despite expectations of firm broiler prices through most of 2021 and into 2021, increased feed costs will
likely dampen the rate of expansion.
Broiler Export Forecast Increased in 2021; Forecast To Grow in
2022
March broiler exports declined less than expected, totaling 661 million pounds. This was a 2.8-percent
decrease from March of 2020. Increases in shipments to Mexico (+9 million pounds), China (+9 million
21
Livestock, Dairy, and Poultry Outlook, LDP-M-323, May 18, 2021
USDA, Economic Research Servicepounds), Cuba(+39 million pounds), Angola (+10 million pounds), and the Philippines (+36 million
pounds) were offset by year-over-year decreases in shipments to Taiwan (-21 million pounds), Vietnam
(-16 million pounds), Georgia (-22 million pounds), and South Africa (-16 million pounds). The first-
quarter total was 1.854 billion pounds, a decrease of less than half-a-percent from the first quarter of
2020. The second-quarter export forecast was increased by 15 million pounds, bringing the 2021 total
forecast to 7.354 billion pounds, a decrease of less than half-a-percent from 2020. In 2022, broiler
exports are forecast to total 7.45 billion pounds, an increase of 1 percent over the 2021 forecast.
U.S. broiler exports: Volume and export share, March 2020 and 2021
Volume (million pounds) Export share (percent)
Change in
Country March 2020 March 2021 March 2020 March 2021
volume
Top 10 largest foreign markets (2020 export volumes)
Mexico 144 153 9 21 23
China 30 39 9 4 6
Taiwan 51 31 -21 8 5
Cuba 34 72 39 5 11
Canada 27 28 1 4 4
Vietnam 33 17 -16 5 3
Guatemala 26 29 3 4 4
Angola 12 21 10 2 3
Georgia 28 6 -22 4 1
Colombia 18 13 -5 3 2
World 680 661 -19 100 100
Additional foreign markets of note
South Africa 33 17 -16 5 3
Philippines 13 48 36 2 7
Source: USDA, Economic Research Service using data from the U.S. Department of Commerce, Bureau of the Census.
Quarterly Broiler Prices Increased on Recent Prices; Slow
Production Growth Expected To Keep Prices High in 2022
In April, national composite wholesale broiler prices averaged 101.5 cents per pound. Weekly prices
reached a high of 105.03 cents per pound in the week ending April 30th and ended the first week of
May at 104.49 cents per pound. The steep price increase is likely a result of many factors, including
slow production, record low supplies in cold storage, and increasing demand as the economy reopens.
Wholesale prices for chicken parts are also climbing. Weekly average chicken drumstick prices at the
end of April and early May were almost 51 cents per pound. The April average price was 48.9 cents per
pound, about 14 cents above the same month in 2019. Wholesale prices for boneless/skinless breasts,
the center of fast-food chicken sandwiches, have also been climbing since the start of 2021. The April
average price was 171.92 cents per pound, 44 cents above the same month in 2019. Chicken wings,
which have been in high demand as takeout food, have been steadily climbing in price since last year.
April was a low point in wholesale wing prices in 2020, but the average price in April 2021 was 291.81
cents per pound, 92 cents above the same month in 2019.
Quarterly whole-bird price forecasts for the remaining quarters of 2021 were increased, reflecting
recent price data, expectations of slowly growing production, and high demand. The second-quarter
price was adjusted up to 105 cents per pound, the third quarter to 94 cents per pound, and the fourth
quarter to 88 cents per pound. The annual average price forecast for 2021 is 92.7 cents per pound, an
increase of 27 percent over the 2020 average. As feed costs are expected to rise, constraining
22
Livestock, Dairy, and Poultry Outlook, LDP-M-323, May 18, 2021
USDA, Economic Research Serviceproduction growth, broiler prices are projected to stay high next year. The annual average price
forecast for 2022 is also 93 cents per pound.
Monthly national composite wholesale whole Monthly wholesale chicken drumstick prices
broiler prices
2019 2020 Cents per pound 2019 2020
Cents per pound 2021 2021
55
110
100 50
90
45
80
70 40
60
35
50
40 30
Monthly wholesale boneless/skinless chicken Monthly wholesale chicken wing prices
breast prices 2019 2020
Cents per pound 2019 2020
2021
Cents per pound 2021
180 350
170
160 300
150
140 250
130
120 200
110
100 150
90
80 100
Source: USDA Agricultural Marketing Service.
Table Egg Production Revised Down
March table egg production was 687.5 million dozen, a slight decrease from March 2019. The table egg
layer flock averaged 326.2 million layers in March, a 1.5-percent year-over-year decrease. March lay
rate reached 82 eggs per 100 layers per day, a slight increase from last year and a record high for
March.
The upstream production indicators mirror the challenges faced by the industry: higher feed costs and a
shifting demand as foodservice activity returns to pre-pandemic levels. The April 1, 2021, data for egg-
type eggs in incubators suggest that producers intend to add fewer birds to the layer flock. Additionally,
March slaughter of light spent hens (slaughter of spent table egg layer hens—one of the methods used
to manage the size of the flock) shows a seasonal uptick reaching a level similar to last March. March
23
Livestock, Dairy, and Poultry Outlook, LDP-M-323, May 18, 2021
USDA, Economic Research Servicedata for egg-type chicks and pullets hatched indicates producers’ intentions to add more layers to the
flock in the near term (see charts). Given the current prospects, the 2021 table egg production forecast
was lowered to 8,071 million dozen, a slight increase from 2020 production levels.
Egg-type eggs in incubators Egg-type chicks hatched
2019 2020 2019 2020
2021 Average 2017-2019
2021 Average 2017-2019
Eggs, thousand Head, thousand
65,000 65,000
60,000 60,000
55,000 55,000
50,000 50,000
45,000 45,000
40,000 40,000
Egg-type pullet chicks hatched Monthly slaughter of light spent hens
2019 2020 2019 2020
2021 Average 2017-2019
2021 Average 2017-2019
Head, thousand Head, thousand
600 4,500
500 4,000
400 3,500
300 3,000
200 2,500
100 2,000
Source: USDA, National Agricultural Statistics Service.
Total (table and hatching) egg production in 2022 is expected to increase by just slightly under 1.5
percent year over year, to 9.5 billion dozen. Expectations for lower exports, stable demand, and a slight
increase in production levels support a forecast for higher egg stocks in 2022. In 2022, per capita
disappearance is expected to be 287.8 eggs per person, a 1-percent increase from the disappearance
forecast for 2021.
Wholesale Table Egg Prices Revised Up
April wholesale table egg prices (New York, Grade A Large) overcame the seasonal Easter-related
higher prices from the prior month and averaged 102.6 cents per dozen, a 43-percent decrease from
last year when prices were affected by COVID-19-related market disruptions. Given the current
24
Livestock, Dairy, and Poultry Outlook, LDP-M-323, May 18, 2021
USDA, Economic Research ServiceYou can also read