How Does Development Aid Impact Trade Performance and Margins? Evidence from China
←
→
Page content transcription
If your browser does not render page correctly, please read the page content below
How Does Development Aid Impact Trade
       Performance and Margins? Evidence from
                       China∗
                 Camelia TURCU†                       Yunzhi ZHANG‡
                                    December 2020

                                          Abstract
             We study the impact of China’s foreign aid on exports at the product
        level. To do this, we use a sample of 159 countries and a trade decomposi-
        tion on 1366 HS4 products over the period 2000-2014. We employ a PPML
        methodology in a gravity framework. We find that the return on Chinese
        exports of every dollar spent on foreign aid is rather small, on average, at the
        HS4 product level, for the whole period. Moreover, we disentangle between
        different categories of international aid and find that the aid related to in-
        frastructure, productive capacity, and other aid categories has positive effects
        on trade. Our results also indicate that the Chinese foreign aid enhances,
        at product level, the trade in new varieties but does not help the country to
        export more of the already traded products. In other words, at product level,
        the trade extensive margins are strengthened, while the intensive margins are
        not. We also find that, at geographical level, aid helps China exporting more
        towards the countries that are already its trade partners (the geographical
        trade intensive margins are boosted), but does not promote trade relations
        with new partners (no effect on the geographical trade extensive margins).

Keywords: Emerging donor, aid-trade nexus, trade margin
JEL classification: F35, P33

   ∗
     We thank Dimitrios Asteriou, Matthieu Bussière, Jarko Fidrmuc, Scott Hegerty, Hen-
drik Kruse, Inmaculada Martinez-Zarzoso, Mihai Mutascu, Isabelle Rabaud, Kiril Tochkov
and Marcel Voia for their helpful comments and suggestions on previous versions of this
paper. All remaining errors are ours.
   †
     University of Orléans - LEO and INFER, Email: camelia.turcu@univ-orleans.fr
   ‡
     Jinan University and University of Orléans - LEO, Email: yunzhi.zhang@hotmail.com

                                               1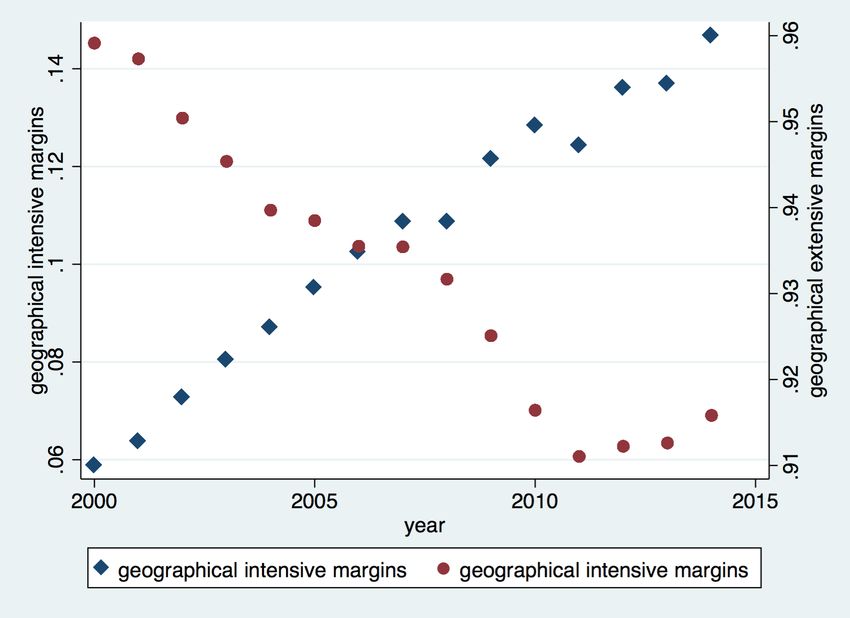
1       Introduction
The link between development aid and trade has been addressed in the literature, espe-
cially from the perspective of traditional donors. Additionally, this linkage is proved to
be positive in the case of traditional donors (e.g. Hühne et al., 2014; Nowak et al., 2009;
Martı́nez-Zarzoso et al., 2017; Hansen et al., 2014). However, this positive relationship
has been recently addressed in the case of “new donors” as well (e.g. Fuchs et al., 2013;
Liu et al., 2017; Turcu and Zhang 2019).1
     From the perspectives of both the donor and the recipient, the link between interna-
tional aid and trade can be explained through different channels. We focus on two channels
in particular that are the most relevant for this research study. First, development aid
transfers income from the donor to recipients, and this will increase the level of local in-
come. This triggers higher consumption and increased demand for foreign products (both
in terms of volume and the number of varieties). Second, aid can also take the form of
direct financial assistance (debt and loan), or it can also be provided in order to enhance
the recipient countries’ infrastructure and productive capacity building. This kind of aid
can support trade openness, improve the trade environment, and overall generate more
trade: this is the second channel.
     In recent years, emerging countries have started to play a proactive role in providing
foreign aid. This can be translated into a new South-South relation. For this reason, more
and more attention has been paid to the case of these new donors, as in Neumayer (2003),
Liu et al. (2017); Turcu and Zhang (2019). These studies confirm the positive impact of
new donors’ foreign aid on countries’ economic performance at the aggregate level.
     The aid-trade nexus can however be examined in more details: (i) it is interesting to
analyze the impact of different categories of aid on trade. By buttressing the case of aid
for trade, Calı́ and te Velde (2011) find that aid provided for infrastructure can enhance
trade by reducing trade cost and transport time; (ii) as mentioned before, aid could help
to develop further donor-recipient relations: this effect can be partially found by analyzing
the impact of aid on trade margins. The analysis of Wang and Xu (2018) confirms that
the different categories of aid can affect the quality of exports for the recipient countries;
(iii) the impact of aid flow on different commodity groups of products can also reflect to
some extent the motive/behaviour of donors; (iv) it would be interesting to assess the
effects of aid on trade margins, both at the product and geographical levels.
     In this paper, we study the trade-aid nexus, with a focus on the case of China. We
take a further step toward the understanding of Chinese foreign aid’s impact on trade by
splitting different categories of aid and dividing trade flows into different types. Moreover,
this study aims to investigate the impact of aid not only on exports at the four-digit Har-
monized Commodity Description and Coding Systems (HS4) product level but also on the
Chinese trade margin. A question that emerges within this framework is the following:
does China gain from trade, following its aid strategy; and in particular, could China
expand and diversify HS exports after providing the international aid? To answer this
question, we employ a Poisson Pseudo Maximum Likelihood (PPML) methodology in a
gravity model using a sample of 159 trading partners and 1366 HS4 products, throughout
the period 2000-2014. We first follow the information of the Creditor Reporting System to
    1
     Developed countries, especially those listed as OECD members, are considered to be
the traditional donors; new donors are usually associated with emerging countries: these
countries used to be recipient countries but have begun to provide foreign aid since the
late nineties.

                                              2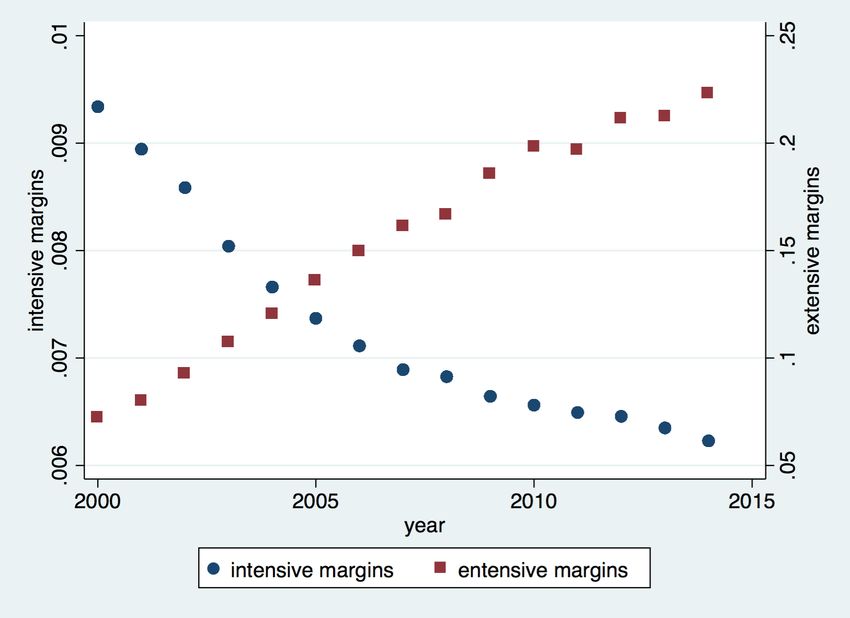
identify the different aid categories (relative to infrastructure, productive capacity, public
welfare and other). We then investigate the details of the trade-aid nexus by underlining
the impact of different aid categories on four commodity groups: capital goods, intermedi-
ate goods, consumer goods, and raw materials. Lastly, we compute and analyze the trade
margins. Our results for the trade margins strengthen our findings related to South-South
relations and highlight that aid can help to increase China’s intensive product and geo-
graphical trade margins.
    The contribution of our work is threefold: (i) it complements the scarce literature on
emerging donors and analyzes aid’s impact on trade, at the product level; (ii) it reveals
that the effects of different aid categories vary across the various groups of products that
we consider; (iii) it augments the literature on the positive impact of aid on trade, for
China’s case, by putting a specific focus on the product and geographical trade margins.
    The remainder of the paper is organised as follows. In Section 2, we review the liter-
ature. The methodology and data are presented in Section 3. The results regarding the
impact of aid on the exports of HS4 products are reported in Section 4. Section 5 provides
in-depth evidence on the results regarding trade margins. Several robustness checks are
developed in Section 6. Section 7 concludes.

2      Literature Review
Several theoretical models are developed in the literature (by Brecher et al., 1982, Djajic
et al., 2004 , among others) to investigate the link between aid and trade performance.
Based on the paradox of immiserizing-transfer by Leontieff (1936), Brecher et al. (1982)
expand the model to include domestic distortions. The model suggests that foreign aid
can impact the welfare of both the donor and the recipient through the terms of trade.
But this results in a paradox, as the donor becomes more richer, immiserizing the recipi-
ent. By taking the example of food aid, they provide evidence that an “import subsidy”
is more efficient than a “consumption subsidy” through terms of trade, and this “import
subsidy” finally benefits both the donor and the recipient. An intertemporal aid model
is developed by Djajic et al. (2004). He finds that, in a first stage, foreign aid transfers
welfare from the donor to the recipient; however, in the second stage, both the donor and
the recipient can benefit from increased welfare.
     At the empirical level, the bulk of literature on the aid-trade nexus investigates the
cases of both traditional donors and emerging donors. Arvin and Baum (1997) use a sam-
ple of 17 OECD countries for the period from 1972 to 1990 and analyze the impact of tied
and untied aid on trade. They employ an intertemporal optimising model, and estimate
its parameters using a nonlinear least squares systems estimator to find that tied aid has
a stronger effect on exports than the untied aid.
     To analyse the effect of aid on trade over the short run and the long run, Martinez-
Zarzoso et al. (2014) use a Feasible GLS methodology with both within and between-
within effects. Their findings show that the short-run return is lower than the long-run
one: the former is set to 0.5 USD for every aid dollar provided while the latter is equal to
2.5 USD.
     Hühne et al. (2014) use pooled regression to explain the impact of foreign aid on
exports and imports. They examine data from 1990 to 2010 and include all recipient and
donor countries listed in the OECD-DAC’s International Development Statistics. Their
findings suggest that Aid for Trade triggers a three percent raise of the recipient’s exports

                                              3
to the donor, and a five percent increase of imports from the donor.
The results for traditional donors are rather heterogeneous. In this case, traditional
donors have been studied at the individual level. Nowak et al. (2009) analyze the case of
Germany as a donor. They show that every euro spent in international assistance can lead
to an increase of exports of 1.49-1.84 euros on average. Martinez-Zarzoso et al. (2017)
conclude that each dollar spent by the Dutch government on foreign assistance increases
by $0.29 USD the exports. The “return” for the case of Denmark is rather small as well:
Hansen et al. (2014) find that for every dollar spent on aid by Denmark, the return on
exports is about 30 cents.
This is also underlined for specific emerging donors: Fuchs et al. (2013), they show
that Indian exports grow by one percent, if aid increases by four percent. The case for
China is analyzed by Liu et al. (2017). They conclude that an one percent increase in
China’s aid flows to Africa leads to a 0.05% rise of this country’s exports towards the
African continent and this export return might be postponed to a later period. Moreover,
Turcu and Zhang (2019) find that the return on Chinese exports of every dollar spent on
foreign aid is around $0.156-$0.400, at the aggregate level.
Some specific elements are underlined by Nunnenkamp and Ohler (2011). They apply
a Tobit model to understand the aims of recipients and donors for the case of German
aid. The estimation is based on the trade relations between Germany and 152 countries
from 2005 to 2007. One of their novel approaches is to analyze donor-recipient relations
by separating the private and public channels. Their findings come from two sides: from
the donor’s side, aid is allocated to those countries with more democratic institution and
less corruption (e.g. Germany); from the recipient countries’ side, BMZ-funded (NGO)
shows stronger financial cooperation. Finally, since the data are not available in the Cred-
itor Reporting System, they stress that this is worth studying the impact of specific aid
channels.
Few studies have focused on the link between aid and economic activities by splitting
aid into different categories. This kind of research is particularly related to aid for trade,
and includes information from OECD’s Creditor Reporting System (CRS).
A pioneering study of the impact of different types of aid on trade is provided by
Wagner (2003). By splitting aid into different categories, he argues that aid for trade
can reduce trading costs between donor and recipient countries. He finds a positive link
between trade and aid: every dollar spent on aid has a direct effect on trade worth 35
cents. However, the indirect effect is even higher, amounting to 98 cents.
Calı̀ and te Velde (2011) further proved that the aid related to specific categories can
reduce trade costs and promote trade. By focusing on the impact of different types and
categories of aid, they apply fixed effects and GMM methodology in a panel of 130 devel-
oping and developed countries over the time span from 2002 to 2007. They find that aid
related to infrastructure has a positive effect on trade while the aid related to productive
capacity has no statistically significant effect.
However, the impact of aid for trade on FDI is also underlined by splitting the aid
categories. Using PPML methodology on a sample including 25 donors and 120 recipient
countries from 2003 to 2013, Lee and Ries (2016) find that aid for trade related to in-
frastructure and building productive capacity contributes most significantly to greenfield
investment. The above studies underline that the impact of aid can be divided into several
channels, and that each of these channels has different effects on economic activities. This
shows the need and the necessity of identifying the different aid categories.
An analysis that not only splits the aid for trade into different channels, but also
divides the trade flows into different commodity groups is developed by Lemi (2017), who
4compares the aid from 20 OECD countries and China to 50 African countries. His finding
shows that the African countries trade more with the OECD countries when the aid from
the latter is related to infrastructure and productive capacity. Besides, aid from OECD
countries has a stronger effect on: Africa’s imports of raw materials, intermediate goods,
consumer goods, and capital goods; and Africa’s exports of raw materials, consumer goods
and capital goods. Furthermore, no statistically significant relationship between aid and
trade has been found for China as a donor and African countries as recipient countries.
Moreover, trade is split into its extensive margin and intensive margin to understand
trade growth. This allows us to have more insight about the factors that can trigger trade
growth. Shi (2011) applies an analogue method to that of Hummels et al. (2005) to
decompose China’s trade with 140 trading partners over the period from 2001 to 2007,
into extensive margin, quality and quantity. He finds that China’s trade growth mainly
generated an increase in quantity.
Little is said concerning the impact of aid on trade margins. To the best of our
knowledge, this relation is developed solely by Wang and Xu (2018). They estimate a
structurally derived equation over the period from 2002 to 2012 and find a strong positive
impact of aid for trade related to specific trade policies on the quality of recipient coun-
tries’ exports. This effect is partially significant for aid related to infrastructure. But no
effect is present when the aid is provided towards expanding productive capacity.
3 Methodology and Data
3.1 Methodology
In order to investigate to what extent Chinese foreign aid could promote China’s exports, a
structural gravity model is employed by following Anderson and van Wincoop (2003) (also
see Head and Mayer, 2014; Yotov et al., 2016; among others). We include data that cover
1366 HS4 product level data for 159 countries over the period from 2000 to 2014 to analyze
the trade-aid nexus using data for China’s detailed HS4 product trade. As the product
data includes a large amount of zero-value flows, we use the Poisson Pseudo Maximum
Likelihood (PPML) estimator for the structural gravity model proposed by Santos Silva
and Tenreyro (2006). This methodology allows us to keep the dependent variable in
levels, and thus, we will not lose the information provided by zero values. Another issue
regarding gravity model is the multilateral resistance (MR) terms (Anderson and van
Wincoop, 2003; Baier and Berstrand 2009). Within this huge dataset, we consider the
MR terms are invariant and control only the HS4-importer-year fixed effects to disentangle
this problem (Liu and Tang 2018 ).
Exportcjt = exp[θ1 ln(Yjt ) + θ2 ln(P opjt ) + θ3 ln(Aidcjt )
+ θ4 ln(W T Ocjt ) + γt + αj + βhs6 ] × εcjt (1)
Where, Exportcjt is China’s bilateral export value at the HS4 product level to trading
partner j in year t; we keep this in levels;
ln(.) denotes the natural logarithm;
ln(Yjt ) represents GDP per capita in current US dollars, in year t for trading partner j ;
ln(P opjt ) is the population in trading partner j in year t;
ln(Aidcjt ) is the aid value in dollars from China to trading partner j in year t;
5W T Ocjt denotes a dummy that equals to 1 if a trading partner j is a WTO member, and
0 otherwise.
γt captures the common trends in China’s exports, αj denotes trading partner fixed effects,
which are also considered to capture the multilateral resistance terms. βhs6 accounts for
heterogeneity among the products, and εcjt is an error term.
3.2 Data
The data cover a sample of 1366 HS4 trading products between China and 159 partners
from 2000 to 2014. The data for China’s foreign aid are taken from the Global Chinese
Official Finance Dataset (Aidcjt ). The aid data relative to different categories are also
drawn from this database (Inf racjt denotes the aid relative to the infrastructure cate-
gory; P rocjt represents the aid related to the productive activity category; P ubjt is the
aid intended for the public welfare category; Otherjt denotes other categories). China’s
bilateral export value at HS6 product level in US dollars is from the BACI database, data
on bilateral trade at the HS4 product level is computed by the authors based on the BACI
dataset (Exportscjt is the export value at the HS4 product level; XCapitalcjt captures
the export value of capital goods at HS4 product level; XConsumercjt denotes the export
value of consumer goods at the HS4 product level; XIntermediatecjt is the export value of
intermediate goods at the HS4 product level; XM aterialscjt represents the export value of
raw materials at the HS4 product level). Furthermore, GDP per capita (Yjt ), population
(P opjt ), WTO members (W T O memjt ) are gravity variables drawn from the Dynamic
Gravity Dataset (Gurevich and Herman, 2018). Table 1.
Table 1: Descriptive statistics
Variable Obs Mean Std. Dev. Min Max
Export 4,068,240 5594.35 132352.6 0 6.37e+07
XCapitalcjt 543,720 16694.88 323438.6 0 6.37e+07
XConsumercjt 1,178,520 6954.2 87786.79 0 1.15e+07
XM aterialscjt 386,400 722.5704 14117.77 0 2091739
XIntermediatecjt 1,363,440 3627.953 61090.55 0 1.64e+07
Aidcjt 4,068,240 2.38e+08 1.46e+09 0 3.63e+10
Inf racjt 4,025,494 1.21e+08 8.52e+08 0 2.50e+10
P rocjt 4,025,494 4.42e+07 4.88e+08 0 1.84e+10
P ubjt 4,025,494 6115432 5.36e+07 0 1.52e+09
Otherjt 4,025,494 6.81e+07 8.28e+08 0 2.70e+10
ln(Aidcjt ) 4,068,240 6.873003 8.65613 0 24.31498
ln(Inf rajt ) 4,025,494 3.60434 7.292723 0 23.94214
ln(P rojt ) 4,025,494 2.211992 5.799772 0 23.63562
ln(P ubjt ) 4,025,494 3.240957 6.172326 0 21.14132
ln(Otherjt ) 4,025,494 2.75865 6.215427 0 24.0191
ln(Yjt ) 3,888,412 8.429192 1.51358 5.268729 11.42512
ln(P opjt ) 3,581,820 2.019565 1.861957 -3.089077 7.166491
W T O memjt ) 4,068,240 .7641304 .4245411 0 1
Robustness
ln(Yct ) 4,068,240 8.117588 .4026251 7.479718 8.717394
ln(P opct ) 4,068,240 7.184934 .0232491 7.146752 7.222154
ln(DIScj ) 4,068,240 8.975956 .5619277 7.244804 9.850392
CONcj 4,068,240 0.0869565 0.2817714 0 1
Agree f ta 4,068,240 0.0576087 0.233002 0 1
HS6 data
HS6Exportcjt 13,983,225 1402430 5.24e+07 0 4.27e+10
ln(Aidjt ) 13,983,225 6.835852 8.647399 0 24.31498
ln(Yjt ) 13,983,225 7.184934 0.0232491 7.146752 7.222154
ln(P opjt ) 13,983,225 29.11528 0.4259994 28.43619 29.75128
W T O memjt ) 13,983,225 0.765045 0.4239707 0 1
64 Results
In order to conduct an in-depth study on the impact of foreign aid on trade, we use the
PPML methodology by controlling for HS4-country-year fixed effects on the structural
gravity model at the HS4 product level. We first study the effects of overall aid on all the
exports of products and different commodity groups (capital goods, intermediate goods,
consumer goods, and materials). This allows us to investigate detailed information on
what type or characteristics of goods that aid could affect. Second, we will adress the aid
heterogeneity at the HS4 product level. To do this, we split the aid into four categories
and,2 in turn, assess the impact of each category on every commodity group of products.
4.1 HS4 Product Exports Level
The results of the impact of foreign aid on Chinese exports at the HS4 product level
obtained by employing the PPML approach that controls for HS4-Country-Year fixed ef-
fects, are presented in Table 2.3 In order to have more detail, the product sample is also
split into four commodity groups of goods. This decomposition information is included
in the database of HS Standard Product Groups, which are drawn from World Integrated
Trade Solution (WITS) dataset in World bank.4 According to this reference, products can
be classified into capital goods, intermediate goods, consumer goods, and materials. For
example, capital goods included tools, machinery and equipment,5 which represent high
value-added products; intermediate goods include producer goods or semi-finished goods,6
which are considered to be part of the global value chain; furthermore, consumer goods
cover the final products that are used in daily life (they are low-technology manufactured
goods); and raw materials are materials and substances that could also be regarded as pri-
mary resources. Based on the aforementioned information, some questions can be raised
for this section: does China provide aid to promote its technology? Or does it do so to
integrate more into the global value chain? Can Chinese foreign aid help the country
to export more consumer goods, which can be a result of income increased in recipient
countries? Since China is a manufacturing hub, we expect positive signs for the exports
of intermediate and consumer goods.
In Table 2, the first column translates the overall estimation: one dollar spent on foreign
aid by the Chinese government increases the value of product level export by 0.00000008
dollars on average.7 The results for the impact of aid on the exports of four commodity
groups of products are shown in columns (2), (3), (4), and (5). The positive aid coeffi-
cients in columns (2) (3) and (4) indicate that China’s foreign aid increases the exports of
capital, intermediate and consumer goods. But the effect on materials is not statistically
significant. All the other control and gravity variables have the expected sign and are
statistically significant overall. First, the GDP per capita in the trading partner posi-
2
Further information on the aid category is provided in the next section.
3
An investigation on the results of HS6 product level is shown in Table 12.
4
https://wits.worldbank.org/referencedata.html
5
e.g. Buckets, shovels, grabs and grips of excavating (HS6: 843141), Refrigerators
(HS6: 841810, 841821, 841822, 841829) and Railway or tramway sleepers (HS6: 440610)
6
e.g. Meat of bovine animals, salted... or smoked(HS6: 021012)
7 ∂X AV (Aidcjt ) ∂X
The static term is calculated as followed: βAid = ∂Aid cjt
∗ AV (X) , thus, ∂Aidcjt
=
AV (X) 5594.35
βAid ∗ AV (Aidcjt ) = 0.0034 ∗ 238000000 = 0.0000000799. Av(.) denotes the means.
7Table 2: PPML estimation at the HS4 product level
(1) (2) (3) (4) (5)
Export XCapital XIntermediate XConsumer XMaterials
lnAidcjt 0.00340*** 0.00327*** 0.00426*** 0.00276*** -0.000576
(0.000469) (0.000872) (0.000601) (0.000753) (0.00350)
lnYjt 1.294*** 1.268*** 1.130*** 1.386*** 0.0654
(0.0453) (0.0948) (0.0541) (0.0644) (0.211)
lnP opjt 2.223*** 2.006*** 2.334*** 2.301*** 1.713***
(0.0682) (0.176) (0.0492) (0.0799) (0.305)
W T Ojt 0.430*** 0.477*** 0.437*** 0.430*** 0.432***
(0.0204) (0.0455) (0.0254) (0.0296) (0.0779)
Country FE yes yes yes yes yes
Year FE yes yes yes yes yes
HS6 FE yes yes yes yes yes
N 2607650 422653 899581 910938 173653
Notes:
(a) Robust standard errors in parentheses
(b) ***, **, and * denote significance at the 1, 5 and 10% level, respectively
(c) Dependent variable: China’s bilateral exports in level at HS4 product level at time t. Capital means
the exports of capital goods; Intermediate means the export of intermediate goods; Consumer means
the export of consumer goods; M aterials means the export of raw material.
tively affects bilateral trade. The coefficient for population the trading partner is positive,
meaning that larger markets import more foreign goods. Lastly, the dummy coefficient for
WTO membership shows a positive and statistically significant: this indicates that China
trades more with partners in WTO.
4.2 Aid Heterogeneity at the HS4 Products Level
The studies on specific type of aid, so called “aid for trade”, investigate the impact of aid
on trade for different aid categories (Calı̀ and te Velde, 2011; Hühne et al. (2013); among
others), and this channel has been little mentioned for the general case of foreign assistance.
In order to have an in-depth analysis on aid heterogeneity in the general case for foreign
aid, we now turn to examine deeply the impact of each aid category on different commodity
groups of products. To better understand the effects of aid on donors’ exports to recipient
countries, Hühne et al. (2013) split the aiding sector into three (four) categories. We
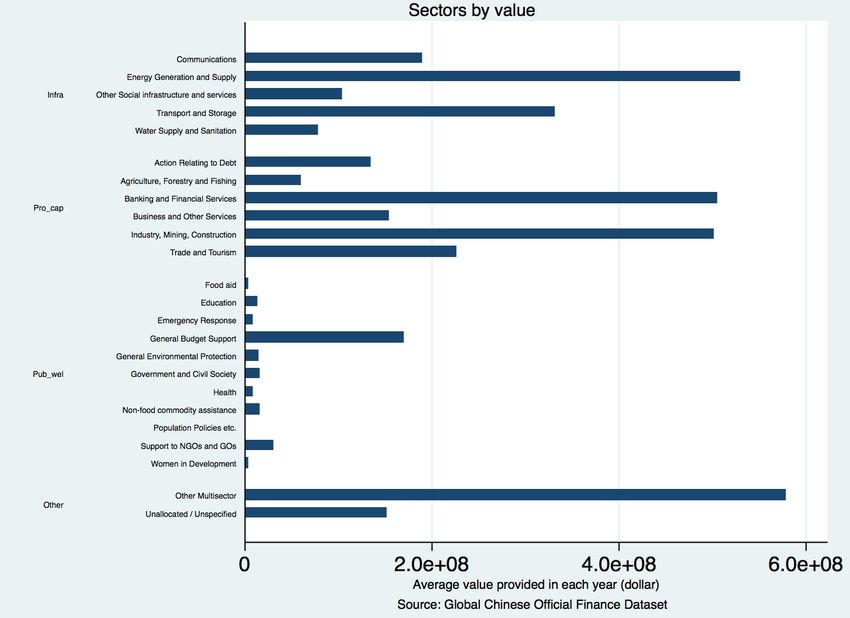
follow their classification and decompose China’s foreign aid into four categories:8 (i) Eco-
nomic infrastructure (the Inf rastructure variable), including Communications, Energy
generation and supply, Transport and storage, Other social infrastructure and services; (ii)
Productive Capacity (the P roductive capacity variable) consisting of Agriculture, forestry
and fishing, Banking and financial services, Business and other services, Industry, mining,
construction, Trade and tourism, Action relating to debt, Emergency response and Gen-
eral budget support; (iii) Public welfare (the P ublic welf are) consisting of Education,
General budget support, General environment protection, Government and civil society,
Health, Support to non-government organizations and Women in development; (iv) Other
(the Other variable) multi-sector and Unallocated/ unspecified.9
8
All the details about the sectors are provided by the database of Global Chinese Official
Finance Dataset. The sectors are classified similarly to the Chinese Credit Reporting
System.
9
Our database does not include aid related to trade policy and regulations, but does
include aid related to some sectors on public welfare. This is therefore the difference be-
8The results for the impact of aid related to infrastructure on exports of different com-
modity groups of goods are showed in Table 3. All in all, the foreign aid provided by
China on infrastructure could promote China’s exports, as shown in column (1). More-
over, according to the aid coefficients in columns (2), (3) and (4), they indicate that aid
in infrastructure enhances capital, intermediate, and consumer goods trade. However it
does not help China to export more materials (shown in column (5)).
Table 4 reports the results for the impact of aid relative to productive capacity on
Table 3: The impact of aid related to infrastructure on Exports
(1) (2) (3) (4) (5)
Export XCapital XIntermediate XConsumer XMaterials
lnAidcjt 0.00398*** 0.00382*** 0.00433*** 0.00404*** -0.000410
(0.000424) (0.000813) (0.000538) (0.000651) (0.00326)
lnYjt 1.285*** 1.262*** 1.118*** 1.372*** 0.0379
(0.0454) (0.0949) (0.0544) (0.0644) (0.212)
lnP opjt 2.216*** 2.002*** 2.327*** 2.281*** 1.738***
(0.0685) (0.177) (0.0494) (0.0800) (0.309)
W T Ojt 0.428*** 0.473*** 0.435*** 0.432*** 0.442***
(0.0205) (0.0457) (0.0254) (0.0295) (0.0778)
Country FE yes yes yes yes yes
Year FE yes yes yes yes yes
HS6 FE yes yes yes yes yes
N 2607650 422653 899581 910938 173653
Notes:
(a) Robust standard errors in parentheses
(b) ***, **, and * denote significance at the 1, 5 and 10% level, respectively
(c) Dependent variable: China’s bilateral exports at HS4 product level at time t
the exports of four commodity groups of goods. The results indicate that the aid provided
by China related to productive capacity could promote the exports at the HS4 product
level, as shown in column (1). When it comes to specific goods, reported in columns (2),
(3), (4), and (5), the aid related to productive capacity has a positive effect on the exports
of intermediate and consumer goods. The aid coefficients are not statistically significant
for capital goods and raw materials, however.
The results for China’s aid that is allocated to public welfare are reported in Table 5.
Column (1) shows the impact of aid related to public welfare on exports at the HS4 prod-
uct level. The negative sign indicates that aid related on public welfare could not promote
exports at the HS4 level, but actually reduces exports. More precisely, this category of
aid has a negative effect on the exports of capital, intermediate, and consumer goods. The
impact of aid related to other categories is shown in Table 6. The first column reports
a positive relation between an aid related to other categories and China’s exports. The
coefficients on aid are also positive and statistically significant for exports of all specific
kinds of goods except for raw materials.
Furthermore, we simultaneously include four categories of aid in our regressions. Ta-
ble 7 shows the impact of all aid categories on four commodity groups of products. All
in all, this shows that aid related to infrastructure help to increase China’s exports at
the product level, as well as aid provided to increase productive capacity, and the other
categories. However, aid related to public welfare does not help to promote China’s ex-
ports at the product level (see column (1)). Columns (2), (3), (4) and (5) show the results
for the impact of all aid categories on capital, intermediate, capital goods, and materi-
als, respectively. First, aid related to infrastructure enhances Chinese exports of capital,
tween our research and previous studies on aid for trade, which align with the classification
of the OECD Credit Reporting System.
9Table 4: The impact of aid related to productive capacity on Exports
(1) (2) (3) (4) (5)
Export XCapital XIntermediate XConsumer XMaterials
lnAidcjt 0.00178*** 0.000637 0.00417*** 0.00137* -0.00264
(0.000457) (0.000863) (0.000678) (0.000724) (0.00425)
lnYjt 1.294*** 1.271*** 1.120*** 1.388*** 0.0524
(0.0454) (0.0951) (0.0544) (0.0643) (0.212)
lnP opjt 2.247*** 2.035*** 2.356*** 2.314*** 1.740***
(0.0681) (0.176) (0.0495) (0.0804) (0.309)
W T Ojt 0.421*** 0.465*** 0.432*** 0.418*** 0.451***
(0.0201) (0.0447) (0.0253) (0.0292) (0.0788)
Country FE yes yes yes yes yes
Year FE yes yes yes yes yes
HS6 FE yes yes yes yes yes
N 2607650 422653 899581 910938 173653
Notes:
(a) Robust standard errors in parentheses
(b) ***, **, and * denote significance at the 1, 5 and 10% level, respectively
(c) Dependent variable: China’s bilateral exports at the HS4 product level at time t
Table 5: The impact of aid related to public welfare on Exports
(1) (2) (3) (4) (5)
Export XCapital XIntermediate XConsumer XMaterials
lnAidcjt -0.00304*** -0.00363** -0.00333*** -0.00293*** 0.00416
(0.000577) (0.00122) (0.000692) (0.000799) (0.00564)
lnYjt 1.295*** 1.266*** 1.128*** 1.391*** 0.0475
(0.0452) (0.0947) (0.0541) (0.0640) (0.208)
lnP opjt 2.248*** 2.034*** 2.358*** 2.316*** 1.740***
(0.0681) (0.176) (0.0495) (0.0804) (0.309)
W T Ojt 0.421*** 0.465*** 0.432*** 0.418*** 0.451***
(0.0201) (0.0447) (0.0253) (0.0292) (0.0788)
Country FE yes yes yes yes yes
Year FE yes yes yes yes yes
HS6 FE yes yes yes yes yes
N 2607650 422653 899581 910938 173653
Notes:
(a) Robust standard errors in parentheses
(b) ***, **, and * denote significance at the 1, 5 and 10% level, respectively
(c) Dependent variable: China’s bilateral exports at HS4 product level at time t
Table 6: The impact of aid related to other categories on Exports
(1) (2) (3) (4) (5)
Export XCapital XIntermediate XConsumer XMaterials
lnAidcjt 0.00330*** 0.00193* 0.00572*** 0.00280*** 0.00372
(0.000520) (0.00100) (0.000779) (0.000869) (0.00506)
lnYjt 1.289*** 1.266*** 1.118*** 1.382*** 0.0161
(0.0454) (0.0951) (0.0542) (0.0642) (0.210)
lnP opjt 2.240*** 2.030*** 2.348*** 2.308*** 1.725***
(0.0681) (0.176) (0.0494) (0.0803) (0.309)
W T Ojt 0.435*** 0.477*** 0.450*** 0.430*** 0.448***
(0.0205) (0.0454) (0.0259) (0.0297) (0.0773)
Country FE yes yes yes yes yes
Year FE yes yes yes yes yes
HS6 FE yes yes yes yes yes
N 2607650 422653 899581 910938 173653
Notes:
(a) Robust standard errors in parentheses
(b) ***, **, and * denote significance at the 1, 5 and 10% level, respectively
(c) Dependent variable: China’s bilateral exports at HS4 product level at time t
10Figure 1: Infra = Infrastructure; pro cap = productive capacity
Table 7: The impact of different types of aid on exports
(1) (2) (3) (4) (5)
Export XCapital XIntermediate XConsumer XMaterials
ln(Inf rajt ) 0.00335*** 0.00355*** 0.00296*** 0.00354*** -0.000702
(0.000433) (0.000857) (0.000486) (0.000617) (0.00319)
ln(P rojt ) 0.000859+ -0.000121 0.00294*** 0.000535 -0.00393
(0.000453) (0.000882) (0.000613) (0.000705) (0.00431)
ln(P ubjt ) -0.00283*** -0.00315* -0.00347*** -0.00279*** 0.00391
(0.000585) (0.00124) (0.0007) (0.000807) (0.0057)
ln(Otherjt ) 0.00188*** 0.000568 0.00412*** 0.00138+ 0.00462
(0.000519) (0.00104) (0.000718) (0.000831) (0.0049)
lnYjt 1.282*** 1.262*** 1.113*** 1.371*** 0.0805
(0.0456) (0.0954) (0.0544) (0.0648) (0.213)
lnP opjt 2.225*** 2.007*** 2.347*** 2.296*** 1.716***
(0.0681) (0.176) (0.0495) (0.0799) (0.303)
W T Ojt 0.425*** 0.469*** 0.429*** 0.426*** 0.444***
(0.0205) (0.0455) (0.026) (0.0294) (0.0789)
CON S -9.479*** -7.292*** -8.960*** -11.36*** 2.45
(0.546) (1.205) (0.601) (0.69) (2.816)
Country FE yes yes yes yes yes
Year FE yes yes yes yes yes
HS6 FE yes yes yes yes yes
N 2645949 428353 912061 924633 176743
Notes:
(a) Robust standard errors in parentheses
(b) ***, **, and * denote significance at the 1, 5 and 10% level, respectively
(c) Dependent variable: China’s bilateral exports at the HS4 product level at time t
11intermediate, and consumer goods. Furthermore, aid related to productive capacity only
increases exports of intermediate goods; and aid related to other categories help exports of
intermediate and capital goods. The results mentioned above indicate that aid provided
by China toward infrastructure primarily helps to exports at the product level, since the
effect is stronger when comparing the aid related to any other categories. Concerning the
different products, it seems that aid has a stronger positive effect on exports of interme-
diate goods, since the results are consistent with the different aid categories. Moreover,
the estimations that include all aid categories show a weaker effect than when estimating
them separately.
To conclude, the results underline an overall impact of China’s foreign aid on different
commodity groups of goods: providing aid to non-profit categories does not lead to more
exports; moreover, when aid flows to specific categories are meant to improve economic
growth, it could promote China’s exports to some extent. We compute the static term
of the magnitude of aid coefficients, to understand the “return” of every dollar spent in
foreign aid to trade for China in Figure 1. Accordingly, the “return” by capital goods is
higher than, for any other goods. Furthermore, exports of intermediate goods increase
more when the aid is intended to increase productivity capacity or meant for other cate-
gories. The different categories of aid interested to promote the exports of consumer goods
show the same return for the exports of consumer goods.
5 Trade Margin
We are turning our focus on fostering a deeper understanding of the trade-aid nexus. It
is widely accepted that trade growth can be divided into extensive and intensive margins
(Hummel and Klenow, 2005; Helpman et al. 2008; Besadeš and Prusa, 2011; Shi, 2011;
among others). We have confirmed the positive impact of development aid on trade in the
previous section. One question that can be further raised is to what extent development
aid help trade growth. Moreover, is the trade-aid nexus developed through the channel
of expanding trade in existing products, or initiating more varieties of goods? In this
section, the results provide evidence of the impact of development aid on trade margins,
by focusing particularly on the case of the emerging donor, China.
Specifically, this section aims to investigate the link between China’s foreign aid and
export growth by decomposing trade margins. Several indexes can be used for trade
margins, such as Theil’s, Hummels and Klenow’s, and Brenton and Newfarmer’s indices
(Carrere et al., 2011). In this paper, we align with the method of Hummels and Klenow
(2005) to compute the intensive and extensive margin at the detailed HS6 product level.10
This in-depth analysis could provide information as to whether China’s development aid
could help China to export more value in goods that are the already traded, or could help
China to export more varieties of non-traded goods.
This section aims to investigate the link between China’s foreign aid and exports by
decomposing trade margins. Following Hummels et al. (2005), we compute extensive and
intensive margins both for the product level and for the geographical country level.
First, the measurement of the extensive trade margins and intensive margins at the
10
However, this data will be aggregated at least at the country level.
12product level are as follows:
P
pcwi xcwi
i∈I
IMcw = Pcw
pkwi xkwi
i∈Icw
where IMcw denotes the intensive margin; p is the dollar value of a specific product
i, x is the number of units, c denotes China, w denotes the world, and k denotes the
countries/regions that excluded China. Thus, pcwi xcwi is the dollar value of China’s
exports of product i to the world; pkwi xkwi is the dollar value of world exports of product
i. The intensive margin translates, for a given good, how much market share China can
gain at the world level through exports;
P
pkmi xkmi
i∈Icw
EMcw = P
pkmi xkmi
i∈I
where EMcw represents the extensive margin; pkmi xkmi is the overall amount of traded
goods in the world. In other words, the extensive margin measure the market share of
the products that belong to China’s portfolio in the world market. Precise information in
trade margin at the product level is shown in Figure 2.
Figure 2: Product trade margins
Table 8 shows the impact of Chinese foreign aid on its trade margins, using country
fixed effects as controls. The first column shows the effect on the extensive margin. The
coefficients for the aid variables are positive and statistically significant. This shows that
China’s foreign aid could have a positive impact on increasing the country’s market share
in terms of the level of products. The results for the intensive margin are presented in
column (2). They indicate that China’s aid cannot promote country’s trade in already
existing goods with its trading partners.
13Table 8: PPML estimation of trade margins
(1) (2)
EM IM
lnYjt 0.582*** -0.216***
(0.0115) (0.00434)
lnP opjt 0.938*** -0.351***
(0.0592) (0.0241)
lnAidcjt 0.00223*** -0.000929***
(0.000472) (0.000215)
Country FE yes yes
Year FE no no
N 2520 2520
Notes:
(a) Robust standard errors in parentheses
(b) ***, **, and * denote significance at the 1, 5 and 10% level, respectively
(c) Dependent variable: China’s trade margin at time t
(d) EM is the product extensive margin; IM is the product intensive margin.
(e) Dummy variable for WTO membership is omitted in this regression.
Moreover, the geographical trade margins are also computed, adapting the method of
Hummels et al. (2005):
P
xcwi ncwi
i∈Dcw
GIMcw = P
xkwi nkwi
i∈Dcw
Where, GIMcw is the geographical intensive margin; i ∈ Dcw is the set of destinations
China exports its goods; x is the export dollar value to every country on average; n is
the number of destinations. Hence, pcwi ncwi is the dollar value of China’s total exports
to destination d; and pkwi nkwi is the dollar value exported to the same destination d by
other countries. Therefore, the geographical intensive margin measures China’s market
share in the export destinations.
P
xkwi nkwi
i∈D
GEMcw = Pcw
xkwi nkwi
i∈Dw
where GEMcw is to which the geographical extensive margin; and i ∈ Dw represents all
the possible destinations in the world. The geographical extensive margin represents the
share of China’s export destinations in the world market. Figure 3 shows the evolution of
geographical trade margins.
The results obtained in terms of geographical trade margins, in the presence of country
fixed effects, are reported in table 9. The first column reports how Chinese foreign aid
impacts geographical extensive margins. The negative and significant coefficient of the aid
variable suggests that foreign assistance does not help China expand into new geograph-
ical markets by creating trade relations with new partners. Concerning the geographical
intensive margin, the results are presented in column (2). The positive sign of the aid
variable underlines the fact that foreign aid could help China to get more market share in
already existing markets.
14Figure 3: Geographical trade margins
Table 9: PPML estimation on geographical trade margins
(1) (2)
GEM GIM
lnYjt -0.0272*** 0.450***
(0.000575) (0.00921)
lnP opjt -0.0502*** 0.778***
(0.00323) (0.0494)
lnAidcjt -0.000104*** 0.00161***
(0.000028) (0.000387)
Country FE yes yes
Year FE no no
N 2520 2520
Notes:
(a) Robust standard errors in parentheses
(b) ***, **, and * denote significance at the 1, 5 and 10% level, respectively
(c) Dependent variable: China’s trade margin at time t
(d) GEM is the geographic extensive margin; GIM is the geographical intensive margin
(e) Dummy variable for WTO membership is omitted in this regression.
156 Robustness
In this section, we provide a robustness check to support our results along with three lines.
We check our estimation first by using OLS fixed effects by including Country-Year-HS6
fixed effect, as controls. Then we test the robustness of our results by considering aid flows
that equal zero. Finally we add more variables in our estimation.
We first check our model with log-linearizing OLS fixed effects, to compare with the
PPML estimations in Table 2. The results of log-log regression are reported in Table 13
in the appendix. To conclude, foreign aid provided by China has a positive effect on its
exports. The magnitude of the aid coefficient in column (1) indicates that every dollar
spent by the Chinese government on aid will increase, on average, its export value at the
HS4 product level by 0.00000126 USD. Regarding the results for different types of prod-
ucts (capital, intermediate, consumer goods, and raw materials), they are all statistically
significant in columns (2), (3), and (4). Moreover, the overall aid coefficients are slightly
greater than the results of PPML.
One issue that should be taken into account is that of zero aid flows. This has become
a particular point of attention related to the aid-trade nexus (Wagner, 2003; Calı̀ and
te Velde, 2011; Lee and Ries, 2016; among others) For China’s case, the country does
not provide foreign aid all over the world, hence, zero aid flows might be included. In
our second robustness check, we follow the setting of Wagner (2003) and Abeliansky and
Martinez-Zarzoso (2018), including zero aid dummy in the estimation as follows:
(
ln(BAID) + 0, if (aidvalue) > 0
BAIDijt = ln(maxBAID, 1) + Dnoaid = (2)
0 + 1, if (aidvalue) = 0
The positive signs of lnM axAidcjt coefficients in Table 14 indicate that China’s export
will increase when China provides non-zero aid to its trading partner.
The final robustness check is provided by employing additional controls. We consider
whether institutional quality or natural resource rents in trading partners can have an im-
pact on China’s exports. The results are reported in Table 15. Column (1) is the overall
impact of the aid on products. The positive and statistically significant aid coefficient in-
dicates that an additional dollar spent by Chinese government on aid can expand the trade
by 0.00000062 dollars. The results for specific goods are shown in columns (2)-(4). These
findings indicate that the aid provided by China enhances the exports of capital and inter-
mediate goods. Concerning the additional controls, the coefficient of institutional variable
(polity) does not show any significance. A higher natural resource rate in the recipi-
ent countries promotes China’s exports in general, and particularly trade in intermediate
and consumer goods, which might be linked with the global value chain. These results
confirm that China’s aid has a positive effect on trade when we include additional controls.
7 Conclusions
We investigate China’s trade-aid nexus at the HS4 product level. In economic terms, the
return of every dollar spent on foreign aid is small at the HS4 product level, on average.
This result is in line with the conclusion of Turcu and Zhang (2019) while multiplying this
return by the number of HS4 products evaluated.
16We take a step further and analyze various heterogeneous effects. Most of the studies
focus merely on the impact of different categories of aid on trade. This paper strengthens
related research to understand the impact on different trade flows, in terms of commodity
groups. The results show that China’s aid promotes its trade of capital, intermediate, and
consumer goods.
Typically, all aid categories have a positive effect on different commodity groups of
goods to some extent. First, it seems that when aid flows to specific categories meant to im-
prove economic growth, this could promote China’s exports: aid related to infrastructure
could enhance the exports of capital, intermediate, consumer goods (except materials).
And aid related to productive capacity promotes only the exports of intermediate and
consumer goods, while aid related to other categories fosters more exports in capital, in-
termediate and consumer goods. Besides, the allocation of aid related to the non-profit
category (i.e. public welfare) does not have positive effects on exports.
In order to understand whether and how aid can promote trade, different issues re-
garding trade margins have also been addressed, by following the indexes of Hummels
et al. (2005). Our finding is that only extensive margins are enhanced at the product
level. Hence, foreign aid can help trade in new varieties of products to existing trading
partners, but does not promote more exports of the already exchanged goods with trading
partners. At the geographical level, we find that foreign aid has a positive effect on the
geographical intensive margin, indicating that aid could help getting more market shares
in already existing markets. Furthermore, the results for geographical extensive margins
show that foreign assistance does not help China expand into new markets by creating
trade relations with new partners.
Finally, several policy implications can be proposed. Foreign assistance seems to en-
hance China’s exports at the product level, and also appears to deepen international
integration. Hence, foreign aid could benefit the donor. Nevertheless, if we analyze the
trade-aid nexus from the perspective of self-interest and take account of the different aid
categories, we find that aid related to public welfare has a negative impact on trade. A
“return” in terms of trade could be received however when providing the aid towards in-
frastructure improving, increasing productive capacity and other categories of aid linked
to economic activities that might generate economic growth.
17References
[1] Abeliansky, A. L., and Martı́nez-Zarzoso, I. The relationship between the
Chinese ‘going out’strategy and international trade. economics discussion papers, no
2018-20. Kiel Institute for the World Economy. http://www. economics-ejournal.
org/economics/discussionpapers/2018-20 Received January 30 (2018).
[2] Anderson, J. E., and Van Wincoop, E. Gravity with gravitas: a solution to the
border puzzle. The American Economic Review 93, 1 (2003), 170–192.
[3] Arvin, B. M., and Baum, C. Tied and untied foreign aid: a theoretical and
empirical analysis. Keio Economic Studies, 2 (1997).
[4] Baier, S. L., and Bergstrand, J. H. Bonus vetus OLS: A simple method for
approximating international trade-cost effects using the gravity equation. Journal of
International Economics 77, 1 (2009), 77–85.
[5] Besedeš, T., and Prusa, T. J. The role of extensive and intensive margins and
export growth. Journal of development economics 96, 2 (2011), 371–379.
[6] Brecher, R. A., and Bhagwati, J. N. Immiserizing transfers from abroad. Jour-
nal of International Economics 13, 3 (1982), 353–364.
[7] Cali, M., and Te Velde, D. W. Does aid for trade really improve trade perfor-
mance? World development 39, 5 (2011), 725–740.
[8] Carrere, C., Cadot, O., and Vanessa, S.-K. Trade diversification: drivers
and impacts, m. jansen,r. peters and j. m. salazar xirinachs (eds) ed. ILO, Geneva:
ILO-EC publication, 2011.
[9] Djajić, S., Lahiri, S., and Raimondos-Møller, P. Logic of aid in an intertem-
poral setting. Review of International Economics 12, 1 (2004), 151–161.
[10] Dreher, A., Fuchs, A., Parks, B., and Strange, A. M. Aid, China, and
growth: Evidence from a new global development finance dataset.
[11] Fuchs, A., and Vadlamannati, K. C. The needy donor: An empirical analysis
of India’s aid motives. World Development 44 (2013), 110–128.
[12] Gurevich, T., and Herman, P. The dynamic gravity dataset: 1948-2016. USITC
Working Paper 2018-02-A (2018).
[13] Hansen, H., and Rand, J. Danish exports and Danish bilateral aid.
[14] Head, K., and Mayer, T. Gravity equations: Workhorse, toolkit, and cookbook.
In Handbook of international economics, vol. 4. Elsevier, 2014, pp. 131–195.
[15] Helpman, E., Melitz, M., and Rubinstein, Y. Estimating trade flows: Trading
partners and trading volumes. The quarterly journal of economics 123, 2 (2008),
441–487.
[16] Hühne, P., Meyer, B., and Nunnenkamp, P. Who benefits from aid for trade?
Comparing the effects on recipient versus donor exports. The Journal of Development
Studies 50, 9 (2014), 1275–1288.
18[17] Hummels, D., and Klenow, P. J. The variety and quality of a nation’s exports.
American Economic Review 95, 3 (2005), 704–723.
[18] Lee, H.-H., and Ries, J. Aid for trade and greenfield investment. World Develop-
ment 84 (2016), 206–218.
[19] Lemi, A. Aid for trade and Africa’s trade performance: Evidence from bilateral
trade flows with China and OECD countries. Journal of African Trade 4, 1-2 (2017),
37–60.
[20] Leontief, W. W. Quantitative input and output relations in the economic systems
of the united states. The review of economic statistics (1936), 105–125.
[21] Liu, A., and Tang, B. US and China aid to Africa: Impact on the donor-recipient
trade relations. China Economic Review 48 (2018), 46–65.
[22] Martı́nez-Zarzoso, I., Nowak-Lehmann, F., and Klasen, S. Aid and its
impact on the donor’s export industry: The Dutch case. The European Journal of
Development Research 29, 4 (2017), 769–786.
[23] Martı́nez-Zarzoso, I., Nowak-Lehmann, F., Parra, M. D., and Klasen, S.
Does aid promote donor exports? Commercial interest versus instrumental philan-
thropy. Kyklos 67, 4 (2014), 559–587.
[24] Neumayer, E. What factors determine the allocation of aid by Arab countries and
multilateral agencies? Journal of Development Studies 39, 4 (2003), 134–147.
[25] Nowak-Lehmann D, F., Martı́nez-Zarzoso, I., Klasen, S., and Herzer, D.
Aid and trade–A donor’s perspective. The Journal of Development Studies 45, 7
(2009), 1184–1202.
[26] Nunnenkamp, P., and Öhler, H. Aid allocation through various official and
private channels: Need, merit, and self-interest as motives of German donors. World
Development 39, 3 (2011), 308–323.
[27] Shi, B. Extensive margin, quantity and price in China’s export growth. China
Economic Review 22, 2 (2011), 233–243.
[28] Silva, J. S., and Tenreyro, S. The log of gravity. The Review of Economics and
statistics 88, 4 (2006), 641–658.
[29] Turcu, C., and Zhang, Y. One good turn deserves another? Evidence from China
trade and aid policy. INFER working paper (2019).
[30] Wagner, D. Aid and trade—an empirical study. Journal of the Japanese and
international economies 17, 2 (2003), 153–173.
[31] Wang, Z., and Xu, M. Aid for trade and the quality of exports. Applied Economics
Letters 25, 10 (2018), 668–673.
[32] Yotov, Y. V., Piermartini, R., Monteiro, J.-A., and Larch, M. An ad-
vanced guide to trade policy analysis: The structural gravity model. World Trade
Organization Geneva, 2016.
198 Appendix
Figure 4: Aiding sectors splitted into categories by value
20Table 10: Country list
Albania Algeria Angola Antigua and Barbuda
Argentina Armenia Australia Austria
Azerbaijan Bahamas, The Bahrain Bangladesh
Barbados Belarus Belgium Belize
Benin Bhutan Bolivia Bosnia and Herzegovina
Botswana Brazil Brunei Bulgaria
Burkina Faso Burundi Cambodia Cameroon
Canada Cape Verde Central African Republic Chad
Chile Colombia Comoros Congo, Rep.
Costa Rica Croatia Cyprus Czech Republic
Cote d’Ivoire Denmark Djibouti Dominica
Dominican Republic Ecuador Egypt El Salvador
Equatorial Guinea Estonia Ethiopia Fiji
Finland France Gabon Gambia
Georgia Germany Ghana Greece
Greenland Grenada Guatemala Guinea
Guinea-Bissau Guyana Haiti Honduras
Hong Kong, China Hungary Iceland India
Indonesia Iran, Islamic Rep. Ireland Israel
Italy Jamaica Japan Jordan
Kazakhstan Kenya Kiribati Korea, Rep.
Kuwait Kyrgyz Republic Lao PDR Latvia
Lebanon Lesotho Liberia Lithuania
Luxembourg Macau, China Macedonia, FYR Madagascar
Malawi Malaysia Maldives Mali
Malta Marshall Is Mauritania Mauritius
Mexico Micronesia Moldova Mongolia
Morocco Mozambique Myanmar Namibia
Nepal Netherlands New Zealand Nicaragua
Niger Nigeria Norway Oman
Pakistan Palau Panama Papua New Guinea
Paraguay Peru Philippines Poland
Portugal Qatar Russian Federation Rwanda
Samoa Sao Tome Prn Saudi Arabia Senegal
Seychelles Sierra Leone Singapore Slovak Republic
Slovenia Solomon Islands South Africa Spain
Sri Lanka St. Kitts and Nevis St. Lucia Vincent and the Grenadines
Suriname Swaziland Sweden Switzerland
Tajikistan Tanzania Thailand Togo
Tonga Trinidad Tobago Tunisia Turkey
Turkmenistan Uganda Ukraine United Arab Emirates
United Kingdom United States Uruguay Uzbekistan
Vanuatu Vietnam Yemen Zambia
Zimbabwe
Table 11: Correlation
lnX ln(Yct ) ln(Yjt ) ln(P opjt ) ln(DISj ) CON ln(ERcjt ) ln(Aidcjt )
lnX 1
ln(Yct ) 0.3894 1
ln(Yjt ) 0.4709 0.2215 1
ln(P opjt ) 0.6558 0.0356 -0.144 1
ln(DISj ) -0.3294 0 -0.0712 -0.2444 1
CON 0.1259 0 -0.1706 0.1599 -0.5309 1
ln(ERjt ) -0.0267 -0.182 0.061 0.0014 0.0142 0.0684 1
ln(Aidjt ) -0.0179 0.135 -0.46 0.2052 -0.0629 0.186 -0.0301 1
RT A 0.3679 0 0.1282 0.3101 -0.4571 0.3583 -0.0298 0.0503
21Table 12: PPML estimation at HS6 products level
(1) (2) (3) (4) (5)
Export XCapital XIntermediate XConsumer XMaterials
lnAidcjt 0.00334*** 0.00322* 0.00427*** 0.00252* -0.00139
(0.000848) (0.00155) (0.000841) (0.00105) (0.00308)
lnYjt 1.263*** 1.229*** 1.079*** 1.212*** 0.525*
(0.0698) (0.15) (0.0696) (0.0803) (0.207)
lnP opjt 2.188*** 2.010*** 2.324*** 2.069*** 2.234***
(0.0914) (0.218) (0.0776) (0.127) (0.281)
W T Ojt 0.409*** 0.487*** 0.429*** 0.328*** 0.419***
(0.0319) (0.0654) (0.0392) (0.0476) (0.0922)
CON S -3.651*** -1.305 -3.143*** -4.067*** 1.374
(0.832) (1.795) (0.868) (0.866) (2.586)
Country FE yes yes yes yes yes
Year FE yes yes yes yes yes
HS6 FE yes yes yes yes yes
N 11821310 2136838 3541655 4747476 1329009
Notes:
(a) Robust standard errors in parentheses
(b) ***, **, and * denote significance at 1, 5 and 10% level, respectively
(c) Dependent variable : China’s bilateral exports in level at HS4 product level at time t. Capital means
the exports of capital goods; Intermediate means the export of intermediate goods; Consumer means
the export of consumer goods; M aterials means the export of raw material.
Table 13: FE estimation at HS4 products level
(1) (2) (3) (4) (5)
ln(All) ln(Capital) ln(Intermediate) ln(Consumer) ln(Materials)
lnAidcjt 0.00537*** 0.00507*** 0.00496*** 0.00563*** 0.00264**
(0.000162) (0.000382) (0.000238) (0.000288) (0.000941)
lnYjt 1.177*** 1.491*** 1.303*** 0.884*** 0.679***
(0.0106) (0.0248) (0.0158) (0.0192) (0.0595)
lnP opjt 1.036*** 1.130*** 1.108*** 0.796*** 0.721***
(0.0153) (0.0354) (0.0213) (0.0291) (0.0895)
W T Ojt 0.183*** 0.143*** 0.163*** 0.211*** 0.242***
(0.00889) (0.0209) (0.0135) (0.0157) (0.0461)
Country FE yes yes yes yes yes
Year FE yes yes yes yes yes
HS6 FE yes yes yes yes yes
N 1764503 322478 682383 593824 80089
Notes:
(a) Robust standard errors in parentheses
(b) ***, **, and * denote significance at 1, 5 and 10% level, respectively
(c) Dependent variable : Logarithm of China’s bilateral export value at HS4 product level at time t.
Capital means the exports of capital goods; Intermediate means the export of intermediate goods;
Consumer means the export of consumer goods; M aterials means the export of raw material.
22You can also read