1H FY2021 results - Building a stronger Boral
←
→
Page content transcription
If your browser does not render page correctly, please read the page content below
1H FY2021 results
                                                           Building a stronger
                                                           Boral
                                                           Half year ended
                                                           31 December 2020

Agenda
01
     Introduction & operational   Zlatko          04   Portfolio & strategy update
     performance                  Todorcevski                                        Zlatko
                                                                                     Todorcevski

02   Financial performance
                                                  05   Outlook

                                  Tino La Spina

03   Financial Framework
                                                  06   Questions

                                                                                                   2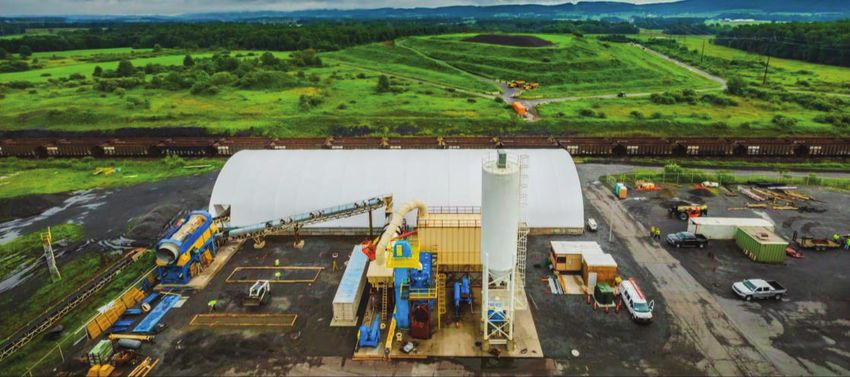
01
Introduction &
operational performance

Resetting for a stronger Boral
Solid progress to reset the business, improve returns and deliver better operating leverage

            Resetting Boral’s portfolio &                                 Boral Australia –                                Boral North America –
                 operating model                                    good business but more to do                          significant value to unlock

     9 Sale of 50% interest in USG Boral for                   9 Strengthening capability in sales & marketing   9 Structured operational, marketing, cross-
       US$1.015b, and Meridian Brick for                         and major projects                                business initiatives in Building Products to
       US$250m1; both transactions expected to                                                                     substantially lift returns
       complete in FY21                                        9 Adjacent growth strategies – recycling,
                                                                 waste, SCMs2 – and accelerating lower           9 Advisors engaged to support value
     9 Sale of Midland Brick complete                            carbon products / technology                      assessment of Building Products

                                                                                                                 9 Detailed Fly Ash review undertaken – well
     9 New CEO and CFO, plus Board renewal                     9 Transformation program to deliver initiatives
                                                                                                                   placed in current market – focused on
                                                                 including network and supply chain
                                                                                                                   securing alternative supply sources
     9 Established ‘Transformation Program Office’               optimisation

     9 Property portfolio opportunities                        9 Centralised Finance, HR, HSE, Operational
                                                                 Excellence

                                               Appropriate capital structure defined through a new Financial Framework

1.     Equates to US$125m for Boral’s 50% share
                                                                                                                                                                  4
2.     Supplementary cementitious materials (SCMs)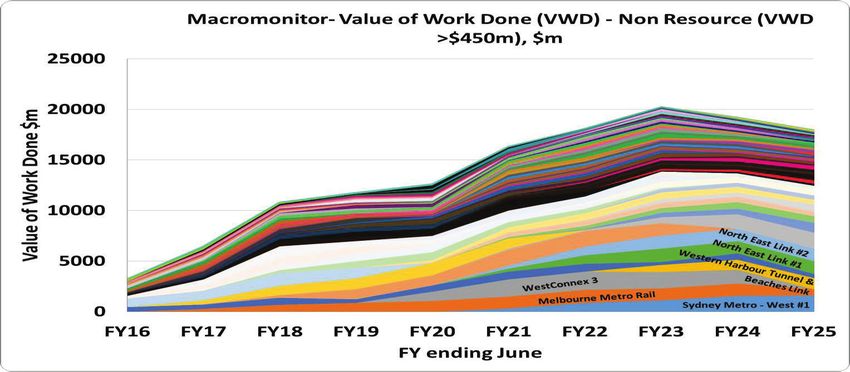
A Financial Framework aligned with investors
A $300m EBIT uplift target – supported by identified business opportunities
Financial Framework defined
Targeting ROFE > WACC throughout the cycle
Capital allocation and capital management decision making
Targeting top quartile TSR performance
On FY20 results $300m EBIT uplift (net of inflation) required to
achieve ROFE > 10%1 1H FY21 we delivered2:
$32m EBIT Transformation
Transformation opportunities and pathways $300m EBIT against target
Permanent cost reductions eg. Transformation Target (~$83m run rate)
㸫 procurement initiatives (net of inflation) $65m gross EBIT benefit
㸫 supply chain optimisation program before inflation
㸫 network reconfiguration (~$149m run rate)
New earnings streams eg.
㸫 adjacent growth opportunities – waste, recycled products,
lower carbon concrete products / technology
㸫 product innovation
㸫 BNA cross selling and distribution channel expansion
Optimise use of funds employed
Divest assets
1. Based on FY20 results for continuing operations (excluding USG Boral, Meridian Brick and Midland Brick)
5
2. Full year inflation estimate based on doubling 1H FY21 inflation; includes Boral North America contribution of US$7m before inflation and nil net of inflation
Zero Harm
Company-wide commitment to Zero Harm Today
Employee and contractor RIFR1
Boral’s safety performance steady with recordable injury
MTIFR frequency rate (RIFR) of 7.7
13.6
LTIFR Zero Harm Council focused on
12.1 ― prioritising efforts to reduce serious harm incidents
― heavy vehicle safety
Comparable data1 ― mental health & wellbeing
8.8 8.7
8.1 ― climate and energy
7.5 7.6 7.7
11.7 ― product stewardship
10.3
― contractor management
7.5 6.6
7.1
6.0
― environmental performance
6.2 6.0
― water usage
Efforts to minimise risk of spreading the COVID-19 virus
remain a key priority
1.9 1.8 1.5 1.6 1.6 1.7
1.3 1.3
On track to complete work to set science-based emission
FY14 FY15 FY16 FY17 FY18 FY19 FY20 1H FY21 reduction targets in FY21
1. Recordable injury frequency rate (RIFR) per million hours worked is made up of lost time injury frequency rate (LTIFR) and medical treatment frequency injury rate (MTIFR). Includes
employees and contractors in all businesses and all joint ventures regardless of equity interest from FY18. Prior years include 100%-owned businesses and 50%-owned joint venture 6
operations only
Continuing to respond to COVID-19
Still not business as usual, with substantial impacts in North America
Target area Actions / outcomes
Safety focus Measures to help manage the risk of spreading COVID-19 continue to be a key priority:
― strict hygiene & cleaning protocols; social distancing & PPE (where required)
― tracking suspected and actual cases; wellbeing & support programs
84 current cases among Boral employees and 755 recovered, sadly five employee deaths in North America
and one in USG Boral (Indonesia) due to COVID-19 complications1
Business impacts Focus on safely maintaining customer supply
Fly Ash operating at lower available supply due to lower electricity consumption on reduced industrial activity
Challenges in increasing staff in USA to support higher production levels due to COVID-related absenteeism
― lead times increased in line with industry experience
― maintained supply including shipping further distances as required
Continued focus on strong cash flows with excellent results in 1H FY21
Stimulus benefits
― major infrastructure work in Australia remains slow to move to execution phase, but strong pipeline exists
― HomeBuilder program in Australia supportive of detached housing but has finite duration
― reform of US infrastructure and environmental policies likely to be focus under Biden Administration; awaiting
details
1. As at 31 January 2021 7
1H FY21 snapshot
Solid earnings result underpinned by challenging conditions and transformation initiatives
A$m 1H FY21 1H FY20 Var %
Total operations basis
Revenue 2,716 2,989 (9)
EBITDA1 486 493 (1)
EBIT1 254 252 1
EBIT ROS 1 9.4% 8.4%
Net profit after tax1 156 156 -
Statutory profit after tax 161 137 18
ROFE1,2 7.7% 6.1%
Underlying EPS1 (cents) 12.7 13.3 (5)
Statutory EPS (cents) 13.2 11.6 14
Interim dividend (cents) Nil 9.5 -
Continuing operations basis
Revenue 2,703 2,960 (9)
EBITDA1 446 473 (6)
EBIT1 215 234 (8)
1. Excludes significant items
8
2. ROFE is six-month EBIT before significant items on proportional funds employed (average funds employed divided by two)
Mixed underlying market activity
Boral Australia1, %
Increase in RHS&B VWD but impacted by project
Market activity2
delays
2
13 RHS&B3
Increase in RHS&B not translating into demand for
9 39 Non-residential4 9% construction materials as materials intensity reduced
to 5% in pcp, reflecting:
14 Housing starts5 0%
― change in project activity / phase with increased tunnelling
- detached 10% works, utility relocation and earth works
17 6
- multi 14% Non-residential and multi-residential activity down;
Alterations & detached housing stronger
RHS&B 3%
Other engineering additions4
Non-residential
Broad range of external housing forecasts due in part
Detached housing to uncertainty around stimulus / pull forward impacts
Multi-residential ― average estimated annualised run rate for 1H FY21
A&A
Other
~173,700 starts5
NOTES
1. Revenue by end market. Based on 1H FY21 external revenue
2. Market activity based on 1H FY21 versus 1H FY20
3. Roads, highways, subdivisions and bridges (RHS&B)
4. Average of Macromonitor (Nov-20 Outlook) and BIS Oxford Economics (Sep-20 Outlook) forecast
5. ABS original housing starts to Sep-20 quarter. Average of Macromonitor (Nov-20 Outlook), BIS Oxford Economics (Sep-20 Outlook) and HIA (Nov-20 Outlook) forecasts
9
Mixed underlying market activity
Boral North America1, %
Market activity2 US housing starts underpinned by strong growth in
1 single-family starts, with 1H FY21 annualised run rate
13
Housing starts3 11% estimated at ~1.5m total housing starts
10
44 - single family 22% US repair & remodel sector buoyed as quarantine
orders encouraged home improvements
- multi family 12%
24 Industry remains constrained due to tight labour
Repair & remodel4 18%
8 market and high levels of absenteeism caused by the
Non-residential5 23% COVID pandemic
Single-family
Multi-family Infrastructure6 3% Building products lead times remain challenging
R&R
― ~75% of manufacturers and distributors report lead times
Non-residential
Infrastructure
are above normal7
Other
NOTES
1. Revenue by end market. Based on 1H FY21 external revenue
2. Market activity based on 1H FY21 versus 1H FY20
3. US Census seasonally adjusted annualised housing starts (January 2021). Based on data up to December 2020
4. Moody‘s retail sales of building products, December 2020
5. Management estimate of square feet area utilising Dodge Data & Analytics December 2020 report
6. Management estimate of ready-mix demand utilising Dodge Data & Analytics December 2020 report and other industry sources
7. Building Products survey report, Zelman & Associates, January 2021
10
Revenue and earnings

 Revenue variance, A$m                                                                                               EBIT1 variance, A$m

                                                                                                                                          Includes a $12m
                                                                                                                                         lower contribution
                                                                                                                                            from Property
                                                                                                                                                                                     21              steady
     2,989                                                                                                                                                     12
                         147                                                                                                                                                                                       254
                                             110                    16              2,716                               252
                                                                                                                                            31
                                             Boral North America

                                                                                                                                                               Boral North America
                           Boral Australia

                                                                                                                                             Boral Australia
                                                                   Discontinued2

                                                                                                                                                                                     Discontinued2

                                                                                                                                                                                                      Corporate
     1H FY20                                                                       1H FY21                            1H FY20                                                                                     1H FY21
     Revenue                                                                       Revenue                             EBIT1                                                                                       EBIT1

1.   Excluding significant items
                                                                                                                                                                                                                      11
2.   Discontinued includes Midland Brick and Boral’s 50% post-tax equity accounted income from USG Boral JV and North America Meridian Brick JV

02
Financial
performance
Group financial performance
Solid earnings result – uncertain market conditions but underpinned by transformation initiatives
Total operations basis (A$m)
1H FY211 1H FY20 Var %
(figures may not add due to rounding)
Revenue 2,716 2,989 (9)
2
EBITDA 486 493 (1)
Depreciation and amortisation (232) (241) 4
2
EBIT 254 252 1
Net interest (58) (61) 5
2
Tax (40) (34) (18)
Net profit after tax2 156 156 -
Significant items (gross) (2) (24)
Tax on significant items 7 4
Statutory net profit after tax 161 137 18
Effective tax rate2 20.6% 18.0%
1. Refer to slides 60 to 61 for reconciliation to reported results and explanation of these items
13
2. Excluding significant items
Boral Australia
Revenue and earnings impacted by lower volumes and softer prices
Continuing operations Revenue declined 8%
1H FY21 1H FY20 Var %
A$m ― lower volumes and pricing, particularly in NSW and Qld
1,605 1,752 (8)
where major project work declined, and in NSW where multi-
Revenue
residential and non-residential activity has significantly
EBITDA1 250 287 (13) declined
1 ― selling prices on a like for like basis stabilised at lower levels;
EBITDA ROS 15.6% 16.3%
quarry external average selling prices were steady benefiting
EBIT1 128 160 (20) from a more favourable product mix
EBIT1 ROS 8.0% 9.1% EBIT declined 20%
Property 17 29 (40) ― lower volumes, due to a significantly lower contribution from
major projects, especially in the December quarter
EBIT1 excluding Property 111 131 (15) ― Property contributed $17m with the sale of the Alexandria
EBIT1 ROS excluding Property 6.9% 7.5% land
― benefits from Transformation cost improvements contributed
Average funds employed 2,443 2,585 ~$32m to EBIT net of inflation, which helped to mitigate
ROFE1,2 10.5% 12.4% lower volumes and pricing
1. Excluding significant items
2. Divisional ROFE is six-month EBIT before significant items on proportional funds employed (average funds employed divided by two) 14
Boral Australia
Good early progress on delivering cost improvements, while lower volumes and price impacted
160 29
Net Transformation
131 34 benefit ~ $32m 1 17 128
56 111
19
A$m
24
Cost savings2
Price / mix
One-offs
Property
Property
Inflation
Volume
1H FY20 1H FY20 1H FY21 1H FY21
EBIT1 EBIT1 ex. EBIT1 ex. EBIT1
Property Property
1. Excluding significant items
2. Cost savings delivered by Boral Australia in 1H FY21 were from permanent cost reduction initiatives 15
Boral North America
Margin recovery delivered through improvement initiatives and a lift in market demand
Continuing operations
1H FY21 1H FY20 Var %
US$ revenue declined 3%
A$m
― higher revenues in Light Building Products and Stone, were
Revenue 1,098 1,208 (9) offset by lower Fly Ash and Windows revenue
EBITDA1 209 199 5 ― strong volume growth in Light Building Products, Stone and
Roofing primarily in the December quarter
EBIT1 100 88 14
EBIT grew 22%
US$m
― a property sale and higher one-off costs in prior year.
Revenue 801 825 (3) Excluding these, underlying EBIT was broadly steady on
lower revenues
EBITDA1 153 136 12
― focus in 1H FY21 was on ramping up production to supply
1
EBITDA ROS 19.0% 16.5% growing demand
EBIT1 73 60 22 ― Transformation benefits of US$7m offset inflation with
strengthening opportunities in the pipeline for Transformation
EBIT1 ROS 9.1% 7.3% ― Building Products benefited from good like-for-like price
Average funds employed 2,253 3,076 outcomes
1,2
ROFE 6.5% 3.9%
1. Excluding significant items and Boral‘s equity accounted income from Meridian Brick joint venture
16
2. Divisional ROFE is six-month EBIT before significant items on proportional funds employed (average funds employed divided by two)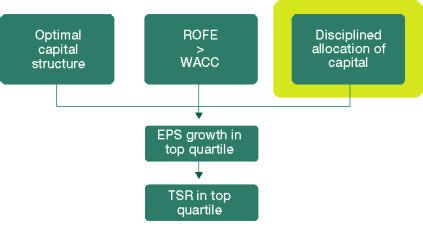
Boral North America
1H FY21 focus was on meeting higher market demand by increasing production volumes
Net Transformation
benefit is $0m (after 9 82
excluding short-term
benefit of $1m) 13 73
2
2 60 7 8 7 8
58
52
US$m
Direct COVID costs
Meridian Brick
Meridian Brick
Cost savings2
One-offs3
Volume
Inflation
1H FY20 1H FY20 1H FY21 1H FY21
Price
EBIT1 EBIT1 EBIT1 EBIT1
Continuing Continuing
Note that the indirect impacts of COVID as a result of low inventories and labour constraints dampened revenue and EBIT growth in 1H FY21
1. Excluding significant items. Note that 1H FY21 does not include the indirect market impacts of COVID
2. Cost savings delivered by Boral North America in 1H FY21 split between transformation (US$7m) and short-term / temporary benefits (US$1m) 17
3. Primarily relates to ~US$5m profit on sale of property and prior period one-off costs previously disclosed
USG Boral
A$m 1H FY21 1H FY20 Var %
Boral’s 50% interest in USG Boral included as
Reported result
part of discontinued operations
Equity income1,2 28 23 22
USG Boral contributed $28m of EBIT
Underlying result compared with $23m in the prior year first half
Revenue 730 812 (10) Sale of 50% interest in USG Boral for
EBITDA 2
134 127 5 US$1.015b, expected to close in FY21
EBITDA2 ROS 18.3% 15.7%
EBIT2 79 75 6
2
EBIT ROS 10.8% 9.2%
Average funds employed 2,001 2,092
ROFE2,3 7.9% 7.1%
1. Post-tax equity income from Boral‘s 50% share of USG Boral JV
2. Excluding significant items 18
3. Divisional ROFE is six-month EBIT before significant items on proportional funds employed (average funds employed divided by two)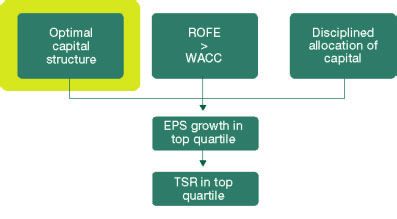
Cash flow
Strong cash flow performance contributes to strengthened balance sheet
A$m
(figures may not add due to rounding)
1H FY21 1H FY20 Free cash flow higher with strong
focus on cash flow generation
EBITDA1 486 493
continuing through 1H FY21
Change in working capital and other 21 (102)
Property development receivable - (30) Steady underlying business
Interest and tax (69) (90) performance
Equity earnings less dividends 2 (6)
Net working capital inflow of $21m
Other items - including profit on sale of assets (25) (3)
primarily resulting from lower
Restructuring, transaction & integration payments (24) (25) inventories and debtors partially offset
Operating cash flow 391 237 by a reduction in payables
Repayment of lease principal (43) (46)
Capital expenditure (123) (189)
Capital expenditure $66m lower
Proceeds on disposal of assets 108 33 Net proceeds of $108m includes $69m
Free cash flow 333 35 received on disposal of Midland Brick
Dividends paid - (158) and $24m from Alexandria property
Cash flow 333 (123) sale
1. Excludes significant items 19
Capital expenditure
Disciplined reinvestment in the business
Total capital expenditure
1H FY21 total capital expenditure of $148m Capex1 Depreciation & amortisation2
㸫 $123m of capital acquisitions
472
㸫 $25m of lease additions 453
425 429
Boral Australia
㸫 Port of Geelong clinker grinding & storage 324
340
㸫 Tarong Fly Ash 307 316 275
250
Boral North America 248 210
249 247
204
㸫 Kirkland natural pozzolan grinding
148
㸫 Miller ash collection upgrade
FY21 capital expenditure outlook ~$350m, including
lease additions
FY15 FY16 FY17 FY18 FY19 FY20 1H FY20 1H FY21
Pre AASB 16 Post AASB 16
1. Capital expenditure for FY20 and 1H FY21 includes lease additions
2. Excluding amortisation of acquired intangible assets 2003
Financial
Framework
Disciplined Financial Framework aligned with investors
Optimal capital ROFE Disciplined
structure > allocation of capital
Target net debt range of WACC
Disciplined investment /
2 – 2.5 times EBITDA,
divestment decisions
where ROFE = WACC Targeting ROFE > 10%
to ensure ROFE > WACC Return surplus capital to
Target net debt $1.5b until throughout the cycle shareholders
ROFE > WACC
EPS growth in top
quartile of ASX100
TSR in top quartile
of ASX100
22Optimal capital structure
Target net debt of 2 – 2.5 x EBITDA including leases
Debt maturity profile at 31 Dec 2020
Optimal net debt range (including leases) is
A$m
2 – 2.5 x EBITDA, equivalent to $2.0 - $2.5b where
ROFE = WACC
960
Targeting bottom of the range for flexibility
Current targeted net debt of $1.5b as ROFE is
currently less than WACC 659
587
㸫 Target based on the last 12 months of continuing
operations EBITDA of around $750m
389
347
Net debt (incl. leases) at 31 Dec 2020 of $1.94b is 303
above target net debt target of $1.5b 182
㸫 continue to reduce leverage to bottom of the range
13 31
㸫 proceeds from USG Boral divestment will reduce net
debt below bottom of the net debt range FY21 FY22 FY23 FY24 FY25 FY26 FY27 FY28 FY29 FY30
Short-term liquidity at 31 Dec 2020 of ~$1.87b, 144A USPP Bank Undrawn
including cash of $558m
23
Debt capital
Diverse sources of long-term funding
Debt sources as 31 Dec 2020, %
Weighted average tenor of 4.2 years
㸫 next debt maturity US$450m Nov 2022
Undrawn committed bank facilities ~US$1b 9
㸫 ~US$268m due to refinance in May 2022, currently 24
undrawn
Financial covenants at 31 Dec 2020:
33
㸫 gross gearing1 of 34%, well below 60% limit
㸫 minimum tangible net worth of $2.5b, above $1.75b
minimum required
34
Will consider restructuring debt to:
㸫 optimise liquidity and minimise cost of holding higher
cash and higher gross debt
㸫 minimise costs of early termination of debt (make USPP Undrawn bank 144 A Leasing
whole), to allow efficient gross debt reduction
1. Gross gearing calculated and presented as defined by gearing covenant 24ROFE > WACC throughout the cycle creates value
With FY20 ROFE < WACC, targeting an EBIT uplift of ~$300m (net of inflation)
Current priorities
Become leaner, more nimble, more cost efficient FY18 – FY20 ROFE1,2
Optimise performance of existing assets
12.8% 12.8%
Invest in ROFE accretive opportunities
Generate above WACC returns to create value 10.0%
8.6% 8.4% To achieve ROFE >
㸫 targeting ROFE > 10% to ensure ROFE > WACC WACC throughout
throughout the cycle the cycle, an EBIT
5.0% uplift of ~$300m is
㸫 operating leverage to deliver mid teens ROFE mid cycle required
and high teens ROFE at top of cycle
Transformation to bridge FY20 EBIT gap and inflation
㸫 EBIT shortfall of ~$300m (net of inflation) FY18 FY19 FY20
㸫 ~$300m of transformation required to deliver
Actual ROFE ROFE incl. Transformation
ROFE > WACC throughout the cycle
1. Excluding significant items
2. EBIT and funds employed exclude USG Boral joint venture. Funds employed are as at 30 June in relevant financial year 25
Disciplined capital allocation
Surplus capital to be returned to shareholders
Balance sheet strength is a priority
− net debt is currently above the target of $1.5b
− focus remains on debt reduction
Post receipt of proceeds from USG Boral and Meridian Brick divestments, net debt will fall below the
target, creating surplus capital
− on a proforma basis after expected net proceeds from USG Boral and Meridian Brick, Boral’s
surplus capital is in the vicinity of $1b1 at 31 December 2020
Subject to any additional ROFE accretive opportunities, surplus capital will be available for distribution
to shareholders
Manner of distributing surplus capital to shareholders will consider the circumstances at the time:
− availability of franking credits
− share price
1. Assumes USD/AUD of 0.77 on a proforma basis at 31 December 2020 2604
Portfolio & strategy
update
Building a stronger Boral
Solid progress made to strengthen Boral’s competitive advantage and improve returns
Target area Actions / outcomes
Portfolio actions Comprehensive portfolio review completed – identified opportunities and priority areas
& operating model Divestments of 50% interest in USG Boral; 50% interest in Meridian Brick; and Midland Brick, will
result in streamlined portfolio and substantially strengthened balance sheet
Will test third party interest in North America Building Products
Detailed Fly Ash review undertaken – maturing plans to grow targeted alternative supply sources
Improving operating rhythm and structure including centralisation of functions in Australia to
streamline business, reduce duplication, strengthen capability and better serve our customers
Property portfolio – review underway to explore opportunities and long-term network plan
Transformation Financial Framework – provides a clear guide for disciplined capital allocation and decision making
Targeting $300m of EBIT Transformation benefits to deliver ROFE > WACC throughout the cycle
Boral Australia – business improvement program including network and supply chain optimisation;
adjacent growth strategies prioritised
Boral North America – structured operational, marketing, cross business initiatives in Building
Products to substantially lift returns
28Divestments
Divestments in 1H FY21 resulted in a more focused geographic footprint & product portfolio
USG Boral – substantial value creation Meridian Brick – divestment in line with strategy
Announced 27 October 2020 Announced 18 December 2020
Boral to sell its 50% interest in USG Boral for Boral and JV partner Lone Star to sell its North American
US$1.015b based Meridian Brick business to Wienerberger for
US$250m; equates to US$125m for Boral’s 50% share
Attractive multiple of 15.1x FY2020 normalised EBITDA1
and ~11.3x FY2019 EBITDA1 (based on Boral’s 50% Transaction subject to customary adjustments
share of 2019 EBITDA for JV)
Transaction targeted to close in FY2021
Agreement is binding, and only subject to typical conditions
precedent including Australian / New Zealand regulatory
approvals
Transaction expected to close in FY2021
Final cash proceeds from divestments will be applied to reduce net debt to target level. Subject to prevailing
conditions and other reinvestment opportunities, surplus capital will be available for distribution to shareholders
1. Excluding significant items and the impact of IFRS leasing standard (AASB 16). FY20 multiple based on reported EBITDA for USG Boral of A$190m ‘normalised’ to adjust for A$10m reported
COVID related production impacts and converted at FY20 AUD/USD exchange rate of 0.6703. FY19 multiple based on reported EBITDA for USG Boral of A$252m converted at FY19 exchange 29
rate of 0.7145.
Fly Ash review outcomes
Boral’s fly ash business is well positioned as industry transitions away from coal energy
Key conclusions of detailed study An attractive cash generating business
Strong demand for fly ash, continued growth expected Boral has ~ 50% of total marketed fly ash but has
61% of fly ash contracts with utilities on the lowest
Supply of fresh fly ash is falling as US energy market
third of the plant cost curve1
transitions from coal; fly ash shortages may occur in
some regions Attractive opportunities for supply alternatives in
Fly ash sold as a proportion of fly ash produced has geographies where Boral has good networks:
grown and should continue to grow, helped by harvesting, importing and natural pozzolans
beneficiation, storage and grinding & blending
(from ~25% in 2005-10 to ~38% in 2020)
Fly ash prices should continue to outperform
cement, and will help to mitigate higher costs and
volume declines in transition years
~2 billion tons of viable ash buried, with ~220m tons
identified as being within Boral’s key regions
Harvested fly ash and imports are alternatives;
natural pozzolans also viable but at lower, regionally
focused volumes
Boral North America’s landfill reclaim operation at Montour, Pennsylvania
1. Utility cost curve developed by Wood Mackenzie 30Fly Ash business priorities
Our strategy is to strengthen the Fly Ash business and to leverage opportunities for the long term
Priorities New Fly Ash contracts and sources will grow current volumes,
million tons per annum
Strengthen and manage portfolio
Note that volume movements associated with temporary utility outages and periods of
of contracts
lower energy demand and recovery of these volumes are not captured below
Focus on margins / price as supply
reduces and demand strengthens
Progress Kirkland natural
pozzolan project (US$35m capital
project due to complete Jun-21)
Expedite plans to secure
alternative fly ash supply sources
particularly harvesting and imports
New contracts Flow through of Wyoming Kirkland Increase in
& projects Navajo closure contract loss pozzolan contracted
(Phased from FY21) (1H FY21) (FY21 & FY22) (Phased from FY22) fly ash
31
Transformation improvements
Target to achieve $300m of EBIT Transformation improvements (net of inflation)
$m
Remaining Transformation of
300 ~$217m to come from
opportunities in Boral Australia and
Boral North America including a
well populated 2H FY21 pipeline.
Transformation targeted from:
permanent cost reduction
new earnings streams
149 66 optimising use of existing funds
employed
divesting assets
83 ~$83m 1H FY21 annualised
32 - 32 run rate after inflation
1H FY21 1H FY21 1H FY21 Estimated
1H FY21 annualised inflation
Boral North total benefits TARGET
Boral Australia run rate annualised
America delivered
before inflation run rate1
1. Full year inflation estimate based on doubling 1H FY21 inflation 32Boral Australia
Permanent cost reductions contributing to Transformation benefits
Focus areas Example initiatives ~$56m of gross
Cost Centralisation of functions to reduce duplication, focus operations and Transformation benefits in
efficiencies reduce overheads 1H FY21, %
Labour and human capital programs delivering cost savings
Additional procurement initiatives delivering benefits and more to come
Quarry performance improvement program commenced to lift OEE1
5
Supply Supply chain initiatives delivering improving productivity of tippers, tankers 29
chain and concrete agitators and contributed to 1H FY21 cost reductions 31
Network 17 under-utilised plants / sites mothballed or closed
optimisation Concrete network portfolio review commenced, to be completed in 2H
Customer Strengthening sales & marketing capability 35
focus Enhancing customer experience – including Boral Connects
Sustainable Accelerate marketing of lower carbon and recycled products / technology Labour costs
products Strengthening alignment of innovation initiatives / R&D with customer needs Value Improvement Program 2
Adjacent Development of recycling and waste strategies underway including SCM Procurement
growth Acceleration of lower carbon products / technologies Supply chain
1. Overall Equipment Effectiveness
2. Value Improvement Program (VIP) includes Operational Excellence and site-based improvement initiatives, and site closures 33
Boral North America
While focus has been on capturing market upside and rebuilding inventories, plans in place to
deliver significant transformation benefits
Focus areas Example initiatives
Operational Lean driven operational improvements in Light Building Products, Stone, Roofing and
improvements Windows to strengthen production efficiencies and reduce costs
Execution of plans being impacted by COVID disruptions
Continued network optimisation in Fly Ash
Cost efficiencies Recruitment strategies to attract and retain staff and reduce turnover
External support engaged to strengthen processes and coordinate identified initiatives
Expanded procurement program underway
Customer Expanding trim & siding distribution channels and pull through activities
focus and marketing Enhancing customer experience
Improved go-to-market strategies in Stone to fully address post-integration channel and brand
opportunities and challenges
New component products and an expanded offering for customers in Roofing, including
targeted sales growth strategy in stone coated metal
Piloting cross-selling efforts with national builders
Product innovation Collaboration with Innovation Factory to develop lower cost production scenarios
Innovation through new to market products – both Boral and third party manufactured
3405
Outlook
FY2021 outlook
While there is continued uncertainty in Australia, expect strong housing demand in North America to continue
With Transformation initiatives delivering $65m of gross benefits in 1H FY21, expect full year FY21 Transformation benefits to be
around $170-$190m before inflation
Boral Australia Boral North America
Underlying market conditions are uncertain for remainder of COVID-related disruptions expected to be considerably less
FY21 with continued weakness in multi-residential and non- compared with 2H FY20 when impacted by mandated closures
residential activity Order book at the end of December looks good; Building
Housing approvals in December were strong, however, it is Products volumes expected to increase to better meet strong
unclear whether increase in approvals is sustainable or a market demand, resulting in reduced lead times
stimulus-driven pull forward of demand Price increases announced late in 1H FY21 expected to
FY21 expected to be a transitional period for major projects deliver benefits in 2H FY21
as current projects have relatively low concrete and asphalt In 2H FY21, Fly Ash expected to be impacted by:
intensity and new projects are slow to move into execution
continued COVID-related utility slowdowns and intermittent
At this stage, do not expect EBIT margins (excluding shuts
Property) in 2H FY21 to grow relative to 1H FY21
typical 2H seasonality impacts that result in lower earnings
Benefits from Transformation initiatives (net of inflation) and margins relative to 1H, exacerbated by loss of high
expected to offset impacts of adverse market conditions in 2H margin Wyoming contract lost in Oct-20
relative to 1H lower site services revenue on pcp
FY21 Property earnings expected to be below long-term In FY21, Fly Ash volumes expected to be lower than FY20
average of ~$35m EBIT ahead of new volumes available from FY22
36FY2021 outlook (continued) Contribution from discontinued operations is expected to be significantly lower in 2H FY21 relative to 1H FY21 due to lower underlying earnings. We continue to expect that the divestments will close in FY21 Boral’s effective tax rate1 expected to be in the range of 21–22% Boral’s total financing costs expected to be ~4.5–4.7% pa on gross debt value (including leases) Boral’s corporate costs in 2H FY21 expected to be broadly in line with 1H FY21, at ~$14m Capital expenditure for FY21 expected to be around $350m (including new leases) 1. Excluding significant items 37 06 Questions
07
Supplementary
information

Boral Group: snapshot
Australian based, ASX listed international building and construction materials group

                                                     1H FY21 revenue by division4, %                                                1H FY21 revenue by end market4, %
     A$6.6b                                                                                                                                                                                 6
                                                                                                                                                                                  AU RHS&B + other engineering
                                                                                                                                                      2                           AU non-res
     market capitalisation1                                                                                                                       4 5         23                  AU detached
     S&P/ASX 100 company                                                                            Australia
                                                                                                                                              9                                   AU multi
                                                           39                                                                             3
                                                                                                                                                                                  AU A&A
                                                                                                    USG Boral                                                                     Asia
                                                                                    50
     17                                                                                                                                                             9             USA single-fam
                                                                                                    USA                                                                           USA multi-fam
                                                                                                                                          17
                                                                                                                                                                                  USA R&R
                                                                                                                                                                9                 US non-res
     countries2                                                    11                                                                              7   7 5                        US roads & engineering
                                                                                                                                                                                  Other

     ~646                                            EBIT5, A$m
     operating sites2
                                                                                                                                          684
                                                                                                                                                              632
                                                                                                                      460

 15,899                                                                             357           398
                                                                294                                                                                                               329
                                                                                                                                                                                                 254
     employees3                                                 FY14               FY15           FY16                FY17                FY18                FY19                FY20          1H FY21

                                                                                                     Pre AASB 16                                                                   Post AASB 16
1.    As at 8 February 2021                                                                 4.   Includes Boral’s 50% share of underlying revenue from USG Boral and Meridian Brick joint
2.    As at 30 June 2020                                                                         ventures, which are not included in Group reported revenue
                                                                                                                                                                                                             40
3.    Full-time equivalent employees, including in joint ventures, as at 31 December 2020   5.   Excluding significant items
                                                                                            6.   RHS&B: Roads, highways, subdivisions & bridges
Boral Australia
Diversified geographic exposure across construction materials
1H FY21 revenue by region1, 379
% operating sites3
4 Concrete &
NSW / ACT 228 NT
21 Placing
VIC / TAS / SA
47 1
QLD Quarries 67 1 QLD
28 WA
WA 66 18
Asphalt 48 12 15 1
8 SA
1H FY21 Revenue by business1,2 Cement4 6 1 11 1
NSW/ACT
% 8 1
94 15 2
Roofing 4 3
19 4 9
Concrete & Placing
81 Quarries
10 Timber5 9
VIC
VIC/TAS
Asphalt 44 1
46
Cement
21 16 1
Building Products Masonry 1 11TAS
14 Other
1. Boral Australia external revenue for the half year ended 31 December 2020 4. Includes cement manufacturing, grinding, bagging and lime plants in NSW, a
2. Other includes transport and landfill revenues clinker plant in Victoria and a clinker grinding JV in Queensland
41
3. At 30 June 2020. Includes transport, recycling, fly ash and R&D sites 5. Includes eight Boral Hardwood mills and one JV softwood operation
Concrete and asphalt sites include mobile plants. Excludes mothballed plants
Boral Australia
Boral Australia
$1.4b 1H FY21 cash cost base, %
Inflationary cost impacts: ~$24m
5
8
Raw material costs: internationally traded clinker
5 31
prices increased in line with Asian markets and FX
25
Logistics: supply chain optimisation program
delivered a$3m of savings in 1H FY21
26
Energy and fuel: benefited from lower electricity,
gas and diesel prices
Raw materials
Payroll
Logistics
Other costs
Repairs & maintenance
Energy & fuel
42Boral Australia
Vertically integrated positions in key regions, especially in large East Coast states
Cement Quarries Bitumen
~70% manufactured (all product types) Bitumen Importers
clinker, ~30% imported >30m tonnes2 p.a. Australia (BIA) JV
1.5m tonne p.a. clinker Close to 1b tonnes total
kiln capacity and reserves with ~20-50
~4m tonne p.a. cement years reserves in key
grinding capacity1 metro quarries
~ 50-60% Cement volumes ~35% of bitumen supplied
internally to Concrete2 ~40-50% Quarry volumes ~5-15% Quarry volumes by BIA JV2
internally to Concrete2,3 internally to Asphalt2,3
Concrete & Placing Asphalt
(in Sydney & SEQ)
>2m tonnes2 of asphalt p.a.
~ 7m m3 p.a. concrete2 ~35-55% Quarry
Per tonne asphalt:
Per m3 concrete: volumes sold ~0.055t bitumen
~0.3t cementitious material externally2 ~0.7t aggregates
~1.0t aggregates ~0.2t sand
~0.9t sand
End Customer
1. Includes Boral’s share of 1.5m tonnes of grinding capacity in 50% owned Sunstate Cement JV
2. Based on recent historical average 43
3. For sand and aggregates only
Property is an ongoing contributor to earnings
Boral has a strong track record of delivering returns from property assets
Property EBIT1
A$m
20-year average Property earnings ~$35m
55
63
56 54
47 47 46
37
32 33
28 29 28 28 28 Half year
24 25 24
17 contribution
12 only
8
FY09
1H FY21
FY01
FY02
FY03
FY04
FY05
FY06
FY07
FY08
FY10
FY11
FY12
FY13
FY14
FY15
FY16
FY17
FY18
FY19
FY20
1. Excluding significant items (e.g. divestment proceeds from Deer Park Landfill) and ongoing landfill royalties 44Boral North America
Strong national networks in building products and fly ash
1H FY21 revenue by region1,2 214
% operating sites3
Southeast Fly Ash 122
10 4
28 Southwest
Midwest Northeast
16 West
47 2
Roofing 11 8
Midwest
3 2 1 2
17 25 Northeast
Stone 7
West
International
17 8 2
Light Building
1H FY21 revenue by business1 Products
8
Southwest Southeast
% 24 1 1
25 3
Windows 4 2 3 7
1 8
Fly Ash
12 Roofing
9 29 Meridian Brick 20
Stone
Light Building Products
17
Windows 3 Canada
19
14 Meridian Bricks 1 1 Mexico
1. Based on external revenue, including Boral’s 50% share of Meridian Brick JV revenue, which is not included in reported revenue
2. Southeast – AL, FL, GA, KY, MS, NC, SC, TN, VA, WV; Southwest – AR, LA, OK, TX; West – AK, AZ, CA, CO, HI, ID, MT, NM, NV, OR, UT, WA, WY; Midwest – IA, IL, IN, KS, MI, MN, MO, 45
ND, NE, OH, SD, WI; Northeast - CT, DC, DE, MA, MD, ME, NH, NJ, NY, PA, RI, VT.
3. At 30 June 2020. Includes 38 clay mines and four R&D sites. Excludes mothballed plants and distribution locations
Boral North America
Boral North America
US$676m 1H FY21 cash cost base, %1 Overall cost inflation of ~US$7m
Raw materials costs: Increased raw material inflation due to
32
10 capacity constraints across the entire value chain
12 43 Labour: Tight labour market conditions due to increased
demand for labour in manufacturing, coupled with COVID-19
related absenteeism resulted in higher costs
30
Logistics: High demand across the entire industry driving
freight and transportation costs up ~3% yoy
Raw materials
Energy and fuel: Moderate energy consumption offset by
Payroll
Logistics
favourable diesel prices bringing costs in-line with prior year
Other costs
Repairs & maintenance
Energy & fuel
1. Excluding Meridian Brick JV. Total cost base represents continuing operations less depreciation 46Boral North America – Building Products overview
Financial overview US$m FY181 FY191 FY20 1H FY20 1H FY21 Capital expenditure3, US$m
Revenue
90
Roofing 320 367 332 174 174
80
Stone 268 269 244 125 128 70
81
Light Building Products 276 277 279 143 151 60 70
50
Windows 150 157 185 93 81
40
47
Building Products Revenue 1,014 1,070 1,040 535 534 30
20 29
Building Products EBITDA2 169 186 161 88 106 10
15
-
FY18 FY19 FY20 1H FY20 1H FY21
EBITDA2 margins, % 16.7 17.4 15.5 16.4 19.9
1. FY18 and FY19 includes Windows adjustment
2. Excludes divisional overheads 47
3. Capital expenditure based on reported investing cash flows to ensure comparability between periods
Boral’s energy and fuel costs
Total energy and fuel costs (continuing operations) – 1H FY21
A$m
~$18m3 ~$94m
~$76m2
Coal $9m
Gas $6m
Electricity $25m
Diesel $36m1
Boral Australia Boral North America Total
1. Net of fuel tax rebates
2. Excludes Midland Brick 48
3. Excludes the Meridian Brick JV energy costs. US energy costs converted at 1H FY21 AUD/USD exchange rate of 0.7295Building a sustainable business for the long term
Greenhouse gas emissions from operations1 FY2020 reports FY2021 External
(million tonnes CO2-e) published recognition
Continued focus on
Australia ‒ Cement improving safety
Australia ‒ other
Setting further sustainability
3.14 objectives and targets
2.64 2.60 Completing work to set
2.46 2.46 2.41 science-based emission
2.22
reduction targets aligned
with Paris Agreement
Strengthening culture
around innovation and
customer solutions, and
ensuring Boral is a great
place to work
FY14 FY15 FY16 FY17 FY18 FY19 FY20
Scope 1 and 2 GHG emissions reduced by
8% to 2.2 million tonnes CO2-e
1. GHG emissions from operations excludes some joint ventures, which in aggregate are not deemed to have material emissions
49
08
Market data
Australia and USBoral Australia’s market segments
Revenues are derived from various market segments
RHS&B2,3, VWD A$b Detached housing5, # starts
30 120,000
25
20 80,000
15
10 40,000
5
-
1H FY21 External revenue -
by end-market1, %
FY03
FY13
FY01
FY02
FY04
FY05
FY06
FY07
FY08
FY09
FY10
FY11
FY12
FY14
FY15
FY16
FY17
FY18
FY19
FY20
FY21F
FY11
FY01
FY02
FY03
FY04
FY05
FY06
FY07
FY08
FY09
FY10
FY12
FY13
FY14
FY15
FY16
FY17
FY18
FY19
FY20
Other engineering2, VWD A$b Multi-residential5, # starts
2
125 13 120,000
100
9 39 80,000
75
50 40,000
25 14
- -
17 6
FY07
FY01
FY02
FY03
FY04
FY05
FY06
FY08
FY09
FY10
FY11
FY12
FY13
FY14
FY15
FY16
FY17
FY18
FY19
FY20
FY21F
FY07
FY01
FY02
FY03
FY04
FY05
FY06
FY08
FY09
FY10
FY11
FY12
FY13
FY14
FY15
FY16
FY17
FY18
FY19
FY20F
FY21F
Non-residential4, VWD A$b RHS&B Alterations & Additions4, # starts
50 12.5
Other engineering
40 10.0
Non-residential
30 Detached housing 7.5
20 Multi-residential 5.0
10 A&A 2.5
-
Other -
FY14
FY15
FY01
FY02
FY03
FY04
FY05
FY06
FY07
FY08
FY09
FY10
FY11
FY12
FY13
FY16
FY17
FY18
FY19
FY20
FY21F
FY08
FY16
FY01
FY02
FY03
FY04
FY05
FY06
FY07
FY09
FY10
FY11
FY12
FY13
FY14
FY15
FY17
FY18
FY19
FY20
FY21F
1. Based on split of 1HFY21 Boral Australia external revenue 4. Source: original series from ABS to Sep-20, BIS Oxford Economics (Sep-20 Outlook)
2. Source: ABS, BIS Oxford Economics (Sep-20 Outlook) and Macromonitor (Nov-20 and Macromonitor (Nov-20 Outlook) forecasts
51
Outlook) forecasts 5. Source: ABS, BIS Oxford Economics (Sep-20 Outlook) and Macromonitor (Nov-20
3. Roads, highways, subdivisions and bridges Outlook) forecasts and HIA forecasts (Nov-20 Outlook)
Australian residential construction decline
Total housing starts1 Housing starts – by state1
(‘000) 1H FY21F vs 1H FY20 (‘000)
Detached Multi
221 230
0%
197
172 173 170 174
109 165
106 156
85
68 58 -10% +10%
70 54 71 49
115 122 112 111 115 107
102 105 99
-1%
FY17 FY18 FY19 FY20 FY21F 1H20 2H20 1H21F 2H21F
* Half year data annualised
-3% +12%
Alterations & additions2 27
30
3% 27
(value of work, $b) 24
16 16
7 8
6 6
9.6 9.4 9.3 9.8 9.8 10.0 9.6
9.2 8.9
1H 1H 1H 1H 1H 1H 1H 1H 1H 1H
FY20 FY21f FY20 FY21f FY20 FY21f FY20 FY21f FY20 FY21f
NSW VIC QLD SA WA
FY17 FY18 FY19 FY20 FY21F 1H20 2H20 1H21F 2H21F * Half year data
* Half year data annualised
1. Original series housing starts from ABS to Sep-20 quarter. Average of BIS Oxford Economics, Macromonitor and HIA forecast for Jun-21 year
2. Original series from ABS. Average of BIS Oxford Economic and Macromonitor forecast for Jun-21 year. % change 1H20F vs 1H21F 52
Note: Figures may not add due to rounding
Note: Macromonitor (Nov-20 Outlook), BIS (Sep-20 Outlook) & HIA (Nov-20 Outlook)Selection of Aus. project work and potential pipeline
Project1 Status2 Project1 Status2
Norfolk Island Airport M6 – Kogarah, NSW
Melbourne Metro Rail Project (Precast), Vic Monash Freeway Upgrade – Stage 2, Vic
RAAF East Sale, Vic Complete H1 FY21
North East Link, Melbourne, Vic
Karratha Tom Price Road, WA Pacific Motorway M1 (various), SE Qld
Snowy Hydro 2.0, NSW Tendering
Queens Wharf – resort development, Qld
Mordialloc Bypass, Vic Sydney Gateway Project, NSW
West Gate Tunnel, Vic Est. completion FY22
Tonkin Highway extension, WA
Snowy Hydro 2.0, NSW (precast) Western Sydney Airport, NSW
Sydney Metro (Martin Place Station), NSW
Bunbury Outer Ring Road, WA
WestConnex 3B (above ground), NSW Coffs Harbour Bypass, NSW
Est. completion FY24
Road Asset Management Contracts, Qld New M12 Motorway, NSW Pre-tendering
Bruce Highway Upgrade (Various), Qld Sydney Metro, West extension, NSW
Gold Coast Light Rail, 3A, Qld Warringah Freeway Upgrade, NSW
Golden Plains Wind Farm, Vic Tendering
Kidston Hydro Project
Inland Rail Project, Qld, NSW, Vic
1. Boral’s major projects are generally defined as contributing >$15m of revenue to Boral
2. As at December 2020 53
A strong medium term pipeline
While the pipeline is strong, the shifting nature of work is changing materials intensity
Major transport infrastructure projects1 Softer concrete volumes driven by more tunnelling
(A$m) Premix demand (million m3) from major transport construction1
Runways
Rail
RHS&B
Growing asphalt volumes driven by Vic demand
Asphalt demand (million t) from major transport construction1
WA
VIC / SA / TAS
NSW / ACT
QLD
1. Macromonitor Major Projects (Non Resource), VWD >$450M - October 2020 Final Forecasts 54Concrete and asphalt demand in Australia
Macromonitor forecast1 demand across all Australia construction markets
Pre mix concrete demand1 Asphalt demand1
(‘000) m3 (‘000) tonne Forecast volumes
Forecast volumes 14,000
35,000
12,000
30,000
WA / NT 10,000
25,000
8,000
20,000 VIC / TAS / SA
15,000 6,000
10,000 NSW / ACT 4,000
5,000 2,000
QLD
- -
FY08
FY06
FY07
FY09
FY10
FY11
FY12
FY13
FY14
FY15
FY16
FY17
FY18
FY19
FY20
FY21f
FY22f
FY23f
FY24f
FY13
FY06
FY07
FY08
FY09
FY10
FY11
FY12
FY14
FY15
FY16
FY17
FY18
FY19
FY20
FY21f
FY22f
FY23f
FY24f
› Macromonitor forecasts Concrete volumes to soften › Macromonitor forecasts Asphalt volumes to be steady in
before moderating back to FY17 levels by FY24 FY21 and remain at high levels to FY24
› ~0.7% CAGR2 in concrete volumes forecast FY20 to › ~5.1% CAGR2 in asphalt volumes forecast FY20 to FY24
FY24
Depending on phasing of projects and given Boral’s large share of major projects, Boral’s
change in FY21 volumes on FY20 could be different to what Macromonitor is forecasting
1. Macromonitor Construction Materials forecast (Nov 2020 outlook)
55
2. Compound annual growth rate
US housings starts by region
Southeast – 28% of Boral’s US revenue1,2 Midwest – 16% of Boral’s US revenue1,2
+16% +9%
547 532 206 200
Housing starts (‘000)
189 190 184
179 180
Housing starts (‘000)
461 459 177
383
407 421 415 121 123 West – 17% of Boral’s US revenue1,2 150
164 55 56
345 124 124 68 55 66 64
63 56
304 110 100 105 60
111
111 +15% 47
95
426 409 150 144
297 320 310 337 335 341 332 115 122 125 121 125 119
272 322 103 104
209 234 312 300 290
281 77
256 78
227 104 106
FY14 FY15 FY16 FY17 FY18 FY19 1HFY20 FY20 1HFY21 FY21F 87 86 FY14 FY15 FY16 FY17 FY18 FY19 1HFY20 FY20 1HFY21 FY21F
205 99
85
82
75
Southwest – 25% of Boral’s US revenue1,2 182
218 206 213 204
264 254
Northeast – 10% of Boral’s US revenue1,2
172
130 145
+18%
FY14 FY15 FY16 FY17 FY18 FY19 1HFY20 FY20 1HFY21 FY21F
-11%
291 283
145
Housing starts (‘000)
140
Housing starts (‘000)
249 240 43 45 125 127 127 124
121 118
214
187 196 205 201 211
53 53
Multi-family 108 108
51
53
47 55 38 52 Single family 81 77 71 59
96 93
79 78
62 51
248 238
196 188
148 150 163 162 159
134 59 57
46 44 51 50 49 47 48 46
FY14 FY15 FY16 FY17 FY18 FY19 1HFY20 FY20 1HFY21 FY21F FY14 FY15 FY16 FY17 FY18 FY19 1HFY20 FY20 1HFY21 FY21F
1. US Census seasonally adjusted annualised housing starts (January,2021)
2. Based on FY2020 external revenue, including Boral’s 50% share of Meridian Brick JV revenue, which is not included in reported revenue. 56
Southeast – AL, FL, GA, KY, MS, NC, SC, TN, VA, WV; Southwest – AR, LA, OK, TX; West – AK, AZ, CA, CO, HI, ID, MT, NM, NV, OR, UT, WA, WY; Midwest – IA, IL, IN, KS, MI, MN, MO,
ND, NE, OH, SD, WI; Northeast - CT, DC, DE, MA, MD, ME, NH, NJ, NY, PA, RI, VT; international sales comprise the remainder of the revenue splitSq Ft Area (m’s) Housing starts (‘000)
5.
4.
3.
2.
1.
FY01 1,716
329
FY01 1,242 1,571
FY02 1,477
FY02 1,313 1,646
FY03 1,352
FY03 1,393 1,729
333 336
FY04 1,359
FY04 1,587 1,945
FY05 1,368
FY05 1,663 2,016
358 353
FY06 1,534
FY06 1,681 2,036
355
FY07 1,486
FY07 1,242 1,546
304
FY08 1,473
09
FY08 807 1,132
326
FY09 1,389
FY09 459 646
187
FY10 1,390
FY10 501 594
93
FY11 1,433
FY11 427 570
FY12 1,446
FY12 475 684
143 209
FY13 1,023
FY13 594 877
FY14 864
FY14 621
Moody’s Retail Sales of Building Products as of December 2020
FY15 955
283 332
Dodge Data & Analytics, Non-Residential Area (December 2020)
953
Financial data
USA new residential: 52% of BNA revenue1
USA non-residential: 10% of BNA revenue3
FY16 FY15 675 1,056
1,002
FY16
Solid outlook across all segments
FY17 1,061 760 1,149
379 389
Dodge Data & Analytics, Infrastructure Ready Mix Demand (December 2020)
FY18 1,064 FY17 815 1,201
FY19 1,064 FY18 883 1,253
Multi-family
Single-family
1H FY20 1,253 FY19 854 1,222
386 369 368
Fannie Mae and Freddie Mac. Various release dates between Sept 2020 and January 2021
FY20 1,067 1H FY20 933 1,361
1H FY21 960 FY20 893 1,313
428 420
FY21F 953 1H FY21 1,137 1,512
375
FY21F 1,092 1,471
379
RMX cubic yards (m’s) US$ billions
FY01 142 FY01 233
FY02 149 FY02 244
FY03 151 FY03 251
FY04 141 FY04 280
FY05 137 FY05 308
FY06 146 FY06 336
FY07 154 FY07 325
FY08 159 FY08 312
Boral North America market segments
FY09 160 FY09 281
FY10 186 FY10 257
FY11 186 FY11 262
FY12 174 FY12 278
FY13 171 FY13 291
USA infrastructure: 13% of BNA revenue4
FY14 180
FY14 308
US Census seasonally adjusted annualised housing starts, January 2021 release. Forecasts based on an average of analysts’ forecasts sourced from NAHB, MBA, Wells Fargo, NAR,
FY15 191 FY15 324
USA repair & remodel: 24% of BNA revenue2
FY16 188 FY16 343
FY17 187 FY17 357
FY18 198
FY18 373
FY19 210
FY19 381
1H FY20 207
1H FY20 386
FY20 216
FY20 401
1H FY21 200
1H FY21 453
57
FY21F 205
FY21F 4361H FY21 segment revenue, EBITDA and EBIT
External revenue, A$m EBITDA1, A$m EBIT1, A$m
Figures may not add due to rounding 1H FY21 1H FY20 1H FY21 1H FY20 1H FY21 1H FY20
Boral Australia 1,605 1,752 250 287 128 160
Boral North America 1,098 1,208 209 199 100 88
Discontinued Operations2 13 29 40 20 39 18
Corporate - - (13) (13) (14) (14)
Total 2,716 2,989 486 493 254 252
1. Excluding significant items
2. Discontinued Operations includes Midland Brick, Boral’s 50% post-tax equity accounted income from the USG Boral joint venture and Meridian Brick joint venture 59
Non-IFRS information
Boral Limited’s statutory results are reported under International Financial Reporting Standards.
Earnings before significant items is a non-IFRS measure reported to provide a greater understanding of
the underlying business performance of the Group. Significant items are detailed in Note 2 of the half
year financial report and relate to amounts of income and expense that are associated with significant
business restructuring, business disposals, impairment or individual transactions.
A reconciliation of these non-IFRS measures to reported statutory profit is detailed on the next page.
The USG Boral division commentary also includes a non-IFRS measure of underlying results excluding
significant items, representing the six months trading results to assist users to better understand the
trading results of this division.
The results announcement has not been subject to review or audit, however it contains disclosures
which are extracted or derived from the Half Year Financial Report for the six months ended 31
December 2020. This Half Year Financial Report for the six months ended 31 December 2020 is
prepared in accordance with the ASX Listing Rules and should be read in conjunction with any
announcements to the market made by the Group during the year.
60Non-IFRS information (continued)
A reconciliation of non-IFRS measures to reported statutory profit is detailed below:
Before
Significant Reported Continuing Discontinued
A$m Significant Total
items Result Operations operations
Items
Sales revenue 2,716.1 - 2,716.1 2,703.3 12.8 2,716.1
Profit before depreciation, amortisation, interest & tax, EBITDA 486.2 (1.5) 484.7 442.5 42.2 484.7
Depreciation & amortisation (231.8) - (231.8) (231.1) (0.7) (231.8)
Profit before interest & income tax, EBIT 254.4 (1.5) 252.9 211.4 41.5 252.9
Interest (58.3) - (58.3) (58.3) - (58.3)
Profit before tax, PBT 196.1 (1.5) 194.6 153.1 41.5 194.6
Tax benefit / (expense) (40.3) 7.1 (33.2) (37.7) 4.5 (33.2)
Net profit after tax, NPAT 155.8 5.6 161.4 115.4 46.0 161.4
Basic earnings per share, EPS1, ¢ 12.7 13.2
1. Based on weighted average number of shares on issue of 1,225,653,798
61
US tax loss summary
Federal tax losses US$m Gross value Tax effected value
Recognised on balance sheet 424 89
Unrecognised 85 18
Total 509 107
62Funds employed at 31 December 2020
A$m (figures may not add due to rounding) Actual Funds Employed
Cash 558
Receivables 693 693
Inventories 497 497
Financial assets 58 58
Tax assets 137
Other assets 93 93
Investments 23 23
Property, plant & equipment 2,940 2,940
Intangible assets 1,971 1,971
Assets classified as held for sale 1,120 1,120
Total assets 8,090 7,395
Payables 611 611
Provisions 349 349
Debt & lease liabilities 2,497
Financial liabilities 101 101
Tax liabilities 54
Other liabilities 12 12
Total liabilities 3,624 1,073
Net Assets/ Funds employed as at 31 Dec 2020 4,466 6,321
Funds employed – 30 Jun 2020 6,975
Average funds employed 6,648
Proportional Funds employed 3,324
63
Disclaimer
The material contained in this document is a presentation of information about the Group’s activities
current at the date of the presentation, 9 February 2021. It is provided in summary form and does not
purport to be complete. It should be read in conjunction with the Group’s periodic reporting and other
announcements lodged with the Australian Securities Exchange (ASX).
To the extent that this document may contain forward-looking statements, such statements are not
guarantees or predictions of future performance, and involve known and unknown risks, uncertainties and
other factors, many of which are beyond our control, and which may cause actual results to differ
materially from those expressed in the statements contained in this release.
This document is not intended to be relied upon as advice to investors or potential investors and does not
take into account the investment objectives, financial situation or needs of any particular investor.
64Contact Details Kylie FitzGerald + 61 401 895 894 Kylie.FitzGerald@boral.com.au www.boral.com
You can also read