Summer 2021 Market Commentary - Auxier Asset Management
←
→
Page content transcription
If your browser does not render page correctly, please read the page content below
+Fast spreading
   coronavirus+++++++++++++++++++++++++++++++++++++++++++++++++++++++++++

            15668 NE Eilers Rd, Aurora, OR 97002 • Phone 503.885.8807 • 800.835.9556 • Fax 503.885.8607 • Email info@auxierasset.com

Summer 2021 Market Commentary
The market and economy continued a strong rebound during the second quarter as COVID restrictions eased
further. The 7-day moving average for new COVID cases in the US recently reached its lowest level since
the start of the pandemic. However, the spike in the Delta variant is adding headline uncertainty. Economic
growth has been strong thanks to vaccine distribution efforts, businesses reopening and emergency fiscal
and monetary stimulus. JPMorgan estimates full-year US GDP growth of around 6%, the highest since
1984. The ten-year treasury bond yields less than 1.5%. Back in 1984 we were buying Washington State
general obligation bonds yielding 10% when the GDP had similar readings. Retail sales are 20% higher
than pre-COVID levels, indicating strong consumer spending and sentiment. Back-to-school spending
should be boosted with the liberalized Child Tax Credit (CTC). Nearly 70% of US economic growth is tied
to consumer spending. The housing market fundamentals are benefiting from record low mortgage rates,
surging demand from millennials, buy-to-rent institutions, foreign buyers and Airbnb conversions. In
addition, the pandemic and technology advances enabled millions to work at least part time from home,
adding unanticipated demand from the migration out of the major cities. Home equity values now exceed
$22 trillion.

We continue to meet with numerous management teams and see powerful earnings on the back of companies
that have scale and have been aggressively digitizing, with a focus on improving the customer experience.
The pricing power has been the strongest I have seen in my career across most industries. Surprisingly,
margins have held up as well.

Inflation

The pandemic put a strain on global supply chains which has resulted in dramatic price increases in the
shipping container space. According to research from Sea-Intelligence, the average price to ship a 40-foot
container has increased by more than fourfold to $8,399 as of July 1. Some short-term rates have exceeded
$25,000. Global vendors like Amazon cannot afford to delay their shipping in hopes of better rates and so
they have been forced to pay these elevated prices, which has boosted global shipping companies. The
leading container company Textainer has had tremendous operating results. Philip Damas, head of supply
chain advisory at Drewry, expects that the strains on the container shipping industry will remain in place
until early 2022. Ironically, just as consumers get used to online shopping, the cost of transportation is
soaring. The American Trucking Association projects a shortage of 100,000 drivers by 2023. Numerous
CEOs are echoing the price pressures that seem to be accelerating. Unemployment benefits have been so
attractive that it has been difficult to motivate workers to return, prolonging bottlenecks.

The ongoing microchip shortage has caused the used car market in the US to heat up as new car inventory
in the US was 54% lower in June 2021 versus June 2019, which has boosted demand for used vehicles.
Prices are up 40% more than in February of 2020 before the peak of the pandemic. The average 9-year-old
vehicle sold for $13,250 in June, which is approximately up 30% over June 2020. Microchips are a critical
component of nearly every electronic device in the world so the shortage of new cars could continue for
some time.
So far, we are seeing most businesses raise prices and consumers willing to pay up. This has contributed to
a tremendous broad-based earnings improvement for our portfolio companies.
The dollar has depreciated over 85% the past 50 years. Purchasing power risk is hidden as people mistakenly
perceive safety in fixed income. Today we are seeing negative real yields all the way out 30 years as inflation
is running over 5.3%. Owning businesses is a better bet. However, you can’t just pay any price for stocks
as higher inflation tends to compress P/E ratios. In 1972, conventional wisdom was to simply buy the 50
most popular stocks known as the “Nifty Fifty.” The idea was to buy, hold and forget. In the frenzy the
stocks traded over 80 times earnings on average. Then, despite strong earnings, a surge in oil and inflation
crushed valuations leading to a 70%-90% decline for the group. A good general rule for a market multiple
has been 20 less the inflation rate. In 1979, with 11% inflation the P/E of the market sunk below 10.
It appears the current inflation is understated, especially if you add back energy, food and housing which
are all excluded. The consumer price index (CPI) only includes the rent component of housing; however,
rents are now catching up too. Invitation Homes, the largest single-family landlord in the nation, recently
boosted rents by 8% across the country. Back in the 1970s, Fed chairman Arthur Burns claimed that rising
inflation was nothing to worry about—it was “transitory” and best ignored. When oil quadrupled, they
solved the problem by taking oil out of the index. Food prices, a 25% weighting, soared and were also
removed. So was housing, a 16% weight. The Dow hit 1,000 in 1972 and was flat until 1983. As cost price
pressure hits, consumer wage expectations and compensation demands go up, which are hard to reverse–
especially in areas difficult to digitize like skilled labor. Historically, government intervention in the form
of wars, extreme socialism and confiscations have contributed to supply disruptions and higher inflation.
After the American Civil War, inflation drove interest rates to 20%. When Zimbabwe confiscated private
farms their inflation soared 3000%. As Venezuela nationalized most of their businesses inflation exceeded
500%. Inflation in Argentina recently gained 70% as the government interrupted free markets and politics
moved to the extreme left. Domestically, recent bans on natural gas turbines and pipelines have led to a
reduction in fossil fuel capital investment which should contribute to higher sustained power prices. Over
the years, societies with free market competition and innovation have generally kept inflation in check.
However, heavy-handed socialism is a recipe for more permanent price increases. The potential for the
Delta variant could further extend the interruption in supply chains.
Companies That Can Thrive During Inflationary Periods
When I started in the business, inflation was one of the biggest headline worries. I initially went back over
the prior 80 years and studied the types of businesses that could survive, thrive and outperform during high
inflation. Generally, undervalued companies that had powerful brands with freedom to price, consistent and
growing demand, rapid inventory turns and high returns on invested capital with low mandatory capital
expenditures tended to outperform. Drug stores and supermarkets with low ticket necessities were notable
winners. Investment selection becomes much more important as higher inflation can put a lid on valuations.
Often markets can become rangebound and can go flat for years. In 1983 when the Dow rallied to 1,000, I
remember experienced investors wanting to sell out as the market had been stuck in a narrow trading range
for the prior 18 years with 1,000 the top. A higher inflationary environment is not a friendly environment
for the “growth at any price” momentum approach. Making an exceptional buy becomes much more
important as inflation acts as a headwind to breakout valuations.
Kroger Shows Confidence Amid Fears of Rising Inflation
Kroger is an example of an inexpensive (13 P/E), low expectation stock that has survived well during
periods of higher inflation. The company turns over inventories 14 times a year, which helps to maintain a
high return on invested capital and pricing power. They recently recorded another strong quarter and beat
consensus estimates for both revenue and non-GAAP (generally accepted accounting principles) EPS.
2Kroger has been able to maintain their momentum despite the lifting of pandemic restrictions and restaurant
re-openings. Digital sales continued to grow, up 16% on the quarter and 108% over the last two years. Due
to their success this quarter, the board announced a new $1 billion share repurchase program. Management
also raised their guidance for full-year 2021 adjusted EPS to $2.95-$3.10, up from their previous guidance
of $2.75-$2.95. Since Amazon’s acquisition of Whole Foods in 2017, some investors have feared that
Kroger would begin to lose market share to the e-commerce giant. The pandemic has bolstered their
position as a leader in the US grocery market with an 11.7% share. Despite all the fear surrounding
Amazon’s Whole Foods purchase, they have only been able to amass a market share of 2.6% since entering
the grocery space. Management has also addressed fears that future inflation could dampen growth, stating
that they operate at their best when the inflation rate is around 3%-4% and more shoppers move away from
large brands, opting for Kroger’s lower-cost private label options. Kroger also continues to build their
Ocado automated warehouses that will greatly enhance the company’s delivery capabilities and allow them
to better compete with e-commerce giants like Walmart and Amazon. In addition, they are well positioned
to benefit from the robust back-to-school market this fall.
Reality of Automation in the Auto Industry
The advancement of AI technology has increased interest in developing self-driving cars and has led to over
$120 billion in investments from 2017 to 2019, according to research from McKinsey. Companies like
Tesla, Uber and Lyft have bet big on driverless technology, but it may take longer than expected before
fully autonomous vehicles are available to consumers. Elon Musk, CEO of Tesla, recently stated that
creating AI programs that can adapt to complex roadways and unpredictable human drivers has proven to
be a greater challenge than they originally thought. Tesla is still committed to the technology as they
continue to test an advanced beta version of their self-driving software that Musk believes could one day
solve the challenge of autonomous vehicles without the use of expensive lidar and radar sensors. Companies
like Alphabet’s Waymo have been able to achieve fully autonomous vehicles using lidar sensors and highly
detailed maps of specific areas around Phoenix, Arizona. However, this approach will likely be difficult to
scale and could be cost-prohibitive for the average consumer. It remains to be seen if these challenges will
be solved any time soon, and companies may be better off investing in safe and effective driver assist
systems until AI technology advances further. McKinsey also estimates that any company that intends to
remain competitive in the driverless car market could potentially have to invest $70 billion through 2030.
As always, talk is cheap, and it is important to look past the hype and focus on execution.
Value Potential
In 2000, Yahoo and AOL were two of the most exciting technology stocks that were going to transform the
world. In the dot com mania they reached a combined valuation in excess of $250 billion. This year Verizon
sold both companies to Apollo Global Management for $5 billion—a 98% decline. AT&T acquired
DIRECTV for $49 billion in 2015 and recently sold 30% of the business for $1.8 billion. Overpaying and
overborrowing are the recurring sins that consistently destroy shareholder capital. Just like in 2000, the
spread between the cheapest and most expensive stocks is now one of the widest in history. Historically,
the Russell 1000 Growth Index trades at a 5.6 times point premium over the Value Index but is currently
trading at a 10.3 premium. We expect a reversion to the mean, especially if the economy broadens and
inflation continues to rise.
3Second Quarter 2021 Performance Update
Auxier Focus Fund’s Investor Class
Auxier Focus Fund – Investor Class
returned 4.91% in the second quarter vs.
Average Annual Total Returns (6/30/2021)
8.55% for the cap-weighted S&P 500
Since Inception (07/09/1999) 7.90%
Index and 5.08% for the DJIA. The
10-year 9.27%
equal-weight S&P 500 returned 6.90%.
5-year 11.23%
Small stocks as measured by the Russell
1-year 34.03%
2000 were up 4.29%. The MSCI
3-month 4.91%
Emerging Markets Index gained 5.05%.
A 60/40 S&P 500 and Bloomberg
Performance data quoted represents past performance and is
Barclays US Aggregate blended index
no guarantee of future results. Current performance may be
returned 5.84% and bonds, as measured
lower or higher than the performance data quoted. Investment
by the Bloomberg Barclays US
return and principal value will fluctuate so that an investor's
Aggregate Bond Index, returned 1.83%
shares, when redeemed, may be worth more or less than
for the quarter.
original cost. As stated in the current prospectus, the Fund’s
Investor Class Share’s annual operating expense (gross) is
Stocks in the Fund comprised 96.3% of
1.10%. The Fund’s adviser has contractually agreed to waive
the portfolio. The equity breakdown was
a portion of its fee and/or reimburse Fund expenses to limit
85.1% domestic and 11.2% foreign, with
total annual operating expenses at 0.92%, which is in effect
3.7% in cash and short-term debt
until October 31, 2021. Other share classes may vary. The
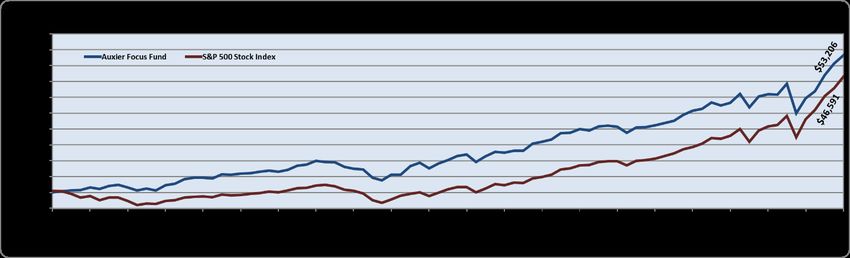
instruments. A hypothetical $10,000
Fund charges a 2.0% redemption fee on shares redeemed
investment in the Fund since inception
within 180 days of purchase. For the most recent month-end
on July 9, 1999 to June 30, 2021 is now
performance, please call (877) 328-9437 or visit the Adviser’s
worth $53,206 vs. $46,591 for the S&P
website at www.auxierasset.com.
500. The equities in the Fund (entire
portfolio, not share class specific) have
had a cumulative return of 775.05% since inception and the Fund as a whole has had a cumulative return of
432.05% vs. 365.91% for the S&P. This was achieved with an average exposure to the market of 80.6%
over the entire period.
Contributors to the quarter: Our outlook on a cross section of positions with a positive impact on the
portfolio for the quarter ended 6/30/2021.
Microsoft Corporation (MSFT)
As a tech-focused company, Microsoft has benefited from digitization and the shift to working from home
that was accelerated by the pandemic. Since 2017, revenue has grown by at least 10% every quarter and
that has continued this year. Microsoft Teams, the company’s virtual collaboration tool, now has over 145
4million daily active users around the world. This is up from just 32 million daily active users back in March
of 2020. Microsoft management believes that the pandemic will forever change how people work and learn,
and that their software and cloud services will enjoy improving
fundamentals from this change in the long term. Azure cloud Top 10 Equity Holdings % Assets
revenue has grown over 40% every quarter for well over three UnitedHealth Group Inc. 6.1
years now. As the second largest cloud player in the world, Mastercard Inc. 5.8
Microsoft’s scale in the Cloud industry will be hard for smaller
Microsoft Corp. 5.6
competitors to replicate any time soon.
Medtronic PLC 3.9
Philip Morris International, Inc. (PM) Philip Morris International 3.2
Philip Morris is executing on their transition towards more Bank of America Corp 3.2
smoke-free products. The success of their heated tobacco Bank of New York Mellon Corp 2.9
product IQOS has led their smoke-free portfolio to account for Johnson & Johnson 2.9
nearly 30% of total revenues. Management expects that heat- Kroger Co. 2.9
not-burn products will account for about 40% of total revenue
Visa, Inc. 2.7
by 2023. Volumes for their IQOS device are growing in the
double-digit percentages every quarter. Philip Morris is targeting a compound annual growth rate for EPS
of 9% from 2021 through 2023. The company maintains a strong dividend with a yield that has remained
above 4% since 2018 and they have increased the payout for 12 consecutive years. It ranks as one of the top
performing stocks in the market since 1926.
Biogen, Inc. (BIIB)
Biogen stock had an incredible quarter and was up 24.24% due to the approval of their Alzheimer’s drug
Aduhelm. This is the first new treatment approved for Alzheimer’s in nearly two decades. Alzheimer’s is
the sixth leading cause of death in the US and affects more than 30 million people worldwide. Due to few
treatment options for the disease, Biogen anticipates that Aduhelm will grow into a multibillion-dollar
product over the next several years. Bernstein analysts estimate that Aduhelm could reach peak sales of $10
billion, which would lead to record levels of revenue for Biogen. Along with their work on Aduhelm, Biogen
will continue to invest in other areas of need such as neurodegenerative diseases and retinal disorders. The
company expects to invest $2.3 billion to $2.4 billion into research and development in 2021. Biogen is
committed to returning capital to shareholders through share repurchases as they have $4 billion of
authorized share repurchases remaining.
Alphabet, Inc. (GOOGL)
Alphabet continues to benefit from the strength of Google Search, which controls over 90% of the global
online search market. There are over four billion internet users worldwide and Google is the dominating
presence in the global online space. Alphabet owns Google.com and YouTube.com, the #1 and #2 most
visited websites in the world. Google gathers large amounts of data from their users, enabling them to
advertise more effectively than their competitors. Alphabet benefits from a network effect and as their
userbase grows, more advertisers will be drawn to their services. They maintain a solid balance sheet with
over $120 billion in cash, allowing them to continue to invest in new products and technologies such as
their cloud service which is now a top five player globally. Alphabet is also actively investing in the areas
of drone delivery, autonomous vehicles and quantum computing. The company is buying back $50 billion
of their stock.
UnitedHealth Group, Inc. (UNH)
As the largest private health insurance provider in the US, UnitedHealth has proven to be resilient to
uncertain market environments. The company also has a top three pharmacy benefits manager with
OptumRx. UnitedHealth’s integrated strategy has led to consistent performance with revenue growing every
quarter for over 20 years now, including during the 2008 financial crisis and the COVID-19 pandemic. The
company’s scale and integration also create cost advantages that make it hard for smaller competitors to
5take substantial market share. Analysts call for earnings per share of $18.57 for 2021 and $21.37 for 2022.
Management is targeting 13%-16% earnings growth for the long term. UnitedHealth recently announced
their plan to acquire Change Healthcare for $13 billion, which would strengthen their digital health
capabilities.
Detractors to the quarter: Our outlook on a cross section of positions with a negative impact on the
portfolio for the quarter ended 6/30/2021.
Discovery Communications, Inc. (DISCA)
Discovery has had dramatic moves in stock price this quarter, mainly due to a major blow up of the hedge
fund Archegos and the announcement of a merger with AT&T’s WarnerMedia. The combined company,
which should be finalized in a year, puts a current EBITDA multiple under 10x. Amazon just paid close to
40x for MGM. With lots of streaming competition, the market has been uncertain about how well Discovery
and WarnerMedia will perform. However, John Malone is a major investor with an excellent track record.
We have held his companies for over 20 years. We expect further consolidation in streaming with the new
Warner Bros. Discovery, an attractive candidate due to their global franchise.
Johnson & Johnson (JNJ)
Though Johnson & Johnson underperformed during the quarter, the company is seeing a boost to sales and
earnings as virus-related restrictions are lifted. The second quarter saw record levels of both sales and
earnings thanks in large part to previously deferred medical procedures being completed. Johnson &
Johnson expects to produce up to 600 million doses of its COVID vaccine in 2021 though, unlike Pfizer
and Moderna, they do not expect to make a profit on the sale of the vaccine. Management has increased
their full-year guidance and now expects EPS of $9.60-$9.70 and base business sales growth of 10.5%-
11.5%. Johnson & Johnson continues to invest heavily in their future growth with one of the top 10 largest
pharmaceutical pipelines in the world. The company also has a solid history of returning capital to
shareholders with 59 consecutive years of dividend growth.
Mastercard, Inc. (MA)
Concern over the Delta variant of COVID-19 spreading and hampering travel has been reflected in
Mastercard’s performance this quarter. Cross-border transactions have suffered. However, unless
lockdowns are reinstated, we don’t see Mastercard’s growth slowing down. They continue to be a duopoly
with Visa, controlling the toll road of payments. They are relentlessly focused on the future. Mastercard’s
CEO was quoted saying, “If you wandered around the office and asked people, from the junior most
employee, to the employee who has been here 35 years, ‘what do you think Mastercard’s mission is?’ they
will say ‘killing cash.’ It’s embedded in everything that we’re doing. And it’s not mixed in with other things.
Our mission is to kill cash.”
Abbott Laboratories (ABT)
After having benefited from COVID testing this past year, Abbott Labs fell when it guided for lower
earnings due to decreased demand in equipment. Abbott has a fortress balance sheet and has grown
earnings at 17% annually over the last five years. Innovative products like the FreeStyle Libre blood glucose
monitor franchise continue to drive growth. Healthcare stocks in general have lagged this year and we see
many names that sell at the cheapest valuation versus the market in over 20 years, despite favorable demand
demographics.
Corning Incorporated (GLW)
Corning pared back gains after having a nice 25% runup from the start of the year. Corning makes
everything from the glass that is on iPhones, to pharmaceutical vials, to their largest business segment,
which is focused on 5G specialized fiber, an area of strong future growth. Their advanced fiber technology
is only matched by one other competitor, YOFC, who charges more for a similar product.
6In Closing
We strongly believe that investing is “the craft of the specific.” There has been such a proliferation of
passive pools and ETFs that nobody truly knows what they own. The real advantage of following an active,
rigorous research approach covering hundreds of individual companies and managements comes when we
hit long periods of flat to declining markets. In the 20th century, the Dow went up 180-fold. However, while
the market rose for 43.75 years it was down for 56.25 years. During the period 1900-1921 the Dow rose
from 66 to 71, less than 10% over 21 years. Between September 1929 and December 1948, the Dow declined
from 381 to 180, over 50% in 19 years. For the years 1964-1981 the Dow gained one point from 874 to 875.
More recently Tokyo’s Nikkei 225 plunged from a high of 38,915 at year-end 1989 to 7,862 by March of
2003. Being passive works great in raging bull markets, but in the flat-to-down periods returns are much
more dependent on well-researched individual buys. Knowing intimately what you own, what to buy and
when to buy is where the years of cumulative knowledge become valuable.
We appreciate your trust.
Jeff Auxier
Before investing you should carefully consider the Fund’s investment objectives, risks, charges and
expenses. This and other information is in the prospectus, a copy of which may be obtained by calling
(877) 328-9437 or visiting the Fund’s website. Please read the prospectus carefully before you invest.
Fund returns (i) assume the reinvestment of all dividends and capital gain distributions and (ii) would
have been lower during the period if certain fees and expenses had not been waived. Performance
shown is for the Fund’s Investor Class shares; returns for other share classes will vary. Performance
for Investor Class shares for periods prior to December 10, 2004 reflects performance of the
applicable share class of Auxier Focus Fund, a series of Unified Series Trust (the “Predecessor
Fund”). Prior to January 3, 2003, the Predecessor Fund was a series of Ameriprime Funds. The
performance of the Fund’s Investor Class shares for the period prior to December 10, 2004 reflects
the expenses of the Predecessor Fund.
The Fund may invest in value and/or growth stocks. Investments in value stocks are subject to risk that their
intrinsic value may never be realized and investments in growth stocks may be susceptible to rapid price
swings, especially during periods of economic uncertainty. In addition, the Fund may invest in mid-sized
companies which generally carry greater risk than is customarily associated with larger companies.
Moreover, if the Fund's portfolio is overweighted in a sector, any negative development affecting that sector
will have a greater impact on the Fund than a fund that is not overweighted in that sector. An increase in
interest rates typically causes a fall in the value of a debt security (Fixed-Income Securities Risk) with
corresponding changes to the Fund’s value.
Fund holdings and sector allocations are subject to change and should not be considered a recommendation
to buy or sell any security.
Foreside Fund Services, LLC, distributor.
The S&P 500 Index is a broad-based, unmanaged measurement of changes in stock market conditions based
on 500 market-capitalization-weighted widely held common stocks. The Dow Jones Industrial Average is a
price weighted index designed to represent the stock performance of large, well-known U.S. companies
within the utilities industry. The S&P 500 Equal Weight Index (EWI) is the equal-weight version of the
7widely used S&P 500. The index includes the same constituents as the capitalization weighted S&P 500,
but each company in the S&P 500 EWI is allocated a fixed weight (0.2%) of the index total at each quarterly
rebalance. The MSCI Emerging Market Index captures mid and large caps across more than two dozen
emerging market countries. The index is a float-adjusted market capitalization index and represents 13%
of global market capitalization. The 60/40 Hybrid of S&P 500 and Bloomberg Barclays U.S. Aggregate
Bond Index is a blend of 60% S&P 500 Composite Index and 40% Barclays U.S. Aggregate Bond Index, as
calculated by the adviser, and is not available for direct investment. The Bloomberg Barclays US Aggregate
Bond Index, or the Agg, is a broad base, market capitalization-weighted bond market index representing
intermediate term investment grade bonds traded in the United States. The Russell 1000 Value Index refers
to a composite of large and mid-cap companies located in the United States that also exhibit a value
probability. The Russell 1000 Growth Index measures the performance of the large cap growth segment of
the US equity universe. It includes those Russell 1000 companies with higher price-to-book ratios and
higher forecasted growth values. One cannot invest directly in an index or average.
EBITDA, or earnings before interest, taxes, depreciation, and amortization, is a measure of a company's overall
financial performance and is used as an alternative to net income in some circumstances.
Earnings per share (EPS) is calculated as a company's profit divided by the outstanding shares of its common stock.
The price-to-earnings ratio (P/E ratio) is the ratio for valuing a company that measures its current share price relative
to its per-share earnings (EPS).
The Consumer Price Index (CPI) is a measure that examines the weighted average of prices of a basket of consumer
goods and services, such as transportation, food, and medical care.
Return on invested capital (ROIC) is a calculation used to assess a company's efficiency at allocating the capital under
its control to profitable investments.
The views in this shareholder letter were those of the Fund Manager as of the letter’s publication date and
may not reflect his views on the date this letter is first distributed or anytime thereafter. These views are
intended to assist readers in understanding the Fund’s investment methodology and do not constitute
investment advice.
8You can also read