Widening the coverage of PAT Scheme Sectoral Manual - Ceramic industry - Shakti Sustainable Energy Foundation - TERI
←
→
Page content transcription
If your browser does not render page correctly, please read the page content below
Project code: 2012IB17
                                 Final Report

Widening the coverage of PAT Scheme

 Sectoral Manual - Ceramic industry

               Prepared for
 Shakti Sustainable Energy Foundation

                   I
D isclaimer

This report is part of Shakti Sustainable Energy Found ation (SSEF) and The Energy and
Resources Institute‟s (TERI) attem pt to stud y the ceram ic sector energy consum ption trend s
and energy efficiency improvem ent opportunities in the ceramic sector in Ind ia. The view s
expressed in this d ocum ent d o not necessarily reflect the view of Shakti Sustainable Energy
Found ation. The organization accepts no liability for the content of this d ocum ent, or for the
consequences of any actions taken on the basis of the inform ation provid ed . While every
care has been taken in com piling this report, TERI and Shakti Sustainable Energy
Found ation accepts no claim for any kind of compensation, if any entry is w rong,
abbreviated , om itted or inserted incorrectly either as to the w ord ing space or position in the
report.

                                                 I
Acknow ledgements
The Energy and Resources Institute (TERI) places on record its sincere thanks to the Shakti
Sustainable Energy Found ation for provid ing opportunity to und ertake the stud y on
“Wid ening the coverage of PAT schem e for Ceram ic Sector” w hich w as quite challenging
and very interesting. The conclusions of this stud y are expected to support the Foundation
w hich is active on the areas to strengthen the energy security of Ind ia by aid ing d esign and
im plem entation of policies that support energy efficiency and renew able energy.
The Energy and Resources Institute (TERI)
IITab l e o f Co n te n ts
D ISCLAIMER .......................................................................................................................I
A CKN OWLED GEMEN TS ................................................................................................... II
T A B LE O F C O N T EN T S .............................................................................................. III
LI S T O F T A B LES ......................................................................................................... IV
LI S T O F F I G U R ES ......................................................................................................... V
EXEC U T I V E S U M M A R Y ............................................................................................... 1
1.0 I N T R O D U C T I O N ............................................................................................................ 2
2.0 O V ER V I EW O F C ER A M I C I N D U S T R Y ..................................................................... 4
2.1 Sector im portance .................................................................................................... 4
2.2 Global tile ind ustry .................................................................................................. 4
2.3 Indian Ceram ic Industry ......................................................................................... 7
2.4 Ind ian Market Scenario ........................................................................................... 8
2.4.1 Present scenario ............................................................................................ 8
2.4.2 Grow th in past and future prospective ..................................................... 9
2.5 Prod uction d ata ....................................................................................................... 10
2.6 Im portant Stakeholders .......................................................................................... 10
2.7 Prod uct categorization ........................................................................................... 10
2.8 Major players ........................................................................................................... 11
2.9 Regulatory/ Policy Scenario .................................................................................. 11
3.0 EN ER G Y P ER FO R M A N C E ........................................................................................... 13
3.1 Sectorial level energy perform ance in recent years .......................................... 13
3.2 International com parison ....................................................................................... 16
3.3 Technological m ovem ents ..................................................................................... 17
3.4 Capacity utilization ................................................................................................. 17
3.5 Major energy consum ing areas ............................................................................. 17
3.6 Energy saving potential and m ajor areas ............................................................ 18
4.0 A N ALYSIS OF EN ERGY CON SUMPTION D ATA .............................................................. 19
4.1 Method ology ............................................................................................................ 19
4.2 Estim ated energy consum ption of m ajor ind ustries .......................................... 19
4.3 Possible energy efficiency m easures for key processes/ system s .................... 22
5.0 CON CLUSION S ................................................................................................................. 23
6.0 REFEREN CES .................................................................................................................... 25
IIILi s t o f Tab l e s
Table 2.2.1 : Global Prod uction of Top Manufacturing Countries ........................................ 5
Table 2.2.2 : Global Consum ption of Top 10 Countries .......................................................... 5
Table 3.1.1 : Specific Energy Consum ption in ceramic tiles and sanitaryw are
manufacturing ....................................................................................................... 15
Table 3.2 : Com parison of SEC Level of Other Countries ................................................... 16
Table 3.4 : Capacity Utilization of Major Players in Ceramic Ind ustry ............................ 17
Table 4.1 : SEC Range of ceram ic prod ucts ........................................................................... 19
Table 4.2.1 : Estim ated energy consu m ption of major ceramic ind ustries .......................... 20
Table 4.2.2 : Distribution of Units Based on Energy Consum ption ..................................... 21
VIILi s t o f Fi g u re s
Figure 2.2.1 : World Ceram ic Trad es .......................................................................................... 4
Figure 2.2.2 : Global Prod uction Scenarios ................................................................................ 5
Figure 2.2.3 : Global consum ption scenarios ............................................................................. 6
Figure 2.2.4 : Global Per Capita Consum ption of Tile (MSM) ................................................ 6
Figure 2.3 : Ind ia‟s Exports and Imports of Ceram ic Prod ucts ............................................ 8
Figure 2.4.1 : Market Shares of Tile Prod ucts by Value (2012) ................................................ 8
Figure 2.4.2 : Market Sizes of Ceramic Tiles (Volum e & Value) ............................................. 9
Figure 2.5 : Ind ian Ceramics Production d ata ...................................................................... 10
Figure 2.8 : Market Share of Major Players in Ceramic Ind ustry ...................................... 11
Figure 3.5 : Energy Breakup of Ceram ic Ind ustry ............................................................... 17
Figure 5.0 : Proposed threshold lim it for ceramic ind ustry ................................................ 23
VIILi s t o f A b b re v i ati o n s
BEE – Bu reau of Energy Efficiency
BSM – Billion Squ are Meter
CAGR – Com p ou nd Annu al Grow th Rate
CGRI – Ceram ic & Glass Research Institu te
CII – Confed eration of Ind ian Ind u stries
CMIE – Centre for Monitoring Ind ian Econom y
CTA – Cu stom s Tariff Act
CWF – Clim ate Works Fou nd ation
DC – Designated Consu m er
DIC – Directorate of Ind u stries and Com m erce
ESCerts – Energy Saving Certificates
FH RAI – Fed eration of H otel and Restau rant Associations of Ind ia
IBEF – Ind ia Brand Equ ity Fou nd ation
ICCTAS – Ind ian Cou ncil of Ceram ic Tiles and Sanitaryw are
ICRA – Ind ian Cred it Ratings Agency
ITC – International Trad e Centre
MSF – Million Squ are Feet
MSM – Million Squ are Meter
toe – Tonnes of Oil Equ ivalent
MT – Metric Tonnes
MTPA – Metric Tonnes Per Annu m
N APCC – N ational Action Plan on Clim ate Change
N MEEE – N ational Mission on Enhanced Energy Efficiency
PAT – Perform Achieve & Trad e
RSIDICL – Rajasthan State Ind u strial Develop m ent and Investm ent Corp oration Lim ited
SCM – Stand ard Cu bic Meter
SEC – Sp ecific Energy Consu m p tion
SIDBI – Sm all Ind u stries Develop m ent Bank of Ind ia
SME – Sm all and Med iu m Enterp rises
SSEF – Shakti Su stainable Energy Fou nd ation
TERI – The Energy & Resou rces Institu te
TPA – Tonnes Per Annu m
VFD – Variable Frequ ency Drive
VIIExe cu ti v e S u mmary
The ceram ic ind ustry in Ind ia is about 100 years old . Ceram ic prod ucts are m anufactured
both by large and sm all enterprises w ith w id e variance in type, size and stand ard s. Though
ceram ic m anufacturing units are spread across Ind ia, m ost of the units are co ncentrated in
Morbi, Surend ranagar and Khurja. Only a few units have a state-of-the-art-technology, and
m anufacturing facilities for prod uction of quality ceram ic good s. All sub -segm ents of Indian
ceram ic ind ustry, viz., tiles, sanitary w are, tablew are, or nam ental w are, etc have both
organised and unorganised players, w ith the latter having substantial share in prod uction.
The ceram ic tile ind ustry in Ind ia em erged in the late 1950s w ith H &R Johnson setting up its
plant for m anufacture of w all tiles at Thane. This w as follow ed by Som any Pilkington,
Spartek Ceram ics, Regency Ceram ics, Kajaria Ceram ics, Murud eshw ar Ceram ics, Bell
Ceram ics and m any others. The ceram ic tile ind ustry can be broad ly categorised into w all
tile, floor tile, vitrified tile and ind ustrial tile segm ents. Their m arket shares (in value term s)
are estim ated to be around 20%, 23%, 50%, and 7% respectively. The tiles are available in a
w id e variety of d esigns, textures and surface effects. They cater to tastes as varied from
rustics to contem porary m arble d esigns in super glossy m irror finishes. The potential for the
ind ustry is significant consid ering the per capita consum ption of ceram ic tiles in Ind ia.
Currently it is at 0.50 square m eters per person in com parison to over 2 square m eters per
person in peer countries like China, Brazil and Malaysia.
In Ind ia there are about 13 m ajor ceramic players in organized sector and 25 ceram ic plants
in unorganized sector w ith capacities varying from 1.6 to 54 million square m etres (MSM).
The average capacity utilization of the m ajor players in ceram ic ind ustry is about 75%. The
energy consum ption of the ceramic ind ustry is d epend ent on different factors such as type
of prod ucts, capacity utilization, type of fuels used , technology ad opted , etc. The estim ated
annual energy consum ption of these 38 ceramic plants varies betw een 3000 toe to 50000 toe.
Of these, the annual energy consum ption of 36 plants is estimated to be more than 5000 to e.
This energy consum ption level is m ore than the m inim um annual energy consum ption for
d esignated consum ers (DCs) set for textile ind ustries. Therefore it is suggested that these 36
plants may be includ ed as DCs und er the PAT schem e w ith a threshold limit of 5000 toe as
the m inim um annual energy consum ption per plant (figure 6.1). There exists an energy
saving potential of 5–14% by ad option of energy efficiency m easures in process and utilities.
11.0 In tro d u cti o n
The Ministry of Pow er and BEE are entrusted w ith the im plem entation of the N MEEE under
N APCC. One of the key com ponents of the mission is PAT mechanism . This is a m arket
based m echanism to im prove the energy efficiency in large energy intensive ind ustries and
facilities cost-effectively by certifying energy savings that could be trad ed . The PAT
m echanism is d esigned to facilitate the DC‟s to achieve their legal obligations und er the EC
Act in 2001, w hich w as later am end ed in 2010.
The ensuing PAT scheme applies to 8 ind ustrial sub-sectors, w hich are Pow er Plant,
Alum inium , Pulp & Paper, Chlor- Alkali, Cement, Iron & Steel, Textile and Fertilizer.
During the first phase of the PAT cycle (3 years starting from 1st April 2012), as per the
recent notification, about 478 DC‟s have been id entified . They are obliged to red uce their
energy consum ption by a specific target given by BEE. The expected energy savings from
this schem e is about 6-8 m illion Mtoe in this period . The over achievers w ill earn trad able
ESCerts w hereas und er achievers w ill be liable to com ply the sam e through purchase of
ESCerts or by paying penalty.
The BEE plans to w id en the coverage of the PAT schem e, in subsequent phases, by ad ding
m ore new ind ustrial subsectors d epending on energy consum ption. For new ind ustrial
segm ents there is a need to stud y the energy consum ption in d etail to establish the threshold
lim it for the eligibility for DCs. SSEF operates as a partner institution of the CWF and h as
been focusing its efforts on clean and secured energy future for all in Ind ia. SSEF in
consultation w ith TERI is assisting BEE in w id ening the net of the PAT schem e by ad d ing
new subsectors in subsequent phases of the PAT schem e. Und er this, SSEF has id entified
four subsectors to stud y the energy consum ption in d etail so as to establish the threshold
lim it for the eligibility as DCs. The id entified ind ustrial subsectors for the stud y are given
below .
Copper
Zinc
Glass
Ceram ics
Sugar
Vegetable oil refineries
Mapping the id entified four sub sectors in the Ind ian context and preparing broad sectoral
report is the initial task. This subsector overview report covers inform ation on large &
m ed ium m anufacturers, num ber of plants existing, prod uction capacity, technology types
and technological d evelopm ent in the last d ecad e, capacity utilization, energy efficiency
levels, estim ated energy saving potential and regulatory and policy issues having a bearing
on im proving the efficiency in the sector.
The purpose of the sectoral report is m ainly to und erstand the energy intensity of the
subsector, technology adopted and its energy efficiency levels. It also assesses the potential
for red uction in energy consum ption across the subsector and technological gaps. It
provid es an overall energy scenario about the subsector to all the stakehold ers. This
overview report is prepared based on secondary inform ation available in public d om ain.
2Introduction
Inform ation and d ata w ere also collected based on inter actions w ith ind ustrial associations
of the subsector. The report consists of the follow ing chapters:
Overview of the Ceram ic Sector
Sector Energy Consum ption
Policy and Regulatory aspects
Conclusions
32.0 O v e rv i ew o f Ce ram i c In d u s try
2.1 Sector importance
Ceram ic Ind ustry in India is about 100 years old and has played a m ajor role in the progress
of hum ankind . It com prises m ainly ceramic tiles; sanitary w are & tablew are. Ceram ic
prod ucts are m anufactured both in organized and unorganized sector w ith w id e variation in
type, size, quality and stand ard . As on 2012, Ind ia‟s share of w orld prod uction is 600 MSM
and ranks at 3rd position in the w orld in term s of prod uction. Global ind u stry grow th rate
is 11% and grow th rate in India d om estic m arket is 15% as on 2012. A total of over 5, 50, 000
people are em ployed in the sector. Ceramic sector m akes an im portant contribution to the
econom y, housing sector, export earnings and employm ent of India. With the grow th in the
housing sector the d em and of ceram ics is expected to increase consid ering the
com petitiveness of Ind ian tiles in the international m a rket. The potential is huge consid ering
the present per capita consum ption (0.50 square m eters per person) of ceram ic tiles in Ind ia
in com parison to over 2 square m eters per person for countries like China, Brazil and
Malaysia.
2.2 Global tile industry
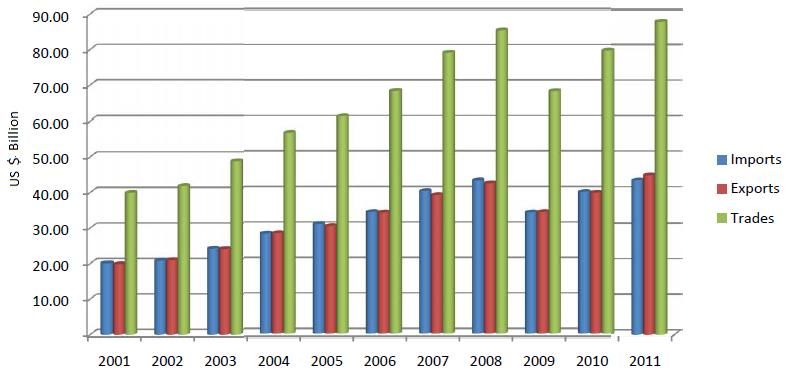
During the period from 2001 to 2011, total ceram ics trad e grew at a CAGR of 7.56%, from
US$ 39.6 billion to US$ 87.9 billion. During the period exports increased from US$ 19.8
billion to US$ 44.6 billion (CAGR of 7.74%), w hile im ports increased from US$ 19.9 billion to
US$ 43.2 billion (CAGR of 7.38%). China is the largest trad er of ceram ics in the w orld , w ith
total trad e of US$ 14.7 billion d uring 2011, follow ed by US and Germ any, Italy w ith total
trad e of US$ 7.4 billion, US$ 7.0 billion and US$ 6.18 billion, respectively.
Source: ITC, Geneva
Figure 2.2.1: World Ceram ic Trad es
4Overview of Ceramic Industry
Table 2.2.1: Global Prod uction of Top Manufacturing Countries
In MSM
Country 2008 2009 2010 2011 2012
China 3400 3600 4200 4800 5200
Brazil 713 715 753 844 866
Ind ia 390 490 550 617 691
Iran 320 350 400 475 500
Sp ain 495 324 366 392 404
Italy 513 368 387 400 367
Ind onesia 275 278 287 317 330
Vietnam 270 295 375 380 298
Tu rkey 225 205 245 260 280
Mexico 223 204 210 219 229
Total World Prod u ction 8594 8581 9619 10596 11166
Source: Ceramic W orld Review
Source: Ceramic World Review
Figure 2.2.2: Global Prod u ction Scenarios
In 2012 w orld tile prod uction crossed 11 BSM m ark to reach at 11166 MSM. Asia prod uced
7674 MSM – up 6.4% over 2011.
Table 2.2.2: Global Consum ption of Top 10 Countries
In MSM
Country 2008 2009 2010 2011 2012
China 2830 3030 3500 4000 4250
Brazil 605 645 700 775 803
Ind ia 403 494 557 625 681
Iran 265 295 335 395 375
Ind onesia 262 297 277 312 340
5Wid ening the coverage of PAT Schem e – Ceram ic Ind u stry
In MSM
Country 2008 2009 2010 2011 2012
Vietnam 220 240 330 360 247
Sau d i Arabia 136 166 182 203 230
Ru ssia 191 139 158 181 213
USA 211 173 186 194 204
Mexico 177 163 168 177 187
Total World Consu m p tion 8373 8525 9468 10432 10912
Source: Ceramic W orld Review
Source: Ceramic W orld Review
Figure 2.2.3: Global consu m p tion scenarios
The breakd ow n in consum ption by geographical area is very sim ilar to that of prod uction.
In Asia, the consum ption grew at 4.4% in the year 2012. Global per capita consum ption of
tile is given in figure 2.2.4 below .
Source: Ceramic W orld Review
Figure 2.2.4: Global Per Cap ita Consu m p tion of Tile (MSM)
6Overview of Ceramic Industry
2.3 Indian Ceramic Industry
(i) Ceramic tiles
Ind ian tile ind ustry is 681 MSM as of March 2013. Ind ustry size is estim ated to be Rs 19500
Crores as of March 2013. The ind ustry has been grow ing at a CAGR of 13 – 14% per annum
in last 4 – 5 years. The grow th of the unorganized sector w hich accounted for 60% of total
prod uction bears testim ony of the attractive returns from the ind ustry. The organized sector
accounted for 40% of total prod uction. Ind ustry ranks in the top 3 in term s of prod uction in
the w orld . Market share of India has risen from a little over 2.7% to 5.6% in term s of ceramic
tile prod uction.
(ii) Sanitaryw are
The sanitaryw are ind ustry in Ind ia is clearly d ivid ed into tw o sectors, the organized and
unorganized sectors. In the form er, H ind w are is m arket lead er w ith tw o factory locations
follow ed by Roca w hich has 4 plants in India. Other large players in this ind ustry are
Kohler, Cera, and Duravit. With a total num ber of nine units, prod uction capacity totals
150000 Million TPA, the actual prod uction, how ever, stand s at around 125000 Million TPA.
In the unorganized sector around 250 com panies prod uce basic sanitaryw are und er various
brand nam es. Their production capacity totals 500 000 Million TPA, although actual annual
prod uction reaches 400 000 Million TPA. They are concentrated in Gujarat because of
availability of cheap raw m aterials and low overhead s and hence sell their prod ucts in the
d om estic m arket cheaper than the prod ucts of the organized sector. The ind ustry has been
grow ing by about 15-18% over the last tw o years. The sanitaryw are ind ustry in Ind ia has
show n d ram atic grow th over the last 5 years, w ith m ajor players d oubling their prod uction
capacity. The current m arket size of ind ustry is estim ated at Euro 350 million.
(iii) Tablew are
Ind ia is exporting bone china tablew are to all the European countries includ ing UK, Canad a,
Australia and Egypt etc. At present prod uction capacity of bone china tablew are in Ind ia is
200 MTPD and nearly 25% of total prod uction is exported . N ew bone china units in Ind ia are
using latest technology and equipm ent and even old stonew are ind ustry has com e up a long
w ay. N ow w ith latest technologies and upgrad ed m achineries it is read y to becom e the
lead ing supplier of quality prod ucts to the w orld in 21st Century.
The intrinsic fund am entals of this fast grow ing segm ent are estim ated to give around 8% to
10% grow th for the next d ecad e. Though select players, especially new entrants w ho come in
w ith the right strategy to tap such a highly fragmented m arket can look at m ore than 15%
grow th for at least 3 to 4 years over existing base. The key point is also that though the
m arket is not nascent it has huge untapped potential. Grow th is m ore in the organized
retail segm ent though on a m uch sm aller base but its share of th e m arket is around 9.5% and
grow ing. Alm ost 50% of the m arket is com prised of organized players, w ith brand s like
Yera, Ocean, Lum inarc, La Opala, JCPL, Bharat, Corelle, Treo and other. Ind ia‟s share of
exports and im ports in recent years is given in figur e 2.3 below .
7Wid ening the coverage of PAT Schem e – Ceram ic Ind u stry
900
800
700
600
US $ mn
500
400
300
200
100
0
2007 2008 2009 2010 2011 2012
Exports Imports
Source: India Trade Statistics
Figure 2.3: Ind ia‟s Exp orts and Im p orts of Ceram ic Prod u cts
2.4 Indian Market Scenario
2.4.1 Present scenario
Over the years, the ind ustry has been m od ernizing through new innovations in prod uct
profile, quality and d esign to em erge as a m od ern, w orld -class ind ustry, to take on global
com petition. The Indian Ceram ic Ind ustry ranks at 3rd position in the w orld and prod uces
around 6.3 % of global output as on 2013. The m arket shares in value terms for the main
prod uct segm ents are given in figure 2.4.1.
Industrial Tiles,
Floor Tiles, 7%
23%
Wall Tiles, 20%
Vitrified Tiles,
50%
Source: ICCTA S
Figure 2.4.1: Market Shares of Tile Prod u cts by Valu e (2012)
The Organized / N ational sector consists of 14 m ajor players and their share of prod uction is
40 %. The unorganized / regional sector consists of approxim ately 200 units (70% based in
Gujarat) and their share of prod uction is 60%.
8Overview of Ceramic Industry
2.4.2 Grow th in past and fu tu re prospective
Global tiles m arket has w itnessed ups and d ow ns in the last few years d ue to 2009 crisis.
H ow ever, the global tiles m arket has show n an upw ard trend since 2010 w ith the m ajor
d em and coming from em erging econom ies. The grow ing real estate m arket in countries
such as Brazil, Ind ia, China and Ind onesia has led to the d em and for tiles. During 2011, India
w as the 20th largest ceram ic trad ing nation in the w orld and accounted for a share of around
1% in total ceramics trade. During the period , from 2001 to 2011, Ind ia‟s ceram ics trad e
increased from US$ 143 m illion to US$ 984 m illion at a CAGR of 23.4%. The increase in trad e
w as led by rise in im ports, w hich increased , from US$ 68.7 m illion in 2001 to US$ 750.9
m illion in 2011, at a CAGR of 26.3%. Ind ia‟s ceramic exports on th e other hand increased at a
CAGR of 11.6%, from US$ 82.3 m illion to US$ 233.3 m illion.
As on 2012, the global and Ind ian d om estic m arket CAGR are 11 % & 15 % respectively.
Accord ing to the recently published report by TechSci Research, “Ind ia Tiles Marke t
Forecast & Opportunities, 2017” tiles m arket in Ind ia is expected to w itness com pound ed
annual grow th rate of around 18% d uring 2012-2017. With the high number of people
m oving from rural to urban areas, increasing incom e, d em and for luxury housing and
d ropping prices of tiles has all led to the increased d em and for tiles in the country. Figure
2.4.2 below gives the recent trend s and projections in term s of volum e as w ell as by value.
Figure 2.4.2: Market Sizes of Ceram ic Tiles (Volu m e & Valu e)
9Wid ening the coverage of PAT Schem e – Ceram ic Ind u stry
2.5 Production data
Ind ia‟s ceramic prod uction figures over the last six years are given in figure 2.5 below .
700
Production, Million Sq. mt
600
500
400
300
200
100
0
2007 2008 2009 2010 2011 2012
Year
Source: Tile Today
Figure 2.5: Ind ian Ceram ics Prod u ction d ata
2.6 Important Stakeholders
The im portant stakeholders of this sector includ e ind ustry associations, governm ent bod ies,
m anufacturing facilities, equipm ent m anufacturers and raw m aterial suppliers. There are a
num ber of brick m anufacturing com panies w ho also form a part of the stakehold ers. Und er
the unorganized sector, Asian and Sum an are tw o of the m ajor stakeholders. Apart from
this, The Indian Council of Ceramic Tiles and Sanitaryware (ICCTA S) is another im portant
stakeholder. The purpose of this registered bod y is to spread aw areness on the benefits and
attributes of ceram ic tiles and sanitaryw are, w ork tow ard s establishing quality, service and
custom er orientation in the ind ustry. Mem bers of the council are all lead ing brand s and
organizations in the country, w hich follow the stand ard s, set by ICCTAS.
Other stakehold ers includ e the state w ise ind ustrial d evelopm ent d epartments like the
Directorate of Ind ustries and Com m erce (DIC), Tam il N ad u , Rajasthan State Ind ustrial
Developm ent and Investm ent Corporation Lim ited , Farm ers‟ Associations.
2.7 Product categorization
The broad categorisation of ceram ic based on the type of prod ucts is given below .
1. Wall tiles
2. Floor tiles
3. Vitrified tiles
4. Sanitary w are
10Overview of Ceramic Industry
2.8 Major players
N ational brands control over 50% of the ind ustry. The m arket share of major players in
Ind ian Ceram ic Ind ustry is given in figure 2.8.
4.1 Others
4.3
4.8 Kajaria Ceramics Ltd
21.9
HSIL Ltd
4.9
H & R Johnson India Ltd.
6.2 Somany Ceramics Ltd
Asian Granito India Ltd
7 14.9 Nitco Ltd
Orient Ceramics & Industries Ltd
7.3
Euro Ceramics Ltd
10.2 14.3 Bell Ceramics
Murudeshwar Ceramics Limited
Source: Prowess, CM IE
Figure 2.8 : Market Share of Major Players in Ceram ic Ind u stry
2.9 Regulatory/Policy Scenario
(i) Raw material availability
Feld spar and quartz are critical raw materials in the m anufacturing of ceram ic tiles and
sanitary w are. The global d em and for these rare m inerals has been grow ing forcing the
d om estic ind ustries to rely heavily on im ports of these inputs. The export of both raw
m aterials has gone up substantially and hence the Board of Indian Council of Ceram ic Tiles
and Sanitary w are (ICCTAS) has alread y appealed to the governm ent for ban on export of
these raw m aterials. Another issue faced by ceram ic prod uct m anufacturers is the curtailing
of im ports of Boric acid , used as an ad ditive to enhance glaze appearance and im prove
chem ical and m echanical d urability. But it is classified as insecticid e by the Central
Insecticid e Board and hence is not freely allow ed to be im ported .
(ii) High fuel prices
H igh fuel price, especially of natural gas, is a m ajor challenge faced by the ceram ic ind ustry,
and has been one of the key reasons affecting the profitability of the ceram ic ind ustry.
Analysis show s that the share of pow er, fuel and w ater expenses in total sales had gone up
from 10.8% in 2010-11 to about 13% in 2011-12.
(iii) D umping
One of the m ajor problem s faced by the Indian tile m anufacturers is d umping. Cheap
im ported vitrified tiles are being d um ped by countries such as China. Such cheap im ports
have threatened the viability, especially of units in the vitrified tile segm ent. Governm ent of
Ind ia had levied an anti-d um ping d uty on im port of vitrified tiles from China in 2003 based
on the find ings of anti-dum ping cases. Anti-d umping d uty w as im posed by the Governm ent
of India d uring May 2003 for d ifferent ceram ic prod ucts originating/ exported from China.
H ow ever, the anti-d um ping d uty has expired in June 2013.
11Wid ening the coverage of PAT Schem e – Ceram ic Ind u stry
(iv) Quality and scale economies
The ceram ic tiles ind ustry is d om inated by unorganized players w ith a m arket share of
approxim ately 60%. The m ajor ceram ic cluster is Morbi in Gujarat w hich still uses obsolete
technologies for prod uction and printing, except for few organised players.
123.0 En e rg y p e rf o rm an ce
3.1 Sectorial level energy performance in recent years
Ceramic Manufacturing Process:
Figure below show s the general process flow d iagram of ceram ic m anufacturing process.
(i) Raw Materials Procurement & Weighing
The raw m aterials used in the m anufacture of ceram ics range from relatively im pure clay
m aterials mined from natural d eposits to ultrahigh purity pow d ers prepared by chem ical
synthesis. N aturally occurring raw m aterials used to m anufacture ceram ics includ e silica,
sand , quartz, flint, silicates, and alum inosilicates. The first step in the process is to w eigh the
raw m aterials required to m anuacture a ceram ic tile includ ing all types of frit, feld spar and
various clays. All the raw m aterials are accurately w eighed , so that the quality of the
prod uct can be stabilized.
(ii) Fine Grinding & Milling
The basic beneficiation processes includ e crushing, grind ing, and sizing or classification.
Prim ary crushing is used to red uce the size of coarse m aterials, such as clays, d ow n to
approxim ately 1 to 5 centim eters. The m ost comm on types of crushers used are jaw crushers,
cone crushers, gyratory crushers, and roll crushers. Second ary crushing or grind ing red uces
particle size d ow n to approxim ately 1 m illim eter in d iam eter. Fine grind ing or m illing
red uces the particle size d ow n to as low as 1.0 m icrom eter in diam eter. Ball m ills are the
m ost com m only used piece of equipm ent for m illing.
(iii) Filter Press
During the process to m ake clay and ceramic slurries used for the m anufacture of
d innerw are, insulators, china etc, the clay slurry goes through a dew atering step prior to
further processing and m old ing into the desired form . These slurries are extrem ely d ense
and heavy and typically require d ew atering at 225 PSI feed pressure to obtain a solid cake.
13Widening the coverage of PAT Scheme – Ceramic cluster
(iv) Mixing
The purpose of m ixing or blunging is to com bine the constituents of a ceram ic pow d er to
prod uce a m ore chem ically and physically hom ogenous m aterial for forming. Pug mills
often are used for m ixing ceram ic m aterials. Several processing aids m ay be ad d ed to the
ceram ic m ix d uring the m ixing stage. Bind ers and plasticizers are used in d ry pow d er and
plastic form ing; in slurry processing, d eflocculants, surfactants, and antifoam ing agents are
ad d ed to im prove processing. Liquid s also are add ed in plastic and slurry processing.
Bind ers are polymers or colloid s that are used to im part strength to green or unfired ceramic
bod ies.
Mixing ensures a uniform d istribution of clay in the solution. It also prevents the
sed im entation of clay w hich is d esirable for the process of ceram ic form ation. Pug Mills are
m ost com m only used for m ixing in ceram ic production.
(v) Spray D rying
Ceram ic tiles are typically form ed by d ry pressing. Prior to pressing, m any facilities
granulate the ceramic mix to form a free-flow ing pow d er, thereby im proving handling and
com paction. The m ost com m only used m ethod of granulation is spray -d rying. The slurry is
injected into a d rying cham ber w ith hot gases. As the hot gases com e in contact w ith the
slurry, a pow d er is form ed and collected in a cyclone or fabric filter. Spray d ryers generally
are gas-fired and operate at tem peratures of 70° to 570°C. After spray d rying, the w ater
content of the granules is betw een 35-40%.
(vi) Pow der Storage
The granules have to be kept in a storage bin for a few days so that its com position becom es
even m ore hom ogeneous. This process m akes the granules m ore pliable and less likely to
stick to the m old . The size of pow d er storage bin need ed w ill be d eterm ined by the
prod uction capacity of the plant. Generally, the most suitable size is capable of hold ing 400
tons of pow d er.
(vii) Shaping
In the form ing step, the ceram ic m ix is consolid ated and m old ed to prod uce a cohesiv e bod y
of the desired shape and size. Form ing m ethod s can be classified as either d ry form ing,
plastic m old ing, or w et form ing. Once the com position of the pow d er becom es hom ogenous,
it is taken to the press w here it is m old ed and squeezed und er high pressure (of the ord er of
hund red s of tons) to form a biscuit or Greenw are tile bod y. The press can be for a sm all trim
tile or a m assive 24x24 inch tile.
(viii) Glazing
Glazes resem ble glass in structure and texture. The purpose of glazing is to provid e a
sm ooth, shiny surface that seals the ceram ic bod y. N ot all ceramics are glazed . Those that
are glazed can be glazed prior to firing, or can be glazed after firing, follow ed by refiring to
set the glaze.
(ix) Car Storage
After glazing, the biscuit is load ed into the stock car for storage, w hich is proceed ed by the
fully-autom atic hyd raulic controlled system.
14Energy Performance
(x) Speed Body D rying
The d rying process in the ceram ic ind ustry is the greatest energy consum er second to the
firing process. Drying means loss of m oisture from the su rface of the substance by
evaporation, and the d rying speed d epend s on the tem perature and hum id ity. When the
substance is d ried and moisture is lost, particles are put close to each other, resulting in
shrinkage.
(xi) Firing
Firing is the process by w hich ceram ics are therm ally consolid ated into a d ense, cohesive
bod y com posed of fine, uniform grains. This process also is referred to assintering or
d ensification. Ceram ics generally are fired at 50-75% of the absolute m elting tem perature of
the m aterial.
Ceram ic prod ucts also are m anufactured by pressure firing, w hich is sim ilar to the form ing
process of d ry pressing except that the pressing is cond ucted at the firing tem perature. The
application of pressure enhances the d ensification of the ceram ic d uring firing. Because of its
higher costs, pressure firing is usually reserved for m anufacturing ceramics that are difficult
to fire to high d ensity by conventional firing. In hot pressing, hyd raulic presses and graphite
d ies com m only are used . In hot isostatic p ressing, the pressing m edium typically is a gas,
such as argon or nitrogen.
(xii) Packing
The finished prod ucts are then packed and stored or shipped .
Energy Performance:
The prim ary energy use in ceram ic m anufacturing is for kiln. N atural gas, LN G and fuel oil
are em ployed for m ost drying and firing operations. N early 30 % of the energy consum ed is
used for d rying. Over 60 % of the energy consum ed is used for firing. The percentage of the
energy cost in the total ceram ic prod uction cost is betw een 5 and 20%, although it varies
accord ing to the prod uct type and fuel price. Percentage share of electrical and therm al
energy consum ption in a typical ceram ic ind ustry varies from 15 – 20% and 75 – 80%
respectively. Typical therm al and electrical specific energy consum ption range for d ifferent
sub processes/ kilns/ type of firing in ceram ic tile and sanitaryw are m anufacturing process is
given in table below .
Table 3.1.1 : Specific Energy Consum ption in ceram ic tiles and sanitaryw are m anufacturing
Particulars Unit Industry benchmark
Ceramic Tiles
Therm al Energy
1. Sp ray d rying kJ/ kg 980– 2200
2. Drying p rocess kJ/ kg 250 – 750
3. Firing
Tu nnel Kilns
Once fired tiles kJ/ kg 5400 – 6300
Twice fired tiles kJ/ kg 6000 – 7300
15Widening the coverage of PAT Scheme – Ceramic cluster
Particulars Unit Industry benchmark
Roller H earth Kilns
Once fired tiles kJ/ kg 1900 – 4800
Twice fired tiles kJ/ kg 3400 – 4600
Electrical Energy
1. Pressing kWh/ 50 – 150
kg
2. Drying kWh/ 10 – 40
kg
3. Firing kWh/ 20 – 150
kg
Sanitaryw are
Conventional Tu nnel Kiln kJ/ kg 9100 – 12000
Mod ern Tu nnel Kiln kJ/ kg 4200 – 6500
Roller H earth Kiln kJ/ kg 3500 – 5000
Mod ern Shu ttle Kiln kJ/ kg 8500 - 11000
The „specific energy consum ption ‟ (SEC) figures in ceram ic sector for d ifferent prod ucts
range are given in table 3.1.2. As there w as no energy consum ption d etails available for the
m ajor players in the public d om ain, below m entioned specific energy consum ption figures
w ere consid ered to estimate the energy consum ption for all the m ajor players based on the
available capacity d etails.
Table 3.1.2: Standard Specific Energy Consum ption Range for Ceram ic Prod ucts
Product Electrical energy Thermal energy*
Value Unit Value Unit
Vitrified tiles 3.71 – 5.01 kWh/ m 2 1.51 – 2.11 SCM/ m 2
Wall & floor tiles 1.51 – 1.92 kWh/ m 2 1.28 – 1.8 SCM/ m 2
Source: SEE – Tech Solutions Pvt. Ltd Report on Energy Conservation in Ceramic Sector
*N atural gas
3.2 International comparison
The SEC levels for w all and roof tiles in ceramic m anufacturing in Ind ia, China and Italy are
given in table 3.2.
Table 3.2: Com parison of SEC Level of Other Countries
Specific energy consumption
Electrical (kWh/tonne) Thermal (million
Country kcal/tonne)
Ind ia 210 1.34
China 259 1.05
Italy 139 1.16
Source: SIDBI Booklet
16Energy Performance
3.3 Technological movements
Tunnel kilns and roller hearth kilns (roller kilns) are used for continuous firing. The prim ary
ad vantages of tunnel kilns and roller kilns are low er energy consum ption and the ease w ith
w hich the ceram ics can be transported through the firing process w hen com pared to batch
type kilns. A large num ber of tunnel and roller kilns use natural gas as fuel. Bell and shuttle
kilns are used for batch type prod uction of ceramic prod ucts. The main advantage of batch
type kilns is that they can read ily accom m od ate changes in firin g tem perature profile and
cycle tim e to m atch the requirem ents of a w id e variety of ceramic prod ucts.
3.4 Capacity utilization
The average capacity utilization of m ajor players in ceram ic sector is about 75% (source:
Prow ess, CMIE d atabase). The capacity utilization of m ajor players is given in table 3.4.
Table 3.4 : Capacity Utilization of Major Players in Ceram ic Ind ustry
Sl. N o. Plant Capacity utilization
(%)
1. Kajaria Ceram ics Lim ited 68
2. H & R Johnson 72
3. Som any Ceram ics Ltd 91
4. N itco Ceram ics Ltd 74
5. Asian Granito Ltd *
6. RAK Ceram ics *
7. Orient Ceram ics & Ind u stries Ltd 81
8. Bell Ceram ics Ltd 84
9. Varm ora Granito Pvt Ltd NA
10. Regency Ceram ics NA
11. Mu ru d eshw ar Ceram ics Ltd 53
12. Eu ro Ceram ics 67
*Data N ot A vailable
3.5 Major energy consuming areas
Energy consum ption in ceram ic ind ustry d epend s on payload of ceramic prod ucts,
effectiveness and efficiency of various equipm ents. An ind ication of energy consum ption of
d ifferent processes in ceram ic prod ucts m anufacture is given figure 3.5.
Figure 3.5: Energy Breaku p of Ceram ic Ind u stry
17Widening the coverage of PAT Scheme – Ceramic cluster
3.6 Energy saving potential and major areas
The Indian ceram ic ind ustry offers significant scope for energy efficiency im provem ents.
Som e of the com m on technological options applicable for ceram ic ind ustry are given below .
Tunnel kiln.Waste heat recovery, low therm al m ass cars in sanitary-w are units, use of
hot air d irectly as com bustion air, use of hot air from cooling zone to preheat input
m aterial
Roller kiln.Maintain air-fuel ratio, im proving insulation, preheating of combustion air
using flue gases/ hot air from cooling zone, energy efficient burner that can hand le
high tem perature hot air
Ball mill/ blunger.Continuous m ulti-stage ball m ill
Spray dryer. fuel sw itching to N G
Use of „variable frequency d rive‟ (VFD) in ball mills, blunger and agitation m otors,
presses and blow ers
Use of energy efficient motors in agitation systems and polishing line
Im provem ent of kiln insulation
Solar preheating of spray d ryer input slurry
Biom ass/ briquette firing in hot air generator
Cogeneration system in N G based ceram ic ind ustries.
184.0 Analysis of energy consumption data
4.1 Methodology
The total energy consumption of individ ual ceram ic ind ustry is not read ily available. In
ord er to estim ate the energy consum ption follow ing assum ptions w ere m ad e.
Energy consum ption and prod uction d etails w ere not available for m ost of the plants
in unorganized sectors. Average specific energy consum ption figures for d ifferent type
of ceram ic prod ucts given in table 4.1 w ere used to estim ate the energy consum ption
of each plant w here d ata is not available.
Table 4.1: SEC Range of ceram ic prod ucts
Product Electrical energy Thermal energy *
Range Unit Range Unit
Vitrified tiles 3.71 – 5.01 kWh/ m 2 1.51 – 2.11 SCM/ m 2
Wall & floor tiles 1.51 – 1.92 kWh/ m 2 1.28 – 1.8 SCM/ m 2
*In terms of N atural Gas
Operating prod uction capacity w ere estim ated consid ering 75% capacity utilization
factor (Average capacity utilization am ong m ajor players based on CMIE Prow ess
d ata).
Estim ated Mtoe figures includ e both ow n plants and joint ventures as there w as no
separate d ata available. Wherever d ata is available separately for each plant, the sam e
d ata has been used .
In ord er to calculate the total energy consum ption in term s of Mtoe, the follow ing
m ethod w as ad opted .
There w ere no installed capacity/ prod uction d ata available separately for m ost of the
com panies m anufacturing sanitaryw are and tablew are. H ence the sam e w as not
includ ed in the report.
Total electrical energy consum ption (kCal)
= Installed capacity (m 2) X capacity utilization (%) X SEC (kWh/ m 2) X 860 (kCal/ kWh)
Total therm al energy consum ption (kCal)
= Installed capacity (m 2) X capacity utilization (%) X SEC (kCal/ m 2)
Total energy consum ption (MTOE)
= [Therm al energy consum ption (kCal) + Electrical energy consum ption (kCal)]/ 107
4.2 Estimated energy consumption of major industries
The estim ated annual energy consum ption of major ceram ic ind ustries in Ind ia covering
both organized and unorganized sector is given in table 4.2.1.
19Widening the coverage of PAT Scheme – Ceramic cluster
Table 4.2.1: Estimated energy consum ption of m ajor ceram ic ind ustries
Sl. Plant Capacity Energy Source
No Installed Production consumption
MSM MTPA MSM MTPA (Mtoe/year)
Organized sector
1. Kajaria Ceram ics Ltd , 21.5 - 16.1* - 39,410 CMIE Prow ess
Galip u r Unit, Rajasthan Data, Annu al
Rep ort
2. Kajaria Ceram ics Ltd , 8.4 - 6.3* - 13,230 CMIE Prow ess
Sikand rabad Unit, Uttar Data, Annu al
Prad esh Rep ort
3. H & R Johnson Ltd - 332720 - 276965 43,634 CMIE Prow ess
Data, Online
Data
4. Som any Ceram ics Ltd 19.147 - 14.4* - 35,096 CMIE Prow ess
Data, Annu al
Rep ort
5. N itco Ceram ics 8.085 - 6.1* - 14,820 CMIE Prow ess
Data, Annu al
Rep ort
6. Asian Granito Ind ia - - 5.2 - 13,084 BEE Energy
Lim ited Conservation
Aw ard
Docu m ent
7. RAK Ceram ics 10.5 - 7.9* - 19,247 Online Data
8. Orient Ceram ics & - 220000 - 184065 25,400 CMIE Prow ess
Ind u stries Ltd Data, Online
Data
9. Bell Ceram ics Ltd 10.837 - 8.1* - 19,864 CMIE Prow ess
Data, Online
Data
10. Varm ora Granito Ltd 150000 - 112500 16,801 Online Data
11. Regency Ceram ics - 9.3 - 22,741 CMIE Prow ess
Data, Online
Data
12. Mu ru d eshw ar ceram ics 11.4 - 4.1 - 10,018 CMIE Prow ess
Ltd Data, Online
Data
13. Eu ro Ceram ics - 151971 - 101940 16,039 CMIE Prow ess
Data, Online
Data
Unorganized Sector
14. Soriso Ceram ic Pvt Ltd 4.6 - 4.4 - 10,680 ICRA Rating
Pu blication
15. Jaxx Vitrified Pvt Ltd 5.7 - 5.5 - 13,513 Online Data
16. Vennar Ceram ics Pvt Ltd 2.3 - 2.2 - 5,340 Online Data
17. Cosa Ceram ics 2.7 - 2.5 - 6,137 Online Data
20Analysis of Energy Consumption data
Sl. Plant Capacity Energy Source
No Installed Production consumption
MSM MTPA MSM MTPA (Mtoe/year)
18. Antiqu e Marbonite Pvt 9.69 - 7.3* - 17,762 ICRA Rating
Ltd Pu blication
19. Cengress Tiles 2.38 - 1.785* - 4,363 Online Data
20. Regent Granito (I) Ltd 6.12 - 4.59* - 11,218 Online Data
21. Coral Ceram ics Pvt Ltd - 50000 - 37500* 5,900 Online Data
22. Coral Granito Pvt Ltd - 75000 - 56520* 8,850 Online Data
23. Senso Granito Pvt Ltd - 95000 - 71250* 11,211 ICRA Rating
Pu blication
24. Sentini Ceram ica Pvt Ltd 17 - 12.75* - 31,161 Online Data
25. Silica Ceram ica Pvt Ltd 8.67 - 6.50* - 15,892 Online Data
26. Asian Tiles Lim ited 27.54 - 20.655* - 50,481 ICRA Rating
Pu blication
27. Jalaram Ceram ics - 79000 - 59250* 9,323 Online Data
28. Su nshine Tile Co Pvt Ltd 20.4 - 15.3* - 37,393 Online Data
29. Sw astik Ceracon Ltd 10.2 - 7.65* - 18,697 Online Data
30. Um iya Ceram ics Pvt Ltd 1.663 - 1.24* - 3,048 Online Data
31. Oracle Granito Pvt Ltd , 4.76 - 3.57* - 8,725 Online Data
Gu jarat
32. Centu ry Tiles Ltd 6.12 - 4.59* - 11,218 Online Data
33. City Tiles Ltd 4.42 - 3.315* - 8,102 Online Data
34. Decolight Ceram ics Ltd 4.08 - 3.1* - 7,479 Online Data
35. Restile Ceram ics Ltd , 3.6 - 2.7* - 6,599 Online Data
H yd erabad , AP
36. Sorento Granito Pvt Ltd 4.08 - 3.1* - 7,479 Online Data
37. Victory Ceratech Pvt Ltd , 3.74 - 2.8* - 6,855 Online Data
Gu jarat
38. Sim p olo Vitrified Pvt Ltd 10.88 - 8.2* - 19,943 Online Data
*Production calculated based on 75% capacity utilization (A verage for M ajor Players based on CM IE Prowess Data)
Considered SEC – 21000 kCal/m2; 4 kW h/m2; 225 kW h/Tonne; 1.38 M illion kCal/Tonne;
The d istribution of the units based on total energy consum ption is given in table 4.2.2. As
can be seen, the energy consum ption of all the m ajor ceram ic ind ustries in organised as w ell
as unorganised sectors is estim ated to be m ore than 3000 m toe.
Table 4.2.2: Distribution of Units Based on Energy Consum ption
Range of energy consumption (toe) N umber of units
3000 – 5000 2
5001 – 10000 11
10001 – 15000 9
15001 – 20000 8
> 20000 8
21Widening the coverage of PAT Scheme – Ceramic cluster
4.3 Possible energy efficiency measures for key processes/
systems
The m ajor energy efficiency m easures in various processes as w ell as utilities in ceram ic
ind ustries are provid ed below .
(1) Kiln
Sw itching from intermittent type to continuous type kilns
Auto interlock betw een brushing d ust collection blow ers and glazing lines
Ad opting best operating practices includ ing optim izing of excess air levels
(2) Spray dryer
Replacing LPG firing w ith d iesel firing
Arresting air infiltration in spray d rier system
(3) Vertical dryer
Sw itch off chiller circuit w hen hyd raulic press is not in operation
Installing interlock to avoid id le operation of hydraulic press pum p
Apart from these, there are a num ber of energy con servation options in utilities that vary
from sim ple housekeeping m easures to sw itchin g over to energy efficient equipm ent that
can be ad opted by ceramic ind ustries.
225.0 Conclusions
In Ind ia there are about 13 m ajor ceramic players in organized sector and 25 ceram ic plants
in unorganized sector w ith capacities varying from 1.6 to 54 MSM. The average capacity
utilization of the m ajor players in ceram ic ind ustry is about 75%. The energy consum ption of
the ceramic ind ustry is depend ent on different factors such as type of products, capacity
utilization, type of fuels used , technology ad opted , etc. The estim ated annual energy
consum ption of these 38 ceram ic plants varies betw een 3000 toe to 50000 toe. Of these, the
annual energy consum ption of 36 plants is estim ated to be m ore than 5000 toe. This energy
consum ption level is m ore than the m inim um annual energy consum ption for d esignated
consum ers (DCs) set for textile ind ustries. Therefore it is suggested that these 36 plants m ay
be includ ed as DCs und er the PAT schem e w ith a threshold limit of 5000 toe as the
m inim um annual energy consum ption per plant (figure 5.0). There exists an energy saving
potential of 5–14% by adoption of energy efficiency m easures in process and utilities.
55000
50000
45000
40000
35000
30000
Mtoe
25000
20000
15000
10000
5000
0 5 10 15 20 25 30 35 40 45
0
Plant
Figure 5.0: Prop osed threshold lim it for ceram ic ind u stry
236.0 References
1. Ind ian Council of Ceramic Tiles and Sanitary w are (ICCTAS)
2. ITC, Geneva
3. Ceram ic World review
4. Exim Bank Analysis Report
5. Tiles Tod ay Magazine
6. Ind ia Brand Equity Found ation (IBEF)
7. SEE – Tech Solutions Report on Energy conservation in Ceramic Sector
8. SIDBI Booklet
9. Bureau of Energy Efficiency Energy Conservation Aw ard s Docum ents
10. Annual Reports of Major Players
11. Prow ess, CMIE
12. Ceram ic & Glass Research Institute, Kolkata
13. Sustainability Reports, other technical rep orts and w ebsites
25You can also read