Stronger-for-longer Oil Thesis Holds, But Canadian Diffs Will Remain Challenging - Real Estate Forums
←
→
Page content transcription
If your browser does not render page correctly, please read the page content below
Stronger-for-longer Oil Thesis Holds, But
           Canadian Diffs Will Remain Challenging
           The Global Crude Markets Continue To Look Positive, But
           Canada Has Real Headwinds That Shouldn’t Be Overlooked

CIBC Capital Markets                                                                                                                                          October 2018

Jon Morrison | +1 403 216 3400 | jon.morrison@cibc.com

FOR INSTITUTIONAL CLIENT USE ONLY. NOT FOR GENERAL DISTRIBUTION.
See "Important Disclosures" section at the end of this report for important required disclosures, including potential conflicts of interest.

See "Price Target Calculation" and "Key Risks to Price Target" sections at the end of this report, or at the end of each section thereof, where applicable.
Presentation Overview

A Breakdown Of What Is Included In This Deck

 • The Global Crude Picture: A Look At Balances (Pages 3-24)
 • Battle Of The Barrels: A Look At Canada’s Unique Headwinds (Pages 25 – 33)
   − Canadian Supply/Demand: WCSB Production Versus Pipeline, Refinery And Rail Capacity (Page 30)
   − Crude By Rail: A Look At The CBR Loadings Needed To Clear The Market (Page 31)
 • IMO 2020: Road To Perdition? (Pages 34 - 37)
Macro Commodity Outlook – Crude

Crude – The Price Action Reflects Physical Realities…
                                                                                                              WTI Strip Pricing (Past 52 Weeks)
• The last year has been an                                                         $80

  interesting time for the global                                                   $75

  crude markets.                                                                    $70

                                                NYMEX WTI Futures Price (US$/Bbl)
• Despite some negative data points                                                 $65

  surrounding various macro events,                                                 $60

  the oil tape has largely ascended                                                 $55

  higher with each passing month                                                    $50
  and is showing ongoing support in                                                 $45
                                                                                                                                                                    Last Week (10/4/18)
                                                                                                                                                                    Current Week (10/11/18)
  the front-month price.                                                            $40                                                                             High (Last Week (10/4/18))
                                                                                                                                                                    Low (10/12/17)
• The back-end of the curve has also                                                $35
                                                                                     1-Oct-17   1-Mar-18   1-Aug-18   1-Jan-19   1-Jun-19   1-Nov-19   1-Apr-20   1-Sep-20   1-Feb-21     1-Jul-21
  lifted and the backwardation in
  the structure has been a positive                                                                          Brent Strip Pricing (Past 52 Weeks)
  sign of near-term tightness.                                                      $95

• December WTI barrels are trading
  in the low US$70s, while Brent is                                                 $85
                                                ICE Brent Futures Price (US$/Bbl)

  in the low US$80s. As such, the
                                                                                    $75
  price action continues to reflect
  the ongoing acute tightening in                                                   $65
  the physical market that we have
  been emphasizing since H1/17.                                                     $55
                                                                                                                                                                   Last Week (10/4/18)
Source: Bloomberg and CIBC World Markets Inc.                                       $45                                                                            High (Last Week (10/4/18))
                                                                                                                                                                   Low (10/12/17)
                                                                                                                                                                   Current Week (10/11/18) 2
                                                                                    $35
                                                                                     1-Oct-17   1-Mar-18   1-Aug-18   1-Jan-19   1-Jun-19   1-Nov-19   1-Apr-20   1-Sep-20   1-Feb-21     1-Jul-21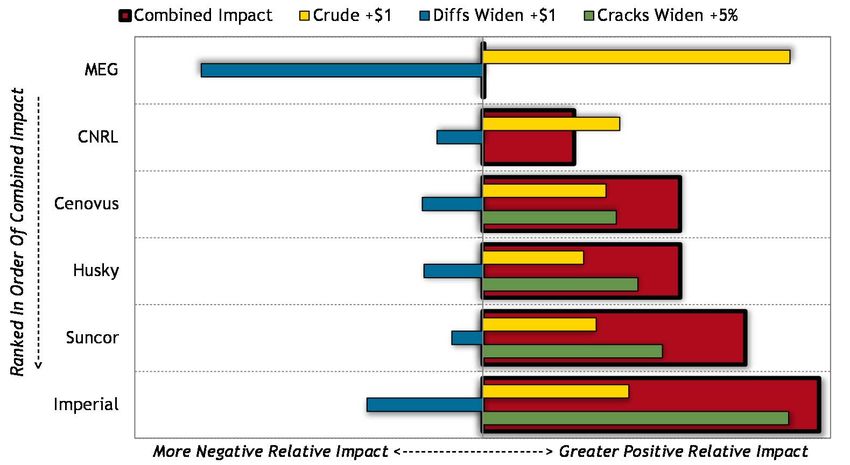
The Global Crude Picture: A Look At Balances
Macro Commodity Outlook – Crude

   A Look At Balances

   • As we have said for the past
     year, the market is tight. In fact,                  103.0                                                              2.3

     acutely so.                                          101.0                                                              1.9
   • The chart on the right highlights                                                                                       1.5
                                                           99.0
     forecasted global oil/liquids
     balances.                                             97.0
                                                                                                                             1.1

   • Although we would typically see                                                                                         0.7
                                                           95.0
     an inventory build in the first
                                                                                                                             0.3
     quarter due to seasonal

                                                                                                                                    MMBbl/d
                                                MMBbl/d    93.0
     transportation demand and                                                                                               -0.2
     refinery turnarounds, that failed                     91.0
                                                                                                                             -0.6
     to materialize in Q1/18 due to
                                                           89.0
     the current undersupply                                                                                                 -1.0
     situation.                                            87.0                                                              -1.4
   • This left the market as arguably
                                                           85.0                                                              -1.8
     being 300-500 MBbl/d tighter
                                                                   Q1 2010
                                                                   Q2 2010
                                                                   Q3 2010
                                                                   Q4 2010
                                                                   Q1 2011
                                                                   Q2 2011
                                                                   Q3 2011
                                                                   Q4 2011
                                                                   Q1 2012
                                                                   Q2 2012
                                                                   Q3 2012
                                                                   Q4 2012
                                                                   Q1 2013
                                                                   Q2 2013
                                                                   Q3 2013
                                                                   Q4 2013
                                                                   Q1 2014
                                                                   Q2 2014
                                                                   Q3 2014
                                                                   Q4 2014
                                                                   Q1 2015
                                                                   Q2 2015
                                                                   Q3 2015
                                                                   Q4 2015
                                                                   Q1 2016
                                                                   Q2 2016
                                                                   Q3 2016
                                                                   Q4 2016
                                                                   Q1 2017
                                                                   Q2 2017
                                                                   Q3 2017
                                                                   Q4 2017
                                                                   Q1 2018
                                                                   Q2 2018
                                                                  Q3 2018E
                                                                  Q4 2018E
                                                                  Q1 2019E
                                                                  Q2 2019E
                                                                  Q3 2019E
                                                                  Q4 2019E
     than where consensus
     expectations sat at the start of                              Implied stock change and balance (right axis) (MMBbl/d)
     the year.                                                     World production (left axis) (MMBbl/d)
                                                                   World consumption (left axis) (MMBbl/d)

Source: Bloomberg and CIBC World Markets Inc.

                                                                                                                             4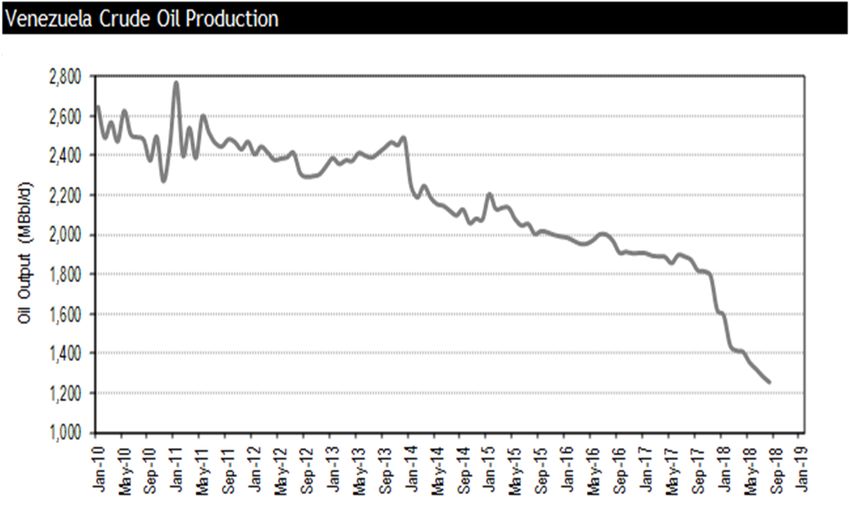
Macro Commodity Outlook – Crude

OPEC Spare Capacity

• Right now OPEC has ~2.0 MMBbl/d of spare
  capacity, which is defined as production
                                                                                                 5.5%
  that can come online within a month and be
  delivered for upwards of a year.                                                               5.0%

                                                  OPEC Spare Capacity, As A % Of Global Supply
• With that said, if Saudi Arabia needed to                                                      4.5%

  add another 1.0-2.0 MMBbl/d of output to                                                       4.0%
  the global market on a sustained basis, we
                                                                                                 3.5%
  believe it would require a 3-5 year
  investment cycle and likely represent more                                                     3.0%
  capital than the KSA would like to be                                                          2.5%
  deploying at this stage.
                                                                                                 2.0%
• In addition, spare capacity is typically
                                                                                                 1.5%
  tapped in times of unexpected outages and
  is unlikely to want to massively draw on this                                                  1.0%
  reserve supply just yet. In fact, if Saudi                                                     0.5%
  Arabia added ~650 MBbl/d of supply to the
                                                                                                 0.0%
  global market through Q1/19, it would take

                                                                                                        2Q18E
                                                                                                        3Q18E
                                                                                                        4Q18E
                                                                                                        1Q19E
                                                                                                         1Q10
                                                                                                         2Q10
                                                                                                         3Q10
                                                                                                         4Q10
                                                                                                         1Q11
                                                                                                         2Q11
                                                                                                         3Q11
                                                                                                         4Q11
                                                                                                         1Q12
                                                                                                         2Q12
                                                                                                         3Q12
                                                                                                         4Q12
                                                                                                         1Q13
                                                                                                         2Q13
                                                                                                         3Q13
                                                                                                         4Q13
                                                                                                         1Q14
                                                                                                         2Q14
                                                                                                         3Q14
                                                                                                         4Q14
                                                                                                         1Q15
                                                                                                         2Q15
                                                                                                         3Q15
                                                                                                         4Q15
                                                                                                         1Q16
                                                                                                         2Q16
                                                                                                         3Q16
                                                                                                         4Q16
                                                                                                         1Q17
                                                                                                         2Q17
                                                                                                         3Q17
                                                                                                         4Q17
                                                                                                         1Q18
  OPEC spare capacity as a % of global
  production to
Macro Commodity Outlook – Crude

Texas Output Will Remain Constrained Until H2/19

• The Midland differential
  continues to be volatile and will
                                                   $5
  widen back out if output is
  increased in any marked way                      $0
  before takeaway capacity
  comes online.                                    -$5
• Given this, we view there to be                 -$10
  the potential to see Permian

                                        US$/Bbl
  activity levels contract in the                 -$15
  coming months as there
  continues to be immense                         -$20
  congestion in crude and gas
                                                  -$25
  takeaway capacity out of West
  Texas/New Mexico and that                       -$30
  isn’t likely to change until
                                                         Jan-13

                                                                           Jan-14

                                                                                             Jan-15

                                                                                                               Jan-16

                                                                                                                                    Jan-17

                                                                                                                                                      Jan-18
                                                                  Jul-13

                                                                                    Jul-14

                                                                                                      Jul-15

                                                                                                                        Jul-16

                                                                                                                                             Jul-17

                                                                                                                                                               Jul-18
  H2/19.
• Thus, the Permian will add                                               WTI Midland - WTI Cushing Diff                        WTI Midland - Gulf Coast Diff
  material growth in the next 3-5
                                      Source: Bloomberg and CIBC World Markets Inc.
  years, but incremental adds
  within 12 months will be more
  muted.

                                                                                                                                                                        6
Macro Commodity Outlook – Crude
Texas Output Will Remain Constrained Until H2/19
8,000
7,000
6,000
5,000
MBbl/d
4,000
3,000
2,000
1,000
0
Q1/18 Q2/18 Q3/18 Q4/18 Q1/19 Q2/19 Q3/19 Q4/19 Q1/20 Q2/20 Q3/20 Q4/20 2021E 2022E 2023E 2024E 2025E
Permian Gulf Coast ("PGC") Pipeline EPD NGL Conversion Jupiter
Gray Oak Expansion EPIC pipeline Cactus II
Permian Express III phase 1 Sunrise Expansion BridgeTex Expansion
Rail Existing Pipelines Capacity Local Refinery Demand
Permian Crude Production Forecast
Source: Company reports, EIA, IEA, Bloomberg and CIBC World Markets Inc.
7Macro Commodity Outlook – Crude
200
US Crude + Product Inventories (MMBbl)
150
100
50
0
(50)
(100)
(150)
Jan Feb Mar Apr May Jun Jul Aug Sep Oct Nov Dec
10 Year Range 10 Year Average 2016 2017 2018
• The above chart highlights the acute market tightening that we have been empathizing since last April as
it shows the relative changes in U.S. petroleum inventories, including crude and products.
• As can be seen, upwards of 80 MMBbls of total petroleum inventories have now been pulled from U.S.
storage tanks since the start of 2017 and U.S. crude inventories are now below the five-year average.
• In addition, absent the large build in product inventories over the past six weeks due to robust refinery
runs, we have seen a relentless draw across the petroleum complex for nearly two years.
Source: Bloomberg and CIBC World Markets Inc.
8Macro Commodity Outlook – Crude
Crude – U.S. Inventory Levels Are Now Healthy…
U.S. Crude Inventories U.S. Gasoline Inventories
550,000 270,000
500,000 260,000
250,000
450,000 240,000
(000s) Bbl
(000s) Bbl
230,000
400,000
220,000
350,000 210,000
200,000
300,000
190,000
250,000 180,000
Jan Feb Mar Apr May Jun Jul Aug Sep Oct Nov Dec Jan Feb Mar Apr May Jun Jul Aug Sep Oct Nov Dec
5-Yr Hi-Lo Range 2013-2017 Avg. 2016 2017 2018 5-Yr Hi-Lo Range 2013-2017 Avg. 2016 2017 2018
U.S. Distillate Inventories U.S. Jet Kerosene Inventories
200,000 55,000
180,000 50,000
160,000
45,000
(000s) Bbl
(000s) Bbl
140,000
40,000
120,000
35,000
100,000
80,000 30,000
Jan Feb Mar Apr May Jun Jul Aug Sep Oct Nov Dec Jan Feb Mar Apr May Jun Jul Aug Sep Oct Nov Dec
5-Yr Hi-Lo Range 2013-2017 Avg. 2016 2017 2018 5-Yr Hi-Lo Range 2013-2017 Avg. 2016 2017 2018
Source: EIA and CIBC World Markets Inc.
9Macro Commodity Outlook
… And Look Even More Positive When Looking At Days Of Demand Cover
U.S. Gasoline Days Inventory U.S. Distillate Days Inventory
33 55
5-Yr Hi-Lo Range 5-Yr Hi-Lo Range
5 Yr Avg 5 Yr Avg
2018 2018
2017 50 2017
31 2016 2016
2015 2015
45
29
40
Days
Days
27
35
25
30
23
25
21 20
Jan Feb Mar Apr May Jun Jul Aug Sep Oct Nov Dec Jan Feb Mar Apr May Jun Jul Aug Sep Oct Nov Dec
U.S. Crude Oil Days Inventory
37
5-Yr Hi-Lo Range
5 Yr Avg
35 2018
2017
2016
33 2015
31
29
Days
27
25
23
21
19
Jan Feb Mar Apr May Jun Jul Aug Sep Oct Nov Dec
Source: Bloomberg, EIA and CIBC World Markets Inc.
10Macro Commodity Outlook
Crude – OECD Inventory Levels Are Also Moving In The Right Direction…
OECD Industry Crude Oil Inventories OECD Gasoline Inventories
1,350 430
5 Yr Range 5 Yr Range
5 Yr Avg. 5 Yr Avg.
1,300 2018 420 2018
2017 2017
2016 2016
1,250 2015 410 2015
1,200 400
1,150 390
MMBbl
MMBbl
1,100 380
1,050 370
1,000 360
950 350
900 340
Jan Feb Mar Apr May Jun Jul Aug Sep Oct Nov Dec Jan Feb Mar Apr May Jun Jul Aug Sep Oct Nov Dec
OECD Industry and Government Crude Inventories OECD Distillate Inventories
2,600 700
5 Yr Range 5 Yr Range
5 Yr Avg. 5 Yr Avg.
2,550 2018 2018
2017 2017
2016 650 2016
2015 2015
2,500
2,450
600
MMBbl
MMBbl
2,400
550
2,350
2,300
500
2,250
2,200 450
Jan Feb Mar Apr May Jun Jul Aug Sep Oct Nov Dec Jan Feb Mar Apr May Jun Jul Aug Sep Oct Nov Dec
Source: IEA and CIBC World Markets Inc.
11Macro Commodity Outlook
… And Also Look Even More Positive When Looking At Days Of Demand Cover
OECD - Crude Oil Inventories Over Daily Demand OECD - Motor Gasoline Inventories Over Daily Demand
28 31
5-Yr Range
5-Yr Avg.
27 2018
30
2017
26 2016
29 2015
25
28
24
Days
Days
23 27
22
26
21
5-Yr Range 25
20 5-Yr Avg.
2018
2017 24
19
2016
2015
18 23
Jan Feb Mar Apr May Jun Jul Aug Sep Oct Nov Dec Jan Feb Mar Apr May Jun Jul Aug Sep Oct Nov Dec
OECD - Distillate Inventories Over Gasoil/Diesel Daily Demand
49
47
45
43
Days
41
39
5-Yr Range
37 5-Yr Avg.
2018
2017
2016
35
Jan Feb Mar Apr May Jun Jul Aug Sep Oct Nov Dec
Source: IEA and CIBC World Markets Inc.
12Source: IEA
Lower 48 Weekly Oil Production (MBbl/d)
7,500
8,000
8,500
9,000
9,500
10,000
10,500
11,000
Jan-15
Feb-15
Mar-15
Apr-15
May-15
Jun-15
Jul-15
Aug-15
Sep-15
Oct-15
Nov-15
Macro Commodity Outlook – Crude
Dec-15
Jan-16
Feb-16
But U.S. Supply Is Returning To Growth…
Mar-16
Apr-16
May-16
Jun-16
Jul-16
Aug-16
Sep-16
Oct-16
Nov-16
Dec-16
Jan-17
Feb-17
Mar-17
Apr-17
May-17
Jun-17
Jul-17
Aug-17
Sep-17
Oct-17
Nov-17
Dec-17
Jan-18
Feb-18
Mar-18
Apr-18
May-18
Jun-18
Jul-18
Aug-18
Sep-18
Oct-18
• To be clear, U.S. crude production has material growth potential, but it will be bottlenecked until H2/19.
13Macro Commodity Outlook – Crude
… But U.S. Decline Rates Are Relevant And Will Continue To Limit Some Of The Unfettered Growth
• The trailing U.S. base
decline rate has
accelerated modestly in
the past year, but
continues to sit >30%.
• Tight oil production from
the U.S. Bakken, Eagle
Ford, Niobrara and
Permian plays are the core
drivers behind this
accelerating decline curve.
• And, we continue to be of
the view that it is a low-
case probability that the
entirety of ongoing global
decline rates and rising
global oil demand can be
satisfied solely through
short-cycle U.S. shale
growth.
Source: IHS and CIBC World Markets Inc.
14Macro Commodity Outlook – Crude
Permian Update IP 90 By Month On-Production
700 5.0
Cal Day Production (All Products; Boe/d)
Gas (Boe/d) 4.5
600 Oil (Bbl/d) 4.0
500 GOR (Mcf/Bbl) 3.5
GOR (Mcf/Bbl)
400 3.0
2.5
300 2.0
200 1.5
1.0
100
• Permian well 0.5
results continue to 0 0.0
Oct-13
Oct-14
Oct-15
Oct-16
Oct-17
Jan-13
Apr-13
Jul-13
Jan-14
Apr-14
Jul-14
Jan-15
Apr-15
Jul-15
Jan-16
Apr-16
Jul-16
Jan-17
Apr-17
Jul-17
improve when one
looks at just the Month On Prod
straight peak IPs,
IP 365 By Month On-Production
IP90s, IP180s and
500 5.0
IP365s.
Cal Day Production (All Products; Boe/d)
450 Gas (Boe/d) 4.5
400 Oil (Bbl/d) 4.0
350 GOR (Mcf/Bbl) 3.5
GOR (Mcf/Bbl)
300 3.0
250 2.5
200 2.0
150 1.5
100 1.0
50 0.5
0 0.0
Oct-13
Oct-14
Oct-15
Oct-16
Jan-13
Apr-13
Jul-13
Jan-14
Apr-14
Jul-14
Jan-15
Apr-15
Jul-15
Jan-16
Apr-16
Jul-16
Jan-17
Source: IHS and CIBC World Markets Inc.
Month On Prod
15Macro Commodity Outlook – Crude
Permian Update
IP 365 By Month On-Production (Normalized by Completion Length)
300
Gas (Boe/d per 1000 meters)
Cal Day Production (All Products; Boe/d)
250 Oil (Bbl/d per 1000 meters)
• But the positive Rolling 6 Month Average
rate of change 200
diminishes once
one normalizes 150
for completion
length. 100
50
0
Jan-13
Jan-14
Jan-15
Jan-16
Jan-17
Jul-13
Jul-14
Jul-15
Jul-16
May-13
May-14
May-15
May-16
Mar-13
Sep-13
Nov-13
Mar-14
Sep-14
Nov-14
Mar-15
Sep-15
Nov-15
Mar-16
Sep-16
Nov-16
Month On Prod
Source: IHS and CIBC World Markets Inc.
16Macro Commodity Outlook – Crude
Permian Update
IP 365 By Month On-Production (Normalized by Proppant Intensity)
140
Cal Day Production (All Products; Boe/d)
120
• It diminishes 100
further if one
normalizes for 80
proppant loadings.
60
• In fact, IP365s are
slipping once 40 Gas (Boe/d per 1000 tons)
normalizing for
Oil (Bbl/d per 1000 tons)
well size/proppant 20
loadings. Rolling 6 Month Average
0
Jan-13
Jan-14
Jan-15
Jan-16
Jan-17
Mar-13
May-13
Jul-13
Mar-14
May-14
Jul-14
Mar-15
May-15
Jul-15
Mar-16
May-16
Jul-16
Sep-13
Sep-14
Sep-15
Sep-16
Nov-13
Nov-14
Nov-15
Nov-16
Month On Prod
Source: IHS and CIBC World Markets Inc.
17Macro Commodity Outlook – Crude
Eagle Ford Update IP 90 By Month On-Production
700 5.0
Gas (Boe/d) 4.5
Cal Day Production (All Products; Boe/d)
600
Oil (Bbl/d)
4.0
500 GOR (Mcf/Bbl)
3.5
GOR (Mcf/Bbl)
3.0
400
2.5
300
2.0
200 1.5
1.0
• Eagle Ford well 100
0.5
results also 0 0.0
Jan-13
Apr-13
Jul-13
Oct-13
Jan-14
Apr-14
Jul-14
Oct-14
Jan-15
Apr-15
Jul-15
Oct-15
Jan-16
Apr-16
Jul-16
Oct-16
Jan-17
Apr-17
Jul-17
Oct-17
continue to
improve when one Month On Prod
looks at just the IP 365 By Month On-Production
straight peak IPs, 500 5.0
IP90s, IP180s and 450 Gas (Boe/d) 4.5
Cal Day Production (All Products; Boe/d)
IP365s. 400
Oil (Bbl/d)
4.0
GOR (Mcf/Bbl)
350 3.5
GOR (Mcf/Bbl)
300 3.0
250 2.5
200 2.0
150 1.5
100 1.0
50 0.5
0 0.0
Source: IHS and CIBC World Markets Inc.
Jan-13
Jan-14
Jan-15
Jan-16
Jan-17
Apr-13
Jul-13
Apr-14
Jul-14
Apr-15
Jul-15
Apr-16
Jul-16
Oct-13
Oct-14
Oct-15
Oct-16
Month On Prod
18Macro Commodity Outlook – Crude
Eagle Ford Update
IP 365 By Month On-Production (Normalized by Completion Length)
300
Gas (Boe/d per 1000 meters)
Cal Day Production (All Products; Boe/d)
250 Oil (Bbl/d per 1000 meters)
Rolling 6 Month Average
• But the positive
rate of change 200
diminishes once
one normalizes 150
for completion
length.
100
50
0
May-13
May-14
May-15
May-16
Jul-13
Nov-13
Jul-14
Nov-14
Jul-15
Nov-15
Jul-16
Nov-16
Jan-13
Jan-14
Jan-15
Jan-16
Jan-17
Mar-13
Mar-14
Mar-15
Mar-16
Sep-13
Sep-14
Sep-15
Sep-16
Month On Prod
Source: IHS and CIBC World Markets Inc.
19Macro Commodity Outlook – Crude
Eagle Ford Update
IP 365 By Month On-Production (Normalized by Proppant Intensity)
140
Cal Day Production (All Products; Boe/d)
120
• It diminishes 100
further if one
normalizes for 80
proppant loadings.
60
• In fact, IP365s are
slipping once
40 Gas (Boe/d per 1000 tons)
normalizing for
well size/proppant Oil (Bbl/d per 1000 tons)
20
loadings. Rolling 6 Month Average
0
Jul-13
Jul-14
Jul-15
Jul-16
Jan-13
Jan-14
Jan-15
Jan-16
Jan-17
May-13
May-14
May-15
May-16
Sep-13
Nov-13
Sep-14
Nov-14
Sep-15
Nov-15
Sep-16
Nov-16
Mar-13
Mar-14
Mar-15
Mar-16
Month On Prod
Source: IHS and CIBC World Markets Inc.
20Macro Commodity Outlook – Crude
Outside Of The U.S. There Are Few Other Supply Growth Markets Expected In 2018 - 2020
$35.0
Canada $30.0
WCSB Oil Sands Capital Spending ($ Billions)
• Canadian oil sands spending declined for the third $25.0
consecutive year in 2017, with total annual capex $20.0
expected to be down nearly 60% from the 2014
peak. $15.0
$10.0
• Although there were eight projects sanctioned in
2016, this was materially below the recent $5.0
annual growth trend. $0.0
2017E
2018E
2019E
1993
1994
1995
1996
1997
1998
1999
2000
2001
2002
2003
2004
2005
2006
2007
2008
2009
2010
2011
2012
2013
2014
2015
2016
Brazil 2,800,000
2,600,000
• Following three years of robust production adds
Brazilian Crude Production (Bbl/d)
2,400,000
from pre-salt development, Brazil’s growth is 2,200,000
likely to stall out in 2018 with 10% Y/Y and forward development 1,000,000
plans require greater capital spending, which
will be a challenge for Petrobras given its tight
balance sheet and debt repayment plans.
Source: CAPP, PSAC, IHS, ANP, company reports and CIBC World Markets Inc.
21Macro Commodity Outlook – Crude
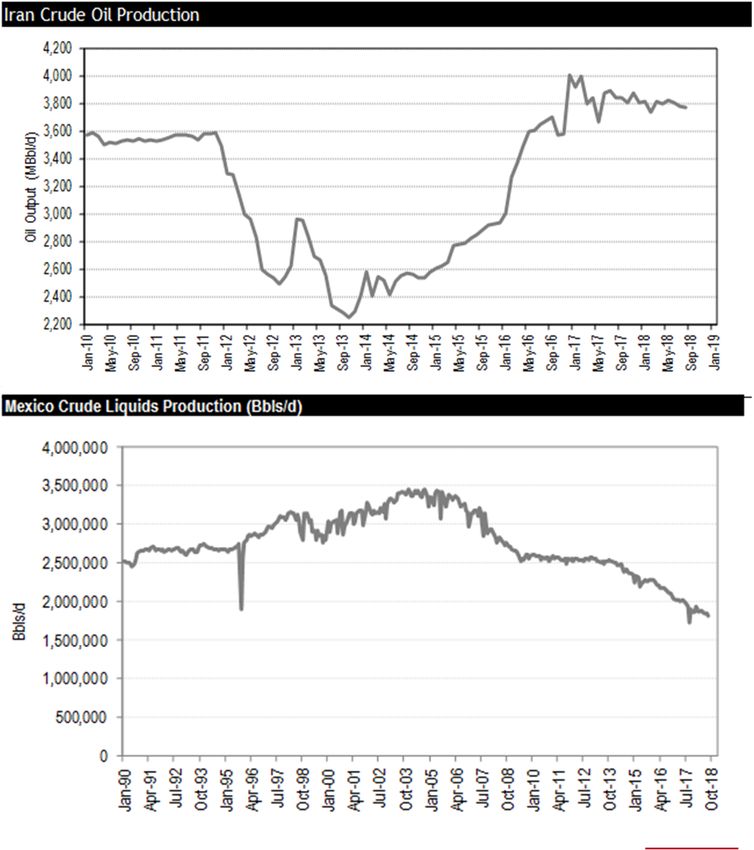
Crude – Other Key Global Supply Markets
• Iran: Iran has shown material growth since
the original sanctions have been lifted,
but the country needs material
investments to continue its growth.
• Specifically, there are critical investments
needed in energy infrastructure and
oilfield services capacity - both of which
are challenged in the current macro
environment and further handicapped by
the current U.S. Administration.
Incremental U.S. sanctions only
deteriorate this outlook.
• Mexico: Production continues to fade
every month, with base spending and
activity levels being materially below the
level needed to have flat output.
• Other Offshore Mega Projects Are
Largely Shelved: GoM is completing the
last major project sanctions. North Sea is
fairly lethargic outside UK maintenance
work and offshore Africa is largely at a
standstill.
22
Source: Energy Intelligence and PemexMacro Commodity Outlook – Crude
Other Key Global Supply Markets
• Venezuela: The geopolitical risk in
Venezuela continues to deteriorate by the
day. January crude output sat at ~1.5
MMBbl/d and current production may be
closer to 1.3 MMBbl/d or 1.4 MMBbl/d, or
perhaps even lower. This very unfortunate
situation is driving downside risk to global
supply balances and should the current state
of the union continue, there is considerable
upside risk to global oil prices.
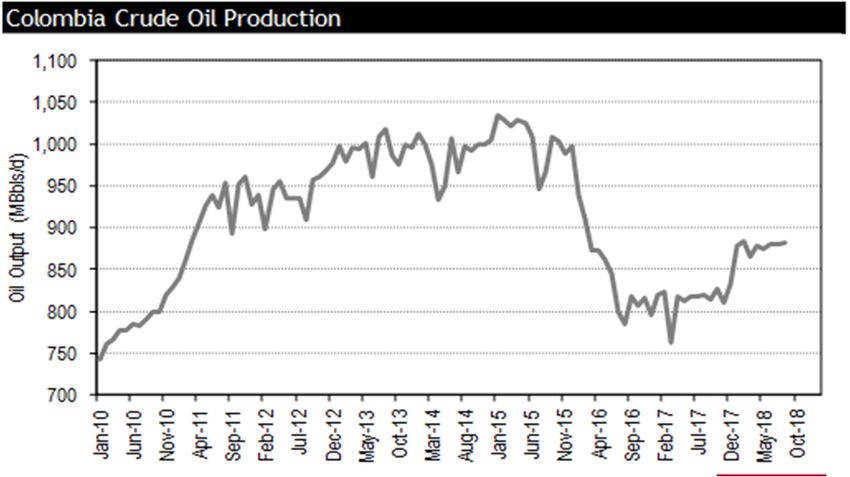
• Colombia: Capital spending levels and
development plans have been materially
trimmed in the face of trailing oil price
volatility and there is no reason to believe
upward momentum is on the come, from a
country-wide perspective.
• Markets That Will Grow Outside Of North
America: Kuwait, Kazakhstan, Russia and
possibly Iraq, depending on IOC development
plans.
Source: Energy Intelligence and OPEC
23Macro Commodity Outlook – Crude
• Further, we have highlighted $160
this multiple times in the
past, but we’ll harp on it $140
Dec. 2008
once more. While the
forward strip is a great tool $120
May. 2012
to hedge risk as either a
$100
producer or consumer of Dec. 2007
crude/products, it’s a poor May. 2014
$US/Bbl
$80
predictor of forward prices. Dec. 2014
Sep.2018
• In fact, the long-term $60 Jan. 2009
Jun.2018
correlation between the
Sept. 2017 Mar. 2017
forward strip looking 12 $40
Dec. 2004
Jan. 2016
months ahead and realized
crude prices over the past 20 $20
Dec. 2003
years has an R2 of 0.17. But
to be honest, we probably $0
didn’t even need to run that
2003
2004
2005
2006
2007
2008
2009
2010
2011
2012
2013
2014
2015
2016
2017
2018
2019
2020
2021
2022
statistical analysis.
Source: Bloomberg and CIBC World Markets Inc.
24Battle Of The Barrels: A Look At Canada’s Unique Headwinds
Battle Of The Barrels: A Look At The Price Action

 • Canada light and heavy oil diffs have been both under pressure and volatile lately.

 • Specifically, Ed Par/Mixed Sweet Blend (MSW) pricing has moved from trading at a traditional
   ~US$4/Bbl discount relative to WTI and a ~US$6/Bbl discount relative to U.S. Gulf Coast prices to
   recent peaks of ~US$33/Bbl and ~US$40/Bbl over the past month, respectively.

 • We have also seen Canadian Synthetic Crude Oil (SCO) move from historically pricing in line to a
   modest premium to WTI, to a peak discount of US$31/Bbl in the past week.

 • Western Canadian Select (WCS) pricing has also moved from trading at a traditional ~US$15/Bbl
   discount relative to WTI to a recent peak of ~US$50/Bbl over the past week.

 • Naturally, these spreads will tighten up as select PADD II refineries move out of maintenance in the
   coming weeks, but there are structural takeaway capacity issues that shouldn’t be glazed over.

                                                                                                          26
Battle Of The Barrels: A Look At The Price Action
YTD North American Crude Benchmarks (US$/Bbl) YTD Canadian Crudes Relative To LLS (US$/Bbl)
$80 $10
$70
$0
($10)
$60
($20)
• This price
US$/Bbl
$50
US$/Bbl
($30)
action can be
$40 ($40)
seen in the
($50)
spreads to the $30
($60)
right. $20
($70)
• Despite a
robust global Ed Mixed Sweet Syncrude Blend
Western Canadian Select West Texas Intermediate Ed Mixed Sweet - LLS Syncrude - LLS WCS - LLS
market,
Canadian YTD Canadian Crudes Relative To WTI (US$/Bbl) YTD Canadian Crudes Relative To MEH (US$/Bbl)
crude prices $10 $10
have been
$0 $0
collapsing.
($10) ($10)
($20) ($20)
US$/Bbl
US$/Bbl
($30)
($30)
($40)
($40)
($50)
($50)
($60)
($60)
Ed Mixed Sweet - WTI Syncrude - WTI WCS - WTI
Ed Mixed Sweet - MEH Syncrude - MEH WCS - MEH
Source: Bloomberg and CIBC World Markets Inc. 27Battle Of The Barrels: U.S. Refinery Maintenance Has Been
An Issue
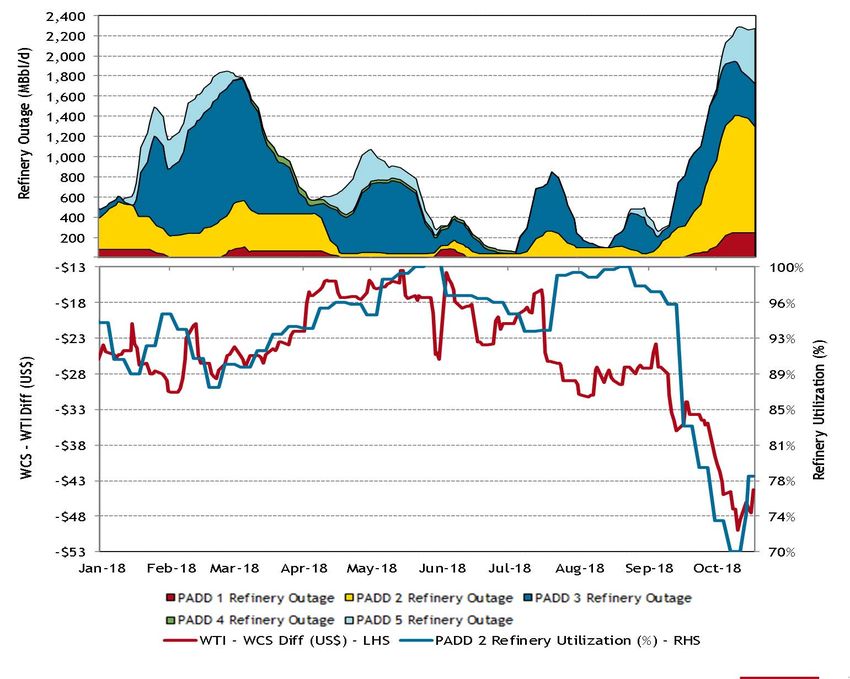
• It’s important to note that
some of this Canadian
price action is driven by
U.S. refinery turnarounds
caused by seasonally
reduced physical demand
for Canadian barrels.
• Specifically, BP Whiting
(~413 MBbl/d nameplate)
will be off until later this
week. Marathon’s Detroit
(~139 MBbl/d nameplate)
is set to come back online
today. And Holly Frontier’s
El Dorado refinery (~160
MBbl/d nameplate) will be
offline until mid-
November.
• As such, while some price
reprieve is on the way,
there are also structural
issues working against
Canada.
Source: Bloomberg and CIBC World Markets Inc.
28Battle Of The Barrels: U.S. Refinery Maintenance
• Despite this negative price action and
the decline in demand for Canadian
crude feedstock into the U.S. refining
market, Canadian flows into PADD II and
III remain steady.
• And it isn’t resulting in any material
outsized ballooning in crude stocks in
these storage markets. Specifically, U.S. PADD 3. U.S. Gulf Coast Crude Inventories
crude export draws have remained 300000
healthy while U.S. production is starting 280000
to flat line due to crude takeaway 260000
challenges. 240000
220000
(000s) Bbl
200000
180000
160000
140000
120000
Source: EIA, Bloomberg and CIBC World Markets Inc. Jan Feb Mar Apr May Jun Jul Aug Sep Oct Nov Dec
5-Yr Hi-Lo Range 2013-2017 Avg. 2016 29
2017 2018Battle Of The Barrels: Structural Takeaway Capacity Issues Exist
8,000
7,000
6,000
5,000
MBbl/d
4,000
3,000
2,000
1,000
0
2017A 2018E 2019E 2020E 2021E 2022E 2023E 2024E 2025E
Other Proposed Pipelines (Keystone XL and TMX) Enbridge Line 3 Replacement
Enbridge Mainline Optimization + BEP Repurposing Rail
Existing Pipelines Western Canada Refineries
WCSB Crude Supply (CAPP Forecast) WCSB Crude Supply (CIBC Forecast)
CIBC Crude Supply (Bull Case)
• Within the exhibit above, we stack our current base and bull-case WCSB production forecasts along with
those of the CAPP against current and forecasted WCSB takeaway capacity. As can be seen, the market
looks very tight.
Source: CAPP, NEB, geoSCOUT, company reports and CIBC World Markets Inc.
30Battle Of The Barrels: A Look At CRB Needed To Clear The Market
600 -$48
550 -$44
500 -$40
CBR Loading (MBbl/d)
450 -$36
WCS - WTI Diff ($/Bbl)
400 -$32
350 -$28
300 -$24
250 -$20
200 -$16
150 -$12
100 -$8
50 -$4
0 $0
Oct-17
Oct-18
Oct-19
Mar-17
Mar-18
Mar-19
Nov-17
Nov-18
Nov-19
Feb-17
Apr-17
Jun-17
Jul-17
Aug-17
Sep-17
Dec-17
Feb-18
Apr-18
Jun-18
Jul-18
Aug-18
Sep-18
Dec-18
Feb-19
Apr-19
Jun-19
Jul-19
Aug-19
Sep-19
Dec-19
Jan-17
Jan-18
Jan-19
May-17
May-18
May-19
High Case CBR Loadings Needed Base Case CBR Loadings Needed
Low Case CBR Loadings Needed Actual CBR Loadings
Expected CBR Export Capacity by ~2018 YE WCS - WTI Diff (RHS)
WCS - WTI Diff Strip (RHS)
Source: NEB, Bloomberg, CN, CP, CAPP, company reports and CIBC World Markets Inc.
• Moreover, as we highlight in the exhibit above, we believe the industry is going to need to
materially ramp CBR loadings over the coming six months. This will include the need to take
CBR shipments to a level that we have never seen before.
• And while we take comfort that Canada should be running upwards of ~450 MBbl/d of CBR
loadings by 2018 YE based on comments from CP and CN, the margin for error is small and
the industry will need to exercise extreme pragmatism in not overproducing, even under our
dampened growth expectations. 31Battle Of The Barrels: Key Takeaways
• Canada can no longer be a growth market until long-term egress issues are achieved: The reality is
that we do not believe individual Canadian company growth plans are achievable in the context of the
current takeaway constraints. Simply said, we believe producers will need to shut in production to
keep the spreads reasonable at various points in time over the coming year.
• This comes despite field-level economics likely still indicating that it makes sense to keep drilling and
adding output for select companies in select plays.
• Canadian producers will need to be logical and pragmatic: While we are operating under the
assumption that companies will be rational when it comes to a decision of maximizing production
versus cash flow, this is effectively a game of “prisoners dilemma” and sometime prices need to do all
of the work before the industry responds as it should.
• With that said, as we witnessed from Cenovus in H1/18, should the diff blow out and it makes sense to
dial back production by 1%-2% to increase cash flow by 5%-10%, we believe the latter should take
place, eventually.
• Canadian light volumes face other headwinds: The MSW/SCO barrel has rising competition from the
Permian, Oklahoma, Rockies and U.S. Bakken, which all sell into the PADD II/PADD III market and are
ramping up production. And until there are enhanced egress options to move more production from
these markets (particularly the Permian) to the Gulf Coast, this will create crude-on-crude
competition that is likely to remain in place for upwards of the next 18 months.
• MSW volumes are also being backed out of WCSB refineries: There is ~760 MBbl/d of nameplate
refining capacity in Western Canada, of which upwards of 75% of the historical feedstock that has
typically been run through these facilities is a Canadian light barrel (i.e., a MSW type of grade). But
these refineries are consistently trying to increase running synthetic or heavy oil sands barrels in order
to maximize profits and have strong physical integration with their upstream output.
32Battle Of The Barrels: Key Takeaways
• A look at the path forward:
• Limit unfettered Canadian light volume growth and be cognizant of these structural issues
ahead.
• Wait for full Enbridge Mainline expansion/optimization to unfold.
• Look at alternative markets to clear output at this juncture, including using CBR into the
Eastern Canadian refining market to back out international imports and then into the U.S.
Gulf Coast – although there will likely be export bottlenecks arriving due to export capacity.
• The industry needs to push other long-term ways to get more production to tidewater.
2015 - Present Brent - Ed Mixed Sweet (US$/Bbl)
$100 $45
$90 $40
Brent‐MSW Diff (US$/Bbl)
$80 $35
$70 $30
$60
$25
US$/Bbl
$50
$20
$40
$30 $15
$20 $10
$10 $5
$0 $0
Series1 Brent Ed Mixed Sweet
Source: Bloomberg and CIBC World Markets Inc.
33IMO 2020: Road To Perdition?
IMO 2020: The Regulation Will Challenge Heavy Sour Pricing,
But The Canadian Large-caps Should Fare Well
• We believe IMO 2020 has the potential to be one of the larger events in the oil market this decade. The
regulation will have broad impacts on pricing for various crude slates and will require tens of billions of
dollars of capex to be spread across the refining and maritime shipping industries. Depending on how
industry responds to the price action that follows, it also has the potential to cause material inflation
globally as middle distillates are effectively the lifeblood of the global economy. If left unchecked,
rising diesel prices will act as a tax on economic growth and come with negative consequences.
• Although the regulation does not officially take effect until January 1, 2020 and the global shipping
industry will likely continue to burn high sulphur fuel oil (HSFO) in vessels until New Year’s Eve 2019,
the spot market for HSFO will drop like a stone before this date. Specifically, anyone that traffics or
trades in the HSFO market will be keen to destock their inventories and offload their exposure before
the music stops on January 1, 2020. This price action can already be seen in the forward curve between
diesel and HSFO, but likely has further to go from here (see the below exhibit).
200
Fuel Oil (3.5% Sulphur) Fuel Oil Futures
180 Diesel (ULSD) Diesel (ULSD) Futures Although the HSFO futures market
160 Heavy Fuel Oil vs. ULSD Diff ($/Bbl) is showing a ~US$20/Bbl decline
over H1/19 - Q1/20, we believe
140
more pressure is set to arrive...
US$/Bbl
120
100
80
60
40
20
0
Jan-08
Jan-09
Jan-10
Jan-11
Jan-12
Jan-13
Jan-14
Jan-15
Jan-16
Jan-17
Jan-18
Jan-19
Jan-20
Jan-21
Jan-22
Jan-23
Jan-24
Jul-08
Jul-09
Jul-10
Jul-11
Jul-12
Jul-13
Jul-14
Jul-15
Jul-16
Jul-17
Jul-18
Jul-19
Jul-20
Jul-21
Jul-22
Jul-23
35
Source: Bloomberg and CIBC World Markets Inc.IMO 2020: The Regulation Will Challenge Heavy Sour Pricing,
But The Canadian Large-caps Should Fare Well
• The key thing to note is that it would be a mistake to take the simplistic view that the regulation
will be negative for heavy sours and neutral for everything else. As we have been harping on for the
past 18 months, the global oil market has been going through an acute tightening and after years of
delivering a number of large global supply projects that were sanctioned prior to the H2/14
downturn, the forward landscape for incremental production growth around the world is soft
outside of the U.S. in 2020+ and that is not going to change anytime soon, in our view.
• The reality is that the world is longing for more crude and while one impact of IMO 2020 will be
price dislocation for heavy sours, the market will still need every one of those barrels to keep
clearing the market in order to keep the world’s crude supply and demand in some form of a
relative check. While heavy sour diffs will widen on the back of IMO 2020, the global reference
point will also rise and it’s not inconceivable (maybe even fairly likely) that pricing for WCS and
other heavy sour grades will actually increase on the back of the regulation in absolute terms. As
such, should the equity markets start to massively discount Canadian heavy oil and oil sands
producers as we march into H2/19 and those producers have solid market access to keep clearing
their production (i.e., like the vast majority of Canadian Large-caps/Integrateds have), then that
might end up presenting a solid buying opportunity for such equities.
• Within our Canadian Large-cap E&P and Integrateds coverage universe, there will be varying
degrees of impact from the implementation of IMO 2020. Specifically, we would highlight that we
expect the regulation to likely be the most positive for Imperial, Suncor and Husky, then less
positive for Cenovus and Canadian Natural (but still likely a positive tailwind for both companies)
and then neutral to possibly somewhat negative for MEG, on a relative basis.
36IMO 2020: The Regulation Will Challenge Heavy Sour Pricing,
But The Canadian Large-caps Should Fare Well
The exhibit below highlights the 2020 directional impact that a US$1/Bbl wider WCS-WTI diff, a
US$1/Bbl increase in the WTI price and a 5% widening in crack spreads would have to each company’s
cash flows. You’ll notice there isn’t a legend here and there is good reason for this – this isn’t a linear
relationship and we didn’t want to publish a thousand different sensitivities, but felt the chart below
gives a better directional read on how to think about impacts outside of our base-case forecasts,
which naturally incorporate our IMO 2020 and other market views.
Source: Company reports and CIBC World Markets Inc.
37Price Forecast
2018E 2019E 2020E
Current Current Current
Crude Oil
Brent (US$/Bbl) $74.00 $85.00 $85.00
Brent - WTI Differential (US$/Bbl) ($5.50) ($10.00) ($9.00)
WTI Oil (US$/Bbl) $68.50 $75.00 $76.00
WTI - Ed. Par Differential (US$/Bbl) ($7.86) ($11.00) ($8.75)
Forex - US$/C$ $0.780 $0.780 $0.780
Ed. Par (C$/Bbl) $77.74 $82.05 $86.22
Light Heavy Differential vs. C$ WTI (%) (36%) (36%) (39%)
Light Heavy Differential vs. US$ WTI (US$/Bbl) ($25.00) ($27.00) ($30.00)
Western Canada Select (C$/Bbl) $55.77 $61.54 $58.97
Natural Gas
NYMEX (US$/Mcf) $3.04 $2.69 $2.62
NYMEX - AECO Differential (US$/Mcf) ($1.79) ($1.55) ($1.50)
AECO 30+ Day Spot (C$/Mcf) $1.60 $1.46 $1.44
Dawn Gas (US$/Mcf) $3.02 $2.59 $2.52
Dawn Gas Premium/(Discount) to HH (US$/Mcf) ($0.02) ($0.10) ($0.10)
Station 2 Gas (US$/Mcf) $1.18 $0.99 $0.98
Station 2 Gas Premium/(Discount) to HH (US$/Mcf) ($1.87) ($1.70) ($1.65)
Chicago Gas (US$/Mcf) $2.91 $2.54 $2.48
Chicago Gas Premium/(Discount) to HH (US$/Mcf) ($0.13) ($0.15) ($0.15)
Sumas Gas (US$/Mcf) $2.23 $1.94 $1.88
Sumas Gas Premium/(Discount) to HH (US$/Mcf) ($0.81) ($0.75) ($0.75)
Malin Gas (US$/Mcf) $2.48 $2.09 $2.03
Malin Gas Premium/(Discount) to HH (US$/Mcf) ($0.57) ($0.60) ($0.60)
Waha Gas (US$/Mcf) $2.32 $2.19 $2.13
Waha Gas Premium/(Discount) to HH (US$/Mcf) ($0.72) ($0.50) ($0.50)
Source: Company reports and CIBC World Markets Inc.
38I
Oil Update - October 18, 2018
IMPORTANT DISCLOSURES:
Analyst Certification: Each CIBC World Markets Corp./Inc. research analyst named on the front page of this research report, or at the beginning of any
subsection hereof, hereby certifies that (i) the recommendations and opinions expressed herein accurately reflect such research analyst's personal views
about the company and securities that are the subject of this report and all other companies and securities mentioned in this report that are covered by
such research analyst and (ii) no part of the research analyst's compensation was, is, or will be, directly or indirectly, related to the specific
recommendations or views expressed by such research analyst in this report.
Analysts employed outside the U.S. are not registered as research analysts with FINRA. These analysts may not be associated persons of CIBC World Markets
Corp. and therefore may not be subject to FINRA Rule 2241 restrictions on communications with a subject company, public appearances and trading
securities held by a research analyst account.
Potential Conflicts of Interest: Equity research analysts employed by CIBC World Markets Corp./Inc. are compensated from revenues generated by various
CIBC World Markets Corp./Inc. businesses, including the CIBC World Markets Investment Banking Department. Research analysts do not receive
compensation based upon revenues from specific investment banking transactions. CIBC World Markets Corp./Inc. generally prohibits any research analyst
and any member of his or her household from executing trades in the securities of a company that such research analyst covers. Additionally, CIBC World
Markets Corp./Inc. generally prohibits any research analyst from serving as an officer, director or advisory board member of a company that such analyst
covers.
In addition to 1% ownership positions in covered companies that are required to be specifically disclosed in this report, CIBC World Markets Corp./Inc. may
have a long position of less than 1% or a short position or deal as principal in the securities discussed herein, related securities or in options, futures or other
derivative instruments based thereon.
Recipients of this report are advised that any or all of the foregoing arrangements, as well as more specific disclosures set forth below, may at times give
rise to potential conflicts of interest.
1Oil Update - October 18, 2018 Important Disclosure Footnotes for Companies Mentioned in this Report that Are Covered by CIBC World Markets Corp./Inc.: Stock Prices as of 10/18/2018: Canadian Natural Resources Ltd. (2a, 2b, 2g, 7) (CNQ-TSX, C$37.31) Cenovus Energy Inc. (2g, 7, 9) (CVE-TSX, C$11.29) Husky Energy Inc. (2g) (HSE-TSX, C$19.83) Imperial Oil Limited (2g) (IMO-TSX, C$43.96) MEG Energy Corp. (2g) (MEG-TSX, C$10.79) Suncor Energy Inc. (2a, 2e, 2g, 7) (SU-TSX, C$47.17) Important disclosure footnotes that correspond to the footnotes in this table may be found in the "Key to Important Disclosure Footnotes" section of this report.
Oil Update - October 18, 2018
Key to Important Disclosure Footnotes:
1a    CIBC WM Corp. makes a market in the securities of this company.
1b    CIBC WM Inc. makes a market in the securities of this company.
1c    CIBC WM Plc. makes a market in the securities of this company.
2a    This company is a client for which a CIBC World Markets company has performed investment banking services in the past 12
      months.
2b    CIBC World Markets Corp. has managed or co-managed a public offering of securities for this company in the past 12
      months.
2c    CIBC World Markets Inc. has managed or co-managed a public offering of securities for this company in the past 12 months.
2d    CIBC World Markets Corp. has received compensation for investment banking services from this company in the past 12
      months.
2e    CIBC World Markets Inc. has received compensation for investment banking services from this company in the past 12
      months.
2f    CIBC World Markets Corp. expects to receive or intends to seek compensation for investment banking services from this
      company in the next 3 months.
2g    CIBC World Markets Inc. expects to receive or intends to seek compensation for investment banking services from this
      company in the next 3 months.
3a    This company is a client for which a CIBC World Markets company has performed non-investment banking, securities-related
      services in the past 12 months.
3b    CIBC World Markets Corp. has received compensation for non-investment banking, securities-related services from this
      company in the past 12 months.
3c    CIBC World Markets Inc. has received compensation for non-investment banking, securities-related services from this
      company in the past 12 months.
4a    This company is a client for which a CIBC World Markets company has performed non-investment banking, non-securities-
      related services in the past 12 months.
4b    CIBC World Markets Corp. has received compensation for non-investment banking, non-securities-related services from this
      company in the past 12 months.
4c    CIBC World Markets Inc. has received compensation for non-investment banking, non-securities-related services from this
      company in the past 12 months.
5a    The CIBC World Markets Corp. analyst(s) who covers this company also has a long position in its common equity securities.
5b    A member of the household of a CIBC World Markets Corp. research analyst who covers this company has a long position in
      the common equity securities of this company.
6a    The CIBC World Markets Inc. fundamental analyst(s) who covers this company also has a long position in its common equity
      securities.
6b    A member of the household of a CIBC World Markets Inc. fundamental research analyst who covers this company has a long
      position in the common equity securities of this company.
7     CIBC World Markets Corp., CIBC World Markets Inc., and their affiliates, in the aggregate, beneficially own 1% or more of a
      class of equity securities issued by this company.
Oil Update - October 18, 2018
Key to Important Disclosure Footnotes: (Continued)
8 An executive of CIBC World Markets Inc. or any analyst involved in the preparation of this research report has provided
services to this company for remuneration in the past 12 months.
9 An executive committee member or director of Canadian Imperial Bank of Commerce (“CIBC”), the parent company to CIBC
World Markets Inc. and CIBC World Markets Corp., or a member of his/her household is an officer, director or advisory
board member of this company or one of its subsidiaries.
10 Canadian Imperial Bank of Commerce ("CIBC"), the parent company to CIBC World Markets Inc. and CIBC World Markets
Corp., has a significant credit relationship with this company.
11 The equity securities of this company are restricted voting shares.
12 The equity securities of this company are subordinate voting shares.
13 The equity securities of this company are non-voting shares.
14 The equity securities of this company are limited voting shares.V
Oil Update - October 18, 2018
CIBC World Markets Corp./Inc. Price Chart
For price and performance charts required under NYSE and NASD rules, please visit CIBC on the web at http://apps.cibcwm.com/pricecharts/ or write to CIBC World Markets
Corp., 425 Lexington Avenue, New York, NY 10017 (212-856-4000) or CIBC world Markets Inc., 161 Bay Street, 4th Floor, Toronto, ON M5H 2S8, Attn: Research Disclosure Chart
Request.
CIBC World Markets Corp./Inc. Stock Rating System
Abbreviation Rating Description
Stock Ratings
OP Outperformer Stock is expected to outperform similar stocks in the coverage universe during the next 12-18
months.
NT Neutral Stock is expected to perform in line with similar stocks in the coverage universe during the
next 12-18 months.
UN Underperformer Stock is expected to underperform similar stocks in the coverage universe during the next 12-
18 months.
NR Not Rated CIBC World Markets does not maintain an investment recommendation on the stock.
R Restricted CIBC World Markets is restricted (due to potential conflict of interest) from rating the stock.
Stock Ratings Prior To December 09, 2016
SO Sector Outperformer Stock is expected to outperform the sector during the next 12-18 months.
SP Sector Performer Stock is expected to perform in line with the sector during the next 12-18 months.
SU Sector Underperformer Stock is expected to underperform the sector during the next 12-18 months.
NR Not Rated CIBC World Markets does not maintain an investment recommendation on the stock.
R Restricted CIBC World Markets is restricted (due to potential conflict of interest) from rating the stock.
Sector Ratings (note: Broader market averages refer to S&P 500 in the U.S. and S&P/TSX Composite in Canada.)
O Overweight Sector is expected to outperform the broader market averages.
M Marketweight Sector is expected to equal the performance of the broader market averages.
U Underweight Sector is expected to underperform the broader market averages.
NA None Sector rating is not applicable.
"Speculative" indicates that an investment in this security involves a high amount of risk due to volatility and/or liquidity issues.VI
Oil Update - October 18, 2018
Ratings Distribution*: CIBC World Markets Corp./Inc. Coverage Universe
(as of 18 Oct 2018) Count Percent Inv. Banking Relationships Count Percent
Outperformer (Buy) 159 47.6% Outperformer (Buy) 142 89.3%
Neutral (Hold/Neutral) 155 46.4% Neutral (Hold/Neutral) 131 84.5%
Underperformer (Sell) 8 2.4% Underperformer (Sell) 8 100.0%
Restricted 11 3.3% Restricted 11 100.0%
*Although the investment recommendations within the three-tiered,relative stock rating system utilized by CIBC World Markets Corp./Inc.do not
correlate to buy, hold and sell recommendations, for the purposes of complying with FINRA rules, CIBC World Markets Corp./Inc. has assigned buy
ratings to securities rated Outperformer, hold ratings to securities rated Neutral, and sell ratings to securities rated Underperformer. The
distributions above reflect the combined historical ratings of CIBC World Markets Corp. and CIBC World Markets Inc.
Ratings Distribution: Energy Coverage Universe
(as of 18 Oct 2018) Count Percent Inv. Banking Relationships Count Percent
Outperformer (Buy) 35 50.7% Outperformer (Buy) 35 100.0%
Neutral (Hold/Neutral) 29 42.0% Neutral (Hold/Neutral) 28 96.6%
Underperformer (Sell) 2 2.9% Underperformer (Sell) 2 100.0%
Restricted 3 4.3% Restricted 3 100.0%
Important disclosures required by applicable rules can be obtained by visiting CIBC World Markets on the web at http://researchcentral.cibcwm.com/. Important disclosures
for each issuer can be found using the "Coverage" tab on the top left of the Research Central home page. Access to the system for rating investment opportunities and our
dissemination policy can be found at the bottom of each page on the Research Central website. These important disclosures can also be obtained by writing to CIBC World
Markets Corp., 425 Lexington Avenue, New York, NY 10017 (212-856-4000) or CIBC World Markets Inc.,161 Bay Street, 4th Floor, Toronto, ON M5H 2S8, Attention: Research
Disclosures Request.VII
Oil Update - October 18, 2018
Legal Disclaimer
Not for Distribution: This marketing presentation is issued and approved by CIBC World Markets Inc. solely for distribution to institutional investor clients and
not with a view toward public distribution as a research report. This presentation is provided to such institutional investor clients for informational purposes
only, and does not constitute an offer or solicitation to buy or sell any securities discussed herein in any jurisdiction where such offer or solicitation is
prohibited.
This presentation is issued and approved for distribution by (a) in Canada, CIBC World Markets Inc., a member of the Investment Industry Regulatory
Organization of Canada (“IIROC”), the Toronto Stock Exchange, the TSX Venture Exchange and a Member of the Canadian Investor Protection Fund, (b) in the
United Kingdom, CIBC World Markets plc, is Authorised by the Prudential Regulation Authority and regulated by the Financial Conduct Authority and the
Prudential Regulation Authority, (c) in Australia to wholesale clients only, CIBC Australia Ltd, a company regulated by the ASIC with AFSL license number
240603 and ACN 000 067 256, and (d) in Japan, CIBC World Markets (Japan) Inc., a registered Type 1 Financial product provider with the registration number
Director General of Kanto Finance Bureau #218 (collectively, “CIBC World Markets”) and (e) in the United States either by (i) CIBC World Markets Inc. for
distribution only to U.S. Major Institutional Investors (“MII”) (as such term is defined in SEC Rule 15a-6) or (ii) CIBC World Markets Corp., a member of the
Financial Industry Regulatory Authority (“FINRA”). U.S. MIIs receiving this presentation from CIBC World Markets Inc. (the Canadian broker-dealer) are
required to effect transactions (other than negotiating their terms) in securities discussed in the presentation through CIBC World Markets Corp. (the U.S.
broker-dealer).
This presentation is provided, for informational purposes only, to institutional investor and retail clients of CIBC World Markets in Canada, and does not
constitute an offer or solicitation to buy or sell any securities discussed herein in any jurisdiction where such offer or solicitation would be prohibited. This
document and any of the products and information contained herein are not intended for the use of private investors in the United Kingdom. Such investors
will not be able to enter into agreements or purchase products mentioned herein from CIBC World Markets plc. The comments and views expressed in this
document are meant for the general interests of wholesale clients of CIBC Australia Limited.
This presentation has been prepared by the CIBC group and is issued in Hong Kong by Canadian Imperial Bank of Commerce, Hong Kong Branch, a registered
institution under the Securities and Futures Ordinance, Cap 571 (the “SFO”). This presentation is intended for “professional investors” only (within the
meaning of the SFO) and has been prepared for general circulation and does not take into account the objectives, financial situation or needs of any
recipient. Any recipient in Hong Kong who has any questions or requires further information on any matter arising from or relating to this presentation should
contact Canadian Imperial Bank of Commerce, Hong Kong Branch at Suite 3602, Cheung Kong Centre, 2 Queen’s Road Central, Hong Kong (telephone number:
+852 2841 6111). Orders for Hong Kong listed securities will be executed by Canadian Imperial Bank of Commerce, Hong Kong Branch. Canadian Imperial
Bank of Commerce, Hong Kong Branch has entered into an arrangement with its broker-dealer affiliates worldwide to execute orders for securities listed
outside of Hong Kong for Hong Kong clients.
This presentation is intended for distribution in Singapore solely to “institutional investors” (within the meanings of the Financial Advisers Act (Chapter 110
of Singapore)).
The securities mentioned in this presentation may not be suitable for all types of investors. This presentation does not take into account the investment
objectives, financial situation or specific needs of any particular client of CIBC World Markets. Recipients should consider this presentation as only a single
factor in making an investment decision and should not rely solely on investment recommendations contained herein, if any, as a substitution for the
exercise of independent judgment of the merits and risks of investments. The analyst writing the presentation is not a person or company with actual,
implied or apparent authority to act on behalf of any issuer mentioned in the presentation. Before making an investment decision with respect to any
security recommended in this presentation, the recipient should consider whether such recommendation is appropriate given the recipient's particular
investment needs, objectives and financial circumstances. CIBC World Markets suggests that, prior to acting on any of the recommendations herein,
Canadian retail clients of CIBC World Markets contact one of our client advisers in your jurisdiction to discuss your particular circumstances.
Non-client recipients of this presentation who are not institutional investor clients of CIBC World Markets should consult with an independent financial
advisor prior to making any investment decision based on this presentation or for any necessary explanation of its contents. CIBC World Markets will not treatVIII
Oil Update - October 18, 2018
Legal Disclaimer (Continued)
non-client recipients as its clients solely by virtue of their receiving this presentation.
Past performance is not a guarantee of future results, and no representation or warranty, express or implied, is made regarding future performance of any
security mentioned in this presentation. The price of the securities mentioned in this presentation and the income they produce may fluctuate and/or be
adversely affected by exchange rates, and investors may realize losses on investments in such securities, including the loss of investment principal. CIBC
World Markets accepts no liability for any loss arising from the use of information contained in this presentation, except to the extent that liability may arise
under specific statutes or regulations applicable to CIBC World Markets.
Information, opinions and statistical data contained in this presentation were obtained or derived from sources believed to be reliable, but CIBC World
Markets does not represent that any such information, opinion or statistical data is accurate or complete (with the exception of information contained in the
Important Disclosures section of this presentation provided by CIBC World Markets or individual research analysts), and they should not be relied upon as
such. All estimates, opinions and recommendations expressed herein constitute judgments as of the date of this presentation and are subject to change
without notice.
Nothing in this presentation constitutes legal, accounting or tax advice. Since the levels and bases of taxation can change, any reference in this presentation
to the impact of taxation should not be construed as offering tax advice on the tax consequences of investments. As with any investment having potential
tax implications, clients should consult with their own independent tax adviser.
This presentation may provide addresses of, or contain hyperlinks to, Internet web sites. CIBC World Markets has not reviewed the linked Internet web site of
any third party and takes no responsibility for the contents thereof. Each such address or hyperlink is provided solely for the recipient's convenience and
information, and the content of linked third-party web sites is not in any way incorporated into this document. Recipients who choose to access such third-
party web sites or follow such hyperlinks do so at their own risk.
Although each company issuing this presentation is a wholly owned subsidiary of Canadian Imperial Bank of Commerce (“CIBC”), each is solely responsible for
its contractual obligations and commitments, and any securities products offered or recommended to or purchased or sold in any client accounts (i) will not
be insured by the Federal Deposit Insurance Corporation (“FDIC”), the Canada Deposit Insurance Corporation or other similar deposit insurance, (ii) will not
be deposits or other obligations of CIBC, (iii) will not be endorsed or guaranteed by CIBC, and (iv) will be subject to investment risks, including possible loss
of the principal invested. The CIBC trademark is used under license.
© 2018 CIBC World Markets Inc. All rights reserved. Unauthorized use, distribution, duplication or disclosure without the prior written permission of CIBC
World Markets is prohibited by law and may result in prosecution.You can also read