Analysis of U.S. Food Waste Among Food Manufacturers, Retailers, and Restaurants
←
→
Page content transcription
If your browser does not render page correctly, please read the page content below

Analysis of U.S. Food Waste Among
Food Manufacturers, Retailers, and
Restaurants
Prepared for the Food Waste Reduction Alliance

2014

www.bsr.org

About This Report
This is the second report of the Food Waste Reduction Alliance (FWRA), a
collaborative effort between the Food Marketing Institute (FMI), Grocery
Manufacturers Association (GMA), and National Restaurant Association (NRA) to
assess, analyze, and reduce food waste both collectively and individually for food
retailers, wholesalers, manufacturers, and restaurants. Recognizing the
opportunity to help address the lack of publicly available data on commercial and
industrial food waste in the United States, FWRA sought BSR’s support to
analyze food waste data gathered from FMI, GMA, and NRA members. This
effort was undertaken in order to better understand the scale and nature of food
waste generation and disposal and to spur knowledge, innovation, and action to
reduce food waste in the food industry supply chain.

This report analyzes survey data on food waste donation, reuse and recycling,
and disposal by respondents in the food manufacturing, wholesale, retail, and
restaurant sectors. It also characterizes barriers to higher rates of donation,
reuse, and recycling in these sectors. We focus on the aspects of the food supply
chain that are directly managed by manufacturers, wholesalers, retailers, and
restaurants and do not address food waste generated during agricultural
production or by consumers at home. We target food waste reduction efforts and
do not address other sustainability aspects of the food system. We cite the
volume of food waste generation but do not analyze it in depth, given the
difficulties of assessing source reduction efforts via a quantitative survey. BSR
recognizes that food waste generation is an important part of the overall puzzle
and would recommend that future research examine this area in more detail.

This data was collected through a survey developed by the FWRA and sent to
manufacturing, wholesale, retail, and restaurant companies by the FMI, GMA,
and NRA. Although BSR did not design the survey, we led the interpretation and
analysis of the results. Related assumptions and extrapolations are detailed in
Appendix A.

This survey and report will help food manufacturers, wholesalers, retailers, and
restaurants understand the current state of food waste diversion in their industry,
improve internal measurement and management of food waste, develop
individual and collective solutions to shared barriers, and track progress over
time.

Please direct comments or questions to Corinna Kester at ckester@bsr.org.

DISCLAIMER
BSR publishes occasional papers as a contribution to the understanding of the
role of business in society and the trends related to corporate social responsibility
and responsible business practices. BSR maintains a policy of not acting as a
representative of its membership, nor does it endorse specific policies or
standards. The views expressed in this publication are those of its authors and
do not reflect those of BSR members.

ABOUT BSR
BSR is a global nonprofit organization that works with its network of more than
250 member companies to build a just and sustainable world. From its offices in
Asia, Europe, and North America, BSR develops sustainable business strategies
and solutions through consulting, research, and cross-sector collaboration. Visit
www.bsr.org for more information about BSR’s more than 20 years of leadership
in sustainability.

BSR | Analysis of U.S. Food Waste Among Food Manufacturers, Retailers, and Restaurants   2
ABOUT FMI
Food Marketing Institute proudly advocates on behalf of the food retail industry.
FMI’s U.S. members operate nearly 40,000 retail food stores and 25,000
pharmacies, representing a combined annual sales volume of almost US$770
billion. Through programs in public affairs, food safety, research, education, and
industry relations, FMI offers resources and provides valuable benefits to more
than 1,225 food retail and wholesale member companies in the United States
and around the world. FMI membership covers the spectrum of diverse venues
where food is sold, including single-owner grocery stores, large multistore
supermarket chains, and mixed retail stores. For more information, visit
www.fmi.org, and for information regarding the FMI Foundation, visit
www.fmifoundation.org.

ABOUT GMA
The Grocery Manufacturers Association is the voice of more than 300 leading
food, beverage, and consumer product companies that sustain and enhance the
quality of life for hundreds of millions of people in the United States and around
the globe. Based in Washington, D.C., GMA’s member organizations include
internationally recognized brands as well as steadily growing, localized brands.
Founded in 1908, GMA is an active, vocal advocate for its member companies
and a trusted source of information about the industry and the products
consumers rely on and enjoy every day. The association and its member
companies are committed to meeting the needs of consumers through product
innovation, responsible business practices, and effective public policy solutions
developed through a genuine partnership with policymakers and other
stakeholders. For more information, visit www.gmaonline.org.

ABOUT NRA
The National Restaurant Association is the largest food-service trade association
in the world—supporting nearly 536,000 restaurant businesses. In partnership
with state restaurant associations (SRAs), the NRA works every day to empower
all restaurant owners and operators to achieve more than they thought possible.
The National Restaurant Association represents and advocates for food-service
industry interests with state, local, and national policymakers—taking on financial
and regulatory obstacles before they hit members’ bottom line. The NRA
provides tools and systems that help members of all sizes get significantly better
operating results. And the association offers the kinds of networking, education,
and research resources that are only possible because of a vast and active
membership base. For more information, visit www.restaurant.org.

BSR | Analysis of U.S. Food Waste Among Food Manufacturers, Retailers, and Restaurants   3
© COPYRIGHT 2014 by Food Marketing Institute, Grocery Manufacturers
Association, and National Restaurant Association. Reproduction of “Analysis of
U.S. Food Waste Among Food Manufacturers, Retailers, and Restaurants” in any
form is prohibited except with prior written permission of the Food Marketing
Institute (FMI), Grocery Manufacturers Association (GMA), and National
Restaurant Association (NRA). FMI, GMA, and NRA do not guarantee the
accuracy, adequacy, completeness, or availability of any information and are not
responsible for any errors or omissions or for the results obtained from the use of
such information. FMI, GMA, AND NRA GIVE NO EXPRESS OR IMPLIED
WARRANTIES, INCLUDING, BUT NOT LIMITED TO, ANY WARRANTIES OF
MERCHANTABILITY OR FITNESS FOR A PARTICULAR PURPOSE OR USE.
In no event shall FMI, GMA, and NRA be liable for any ingredient, special, or
consequential damages in connection with any use of “Analysis of U.S. Food
Waste Among Food Manufacturers, Retailers, and Restaurants.”

BSR | Analysis of U.S. Food Waste Among Food Manufacturers, Retailers, and Restaurants   4
Contents
6      Introduction

10     Summary of Survey Findings

11     Survey Findings: Manufacturing Sector

14     Survey Findings: Retail and Wholesale Sectors

18     Survey Findings: Restaurant Sector

22     Next Steps

24     Appendix A: Additional Analysis Details

26     Appendix B: 2014 Food Manufacturer and Retailer Food Donation and
       Food Waste Survey

30     Appendix C: 2014 National Restaurant Association Food Donation
       and Food Waste Survey

BSR | Analysis of U.S. Food Waste Among Food Manufacturers, Retailers, and Restaurants   5
Introduction
If we hope to be able to feed the projected world
population of 9 billion by 2050, changes need to
occur throughout the current food system,
including agricultural production, food processing,
distribution, and consumption. Reducing the
amount of food that is wasted is a crucial step.1
While estimates of the scale of global food waste vary, there is broad consensus
2
among experts that significant opportunities to reduce food waste exist. For
example, it has been estimated that as much as 30 percent of all food grown
3
worldwide may be lost or wasted.
The issue of food waste has implications for food security, environmental
sustainability, and global hunger. Globally, we will need to feed 8 billion people
4
by 2030 and 9 billion by 2050. The UN Food and Agriculture Organization (FAO)
projects that, under current production and consumption trends, global food
production must increase 60 percent by 2050 in order to meet the demands of
5
the growing world population. Also according to the FAO, without accounting for
greenhouse gas (GHG) emissions from land use change, the carbon footprint of
food produced and not eaten is approximately 3.3 gigatons of CO2 equivalent,
6
and the water footprint is estimated to be about 250 cubic kilometers of water.
This analysis, commissioned by the Food Waste Reduction Alliance, estimates
food waste from food manufacturers, wholesalers, retailers, and restaurants in
1
U.K. Government Office for Science, “The Future of Food and Farming: Challenges and Choices for
Global Sustainability,” January 2011.
2
For example, UN Food and Agriculture Organization, “Global Food Losses and Food Waste,” and
U.S. Environmental Protection Agency, “2012 Municipal Solid Waste Characterization Report.”
3
U.K. Government Office for Science, “The Future of Food and Farming: Challenges and Choices for
Global Sustainability,” January 2011.
4
Ibid.
5
UN Food and Agriculture Organization, “Food Wastage Footprint: Impacts on Natural Resources,”
2013.
6
Ibid.
BSR | Analysis of U.S. Food Waste Among Food Manufacturers, Retailers, and Restaurants 6the United States, in an effort to gather better data on the amount of food waste
generated in their sectors and how this volume can be reduced.
The Food Waste Reduction Alliance (FWRA) is an industry-wide effort to reduce
food waste among food manufacturers, grocery wholesalers and retailers, and
restaurants. Founded in 2011, it is led by the Food Marketing Institute (FMI),
Grocery Manufacturers Association (GMA), and National Restaurant Association
(NRA), with active leadership and participation by its more than 30 corporate
members.
Seeking to reduce food waste throughout the supply chain, FWRA’s goals are
threefold:
1. To avoid and reduce food waste wherever possible within members’
operations and supply chains.
2. To increase the donation of safe and healthy foods that would have gone
to waste and to send food to food banks to help address hunger issues.
3. To divert unavoidable food waste away from landfills toward higher value
uses, such as animal feed, composting, and conversion from waste to
energy.
To meet these goals, the FWRA has four established working groups, on best
practices and emerging solutions, food waste assessment, communication, and
public policy. Earlier in 2014, the FWRA released the “Best Practices & Emerging
Solutions Toolkit,” to highlight successful case studies and provide guidance for
companies on how to reduce food waste.
This analysis is based on survey data collected directly from companies in the
food manufacturing, food retail, and restaurant sectors. Data gathering is a
priority for the FWRA as it allows members to assess the current state of food
waste diversion, improve the measurement and management of food waste, and
track progress over time. This is FWRA’s second survey and assessment of food
waste.
Survey Methodology
To better understand the food waste reduction efforts of food manufacturers,
wholesalers, grocery retailers, and restaurants in the United States, FMI, GMA,
and NRA sent a paper-based survey to a cross-section of their respective
7
members in 2014. (Copies of the surveys are included in Appendixes B and C.)
The survey’s objective was to collect data on:
» Donations of unsaleable food for human consumption
» Food waste reuse and recycling
» Food waste disposal
» Barriers to higher rates of donation, reuse, and recycling
Because a subset of companies in each sector opted to participate, the survey
represents a snapshot of practices within the industry. In the manufacturing
7
FMI, GMA, and NRA sought broad participation in the survey; it was sent to more than 200
individuals. We targeted outreach to our largest members to help ensure that the companies
generating the most food waste were included in the findings.
BSR | Analysis of U.S. Food Waste Among Food Manufacturers, Retailers, and Restaurants 7sector, there were 16 survey respondents representing US$137 billion in annual
U.S. sales (accounting for 17 percent of total projected sales for U.S. food
8
manufacturers ). In the retail and wholesale sectors, there were 13 survey
respondents representing US$279 billion in annual U.S. sales (accounting for
9
31.8 percent of total projected sales for U.S. retailers and wholesalers ). In the
restaurant sector, there were 27 survey respondents (14 companies with more
than 10 locations each) representing US$74 billion in annual U.S. sales
(accounting for 15.2 percent of total projected sales for the industry segments
10 11
represented by the respondents ).
All participating companies submitted data for their U.S. operations for the 2013
calendar year. Where relevant, this is compared with 2011 data collected in a
similar previous survey. However, because only a portion of the industry is
represented in the survey, extrapolations should be made with caution.
Definitions
These terms are used throughout this report and align with FWRA’s definitions of
food waste:
» Food waste: Any solid or liquid food substance, raw or cooked, which is
discarded, or intended or required to be discarded. Food waste includes the
organic residues (such as carrot or potato peels) generated by the
processing, handling, storage, sale, preparation, cooking, and serving of
food.
» Food waste diversion: Pertains to all food that is not sold or consumed,
which could be diverted to a higher value use than landfill or incineration.
This includes:
- Unsaleable food donation given to food banks and other
organizations that serve people in need; and
- Food waste reuse and recycling, e.g., composting, conversion to
animal feed, reuse of waste oils to produce fuel, etc.
» Food waste disposal: Food or food scraps that are transported to traditional
disposal facilities, such as landfills, municipal waste incinerators, and
wastewater treatment plants.
» Food waste generation: The sum of food waste diversion and food waste
disposal.
» Unsaleable food: Consumer products that are removed from the primary
channel of distribution for any reason and that may or may not be processed
through product reclamation centers. Unsaleable food may be generated
throughout the manufacturing and retail value chain, as described in the
following examples. Mistakes during production may result in food that is
perfectly safe and edible, but unable to be sold because of quality,
overproduction, or labeling issues. Product ingredients and semifinished
8
Based on 2011 U.S. food and beverage manufacturing revenue of US$805 billion (source: U.S.
Census Bureau’s Annual Survey of Manufacturers, North American Industry Classification System
Codes 311 and 3121).
9
Based on 2013 U.S. grocery retail revenue of US$740 billion (source: Progressive Grocer) and 2013
U.S. grocery wholesale revenue of US$137 billion (source: IBIS World). Grocery retail excludes
convenience stores.
10
Based on 2013 U.S. commercial restaurant and managed services revenue of US$486 billion
(source: National Restaurant Association 2014 Restaurant Industry Forecast). This excludes bars and
taverns, restaurants within hotels and retail outlets, and recreation and sports facilities, as there were
no survey respondents from those segments.
11
The data in this report includes only the results from the respondents to this survey.
BSR | Analysis of U.S. Food Waste Among Food Manufacturers, Retailers, and Restaurants 8products that are unsuitable for retail but are safe for human consumption
may also be donated. The outer packaging of grocery items may become
damaged during distribution and retail operations, thus making them
unsuitable for sale but still perfectly safe to eat. Fresh food such as day-old
bread, produce with blemishes, prepared foods, and other perishable items
that are near sell-by dates may also be unsuitable for sale, but safe for
12
consumption.
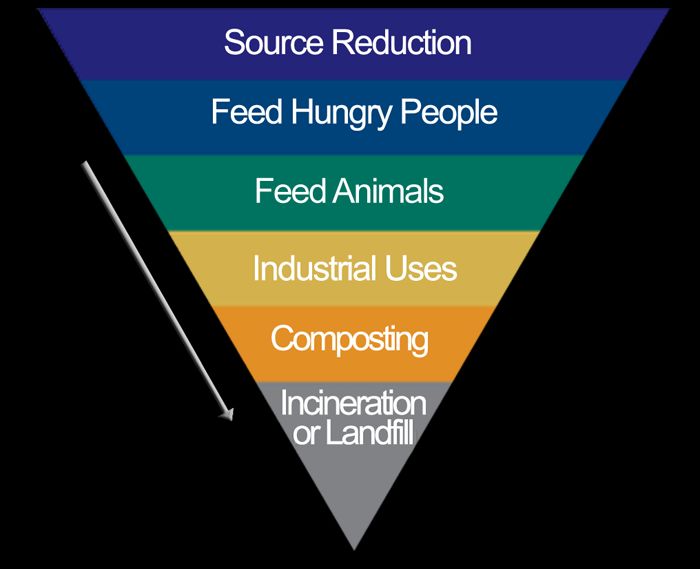
The U.S. Environmental Protection Agency (EPA) has developed a hierarchy of
13
recovery options for mitigating food waste to landfills, as shown in Figure 1. In
the figure, reducing food waste is preferred, and the food recovery methods are
listed in order of preference from top to bottom. The hierarchy serves as an
aspirational guide for efforts to minimize waste; not all waste diversion methods
will be appropriate in every situation.
Figure 1. U.S. EPA Food Recovery Hierarchy
Structure of Findings
The survey findings are outlined in separate sections for each sector:
manufacturing, retail and wholesale, and restaurant (following the food supply
chain). Each section outlines the amount of food waste generated, donated,
recycled, and disposed of in each sector, how food waste is being diverted from
landfills, challenges to gathering data on food waste, and barriers that must be
overcome to decrease the amount of food that is thrown away. The report
concludes with recommendations and considerations for additional data
collection.
12
Not all companies track their saleable and unsaleable food donations as separate figures, so the
amount of donated food cited in this report does include some saleable food. Where possible, only
unsaleable food is included.
13
U.S. Environmental Protection Agency, Food Recovery Hierarchy, available at
www.epa.gov/smm/foodrecovery/.
BSR | Analysis of U.S. Food Waste Among Food Manufacturers, Retailers, and Restaurants 9Summary of Survey Findings
The food waste profiles of the food manufacturing, retail and wholesale, and
restaurant sectors differ significantly, which reflects their different operating
environments. Differences include the number of locations, type and amount of
food disposed of, and average distance from food recycling facilities, as well as
many other considerations. As a result, the performance of the sectors should be
compared with strong caution—different business models mean significantly
different constraints and possibilities for food waste diversion.
Though the survey respondents represent only a portion of each industry, their
responses give insight into food waste trends. In the 2013 survey:
» Manufacturing respondents reported donating or recycling 94.9
percent of food waste; of this, more than 85 percent is repurposed for
animal feed.
» Retail and wholesale respondents reported donating or recycling 42.4
percent of food waste; composting and donation are the most common
diversion methods.
» Restaurant respondents reported donating or recycling 15.7 percent of
food waste; of this, more than 70 percent is cooking oil recycling.
» Retail and wholesale respondents generated the smallest volume of
food waste (0.010 pounds per dollar of company revenue, compared to
0.033 pounds per dollar for restaurant respondents and 0.053 pounds
per dollar for manufacturing respondents).
Based on the survey results, companies have opportunities to continue to reduce
the amount of food waste they generate within the supply chain, as well as to
identify options for directing it toward higher uses, as outlined in the EPA’s Food
Recovery Hierarchy.
» Food manufacturers have an opportunity to reduce the amount of food
waste they generate and to move up the food waste hierarchy to
increase the percentage of food that is donated (1.5 percent in 2013).
» Food retailers and wholesalers have an opportunity to divert more
waste from landfills to higher uses.
» Restaurants have an opportunity to divert more waste from landfills to
higher uses and to reduce the amount of food waste they generate.
Efforts to reduce and divert food waste will need to address a number of barriers.
Transportation constraints, liability concerns, and insufficient storage space were
the most commonly cited barriers to food donation. The most frequently cited
obstacles to food recycling were transportation constraints and an insufficient
number of recycling options. The FWRA’s efforts to help companies share best
practices and address common challenges will be useful in overcoming a number
of key barriers.
BSR | Analysis of U.S. Food Waste Among Food Manufacturers, Retailers, and Restaurants 10Survey Findings: Manufacturing Sector
Sector Context
The food waste profile of the manufacturing sector reflects the industry’s unique
operating conditions. Manufacturers have large volumes of food and ingredients
and a relatively limited number of manufacturing locations. Higher food waste
volumes per location allows for greater economies of scale when recycling food
products, leading to a focus on recycling as the primary diversion method.
In addition, manufacturers have a significant amount of semifinished products,
such as ingredients or sauces, and unavoidable waste, such as trimmings and
peels. For example, if a company changes the vegetables in a frozen entrée or
discontinues a particular variety of yogurt, a manufacturing facility can find itself
with tens of thousands of pounds of unneeded vegetables, fruit, or similar
ingredients, which may be challenging to donate due to regulatory or food bank
requirements. Similarly, since vegetable and fruit trimmings and peels cannot be
donated, adding them to animal feed may be the best use of that organic
material.
Food Waste Diversion
The vast majority (94.9 percent) of food waste generated by manufacturing
survey respondents in 2013 was donated or recycled, as shown in Figure 2. On
average, survey respondents generated 53 pounds of food waste per thousand
dollars of company revenue. As an illustrative example, for a large company with
$1 billion in revenues, average food waste generation (based on survey results)
would be 53 million pounds. The total food waste generated, for the 15
manufacturers that submitted full survey results, was 7.1 billion pounds.
Figure 2. Destination of Food Waste, Manufacturing Sector Respondents
100%
80%
60% Donated, 1.5%
Recycled, 93.4%
40% Disposed of, 5.1%
20%
0%
These results are consistent with the food waste diversion results reported in
2011 (1.6 percent of respondent food waste was donated, 93 percent was
recycled, and 5.4 percent was disposed of). Indeed, the results do not show any
statistically significant change from 2011 to 2013; any small changes are likely a
BSR | Analysis of U.S. Food Waste Among Food Manufacturers, Retailers, and Restaurants 1114
result of different companies responding to the survey and do not necessarily
reflect changes in industry performance overall.
Food waste diversion rates commonly vary from company to company; for
manufacturing sector respondents, anywhere between 65 and 100 percent of
food waste is typically donated or recycled. This diversity in approaches to
managing food waste is partially due to different company business models (for
example, beverage producers have different diversion options than do food
producers) and partially due to different levels of expertise and emphasis on food
waste diversion.
METHODS
Figure 3 below provides additional details about the methods that manufacturing
respondents use to divert food waste to higher uses. In 2013, animal feed was
the main method for diverting food waste, with 86.8 percent percent of all
diverted food being converted into animal feed. Land application was the second
most common diversion method, with 3.5 percent of diverted food waste recycled
in this manner. This is consistent with the 2011 survey results, in which animal
feed was also the primary method of diverting food waste.
The FWRA has highlighted a number of best practices and successful case
studies for the manufacturing industry, including partnerships with donation
organizations like Feeding America and Food Donation Connection. Some
specific examples can be found in the FWRA “Best Practices & Emerging
15
Solutions Toolkit.”
Figure 3. Destination of Diverted Food Waste, Manufacturing Sector
Respondents (as a percentage of the amount of food waste diverted)
100%
80% Donated, 1.6%
Aerobic or anaerobic digestion, 0.1%
60% Rendering or biofuel, 1.7%
Land application, 3.5%
40% Composting, 2.0%
Animal feed, 86.8%
20% Other, 4.4%
0%
14
Six companies (37.5 percent) were first-time respondents in 2013. Ten companies participated in
both the 2011 and 2013 surveys. Three companies that participated in 2011 did not participate in
2013.
15
Food Waste Reduction Alliance, “Best Practices & Emerging Solutions Toolkit,” 2014,
www.foodwastealliance.org/wp-content/uploads/2014/04/FWRA_Toolkit_FINAL_0415141.pdf.
BSR | Analysis of U.S. Food Waste Among Food Manufacturers, Retailers, and Restaurants 12Barriers to Decreasing Food Waste
Sixty percent of manufacturing respondents indicated that there are barriers to
food donation, and 63 percent indicated that there are barriers to food waste
recycling. For those companies that identified barriers, Tables 1 and 2 outline the
major barriers they face. Each group’s top barriers are in bold.
Table 1. Barriers to Donating Food, Manufacturing Sector
Manufacturing Sector
Transportation constraints 67%
Liability concerns 67%
Regulatory constraints 67%
Insufficient storage and refrigeration at food banks 44%
Insufficient storage and refrigeration on site 33%
Table 2. Barriers to Recycling Food Waste, Manufacturing Sector
Manufacturing Sector
Insufficient recycling options 70%
Transportation constraints 70%
Liability concerns 50%
Concerns about collection and storage related to 50%
food safety
The top barriers to donation are transportation constraints, liability concerns, and
regulatory constraints, while the top barriers to recycling are insufficient recycling
options and transportation constraints.
Specific barriers mentioned for food donation include an inability to donate
mislabeled or misformulated food, a lack of refrigerated storage for donations,
limited employee awareness of donation programs, and a lack of organizations or
resources to accept the donated food.
Specific barriers mentioned for food recycling include the limited availability of
recycling facilities, transportation costs associated with long travel distances,
strict internal requirements for food waste handling, liability concerns, and
regulatory requirements that limit the reuse of certain types of food waste.
BSR | Analysis of U.S. Food Waste Among Food Manufacturers, Retailers, and Restaurants 13Survey Findings: Retail and Wholesale Sectors
Sector Context
The food waste profile of the retail and wholesale sectors reflects the industry’s
unique operating conditions. Retailers, for example, have numerous locations
and a very diverse range of products. As a result, food waste diversion is a
significant management and logistical challenge. In addition, each department
within a store has its own food diversion requirements, adding further complexity.
In addition, retailers primarily handle finished food products, which are often
packaged. Packaged products are more suitable for donation and are often
harder to recycle, because most recyclers require that the packaging be
removed. The predominance of finished food products is one of the factors
contributing to retailers’ and wholesalers’ higher donation rate (13.2 percent of
food waste generated, as shown in Figure 4).
Because many retailers also have wholesale and food distribution operations, the
retail and wholesale sectors are grouped together for the purposes of this
analysis. In addition, a number of retailers also own manufacturing facilities for
food produced under the company’s private label.
Food Waste Diversion
Approximately 42.4 percent of the food waste generated by retail and wholesale
survey respondents in 2013 was donated or recycled, as shown in Figure 4. On
average, survey respondents generated 10 pounds of food waste per thousand
dollars of company revenue. As an illustrative example, for a large company with
US$1 billion in revenues, average food waste generation (based on survey
results) would be 10 million pounds. The total food waste generated, for the 10
retailers and wholesalers that submitted full survey results, was 1.4 billion
pounds.
Figure 4. Destination of Food Waste, Retail and Wholesale Sector
16
Respondents
100%
80%
60% Donated, 13.2%
Recycled, 29.2%
40% Disposed of, 57.6%
20%
0%
16
Note: Because there were significant differences in the companies responding to the 2011 and
2013 surveys, the results in Figure 4 cannot be directly compared with the published 2011 survey
findings. For year-to-year comparisons, please see Table 3.
BSR | Analysis of U.S. Food Waste Among Food Manufacturers, Retailers, and Restaurants 14To begin tracking year-to-year results, we identified the companies providing
complete responses in both 2011 and 2013. The food waste diversion of these
firms (which represent 7 percent of total projected sales for U.S. retailers and
17
wholesalers) is shown in Table 3.
Table 3. Destination of Food Waste, 2011 and 2013
2011 2013
Donated 13% 14%
Recycled 30% 36%
Disposed of 57% 50%
Though the data in Table 3 do not represent the performance of the entire
industry, it can be seen that, for these several companies, the percentage of food
waste going to landfills has decreased from 57 percent of total food waste in
2011 to 50 percent in 2013.
Food waste diversion rates commonly vary from company to company; for retail
and wholesale respondents, anywhere between 10 and 80 percent of food waste
is donated or recycled. This diversity in approaches to managing food waste is
partially due to different company business models (for example, whether
retailers also manufacture their own-brand foods) and partially due to different
levels of expertise and emphasis on food waste diversion.
METHODS
Figure 5 below provides additional details about the methods that retail and
wholesale respondents use to divert food waste to higher uses. In 2013,
composting was a common diversion method, representing 24.6 percent of food
waste diversion, closely followed by donation at 23.3 percent.
The study “Decades of Donations: The 2012 Survey of the Food Retail Industry’s
Support of Food Banks” reports that of 74 retail respondents, 99 percent support
their local food bank by donating a variety of goods and services. More than
three-quarters (76 percent) of retailers indicated they had donated food items to
food banks. In total in 2012, retailers were responsible for more than 800 million
pounds of food contributed to food banks. According to Feeding America, the
nation’s leading domestic hunger-relief charity, this figure makes food retail
18
contributions the largest donation stream within the food bank network.
The FWRA has highlighted a number of best practices and successful case
studies for the wholesale and retail sectors. For more information, please see the
19
“Best Practices & Emerging Solutions Toolkit.”
17
Four companies (30.8 percent) were first-time respondents in 2013. Nine companies participated in
both the 2011 and 2013 surveys. Four companies that participated in 2011 did not participate in 2013.
18
Food Marketing Institute, “Decades of Donations: The 2012 Survey of the Food Retail Industry’s
Support of Food Banks,” 2012, available at
www.fmi.org/forms/store/ProductFormPublic/search?action=1&Product_productNumber=2394.
19
Food Waste Reduction Alliance, “Best Practices & Emerging Solutions Toolkit,” 2014,
www.foodwastealliance.org/wp-content/uploads/2014/04/FWRA_Toolkit_FINAL_0415141.pdf.
BSR | Analysis of U.S. Food Waste Among Food Manufacturers, Retailers, and Restaurants 15Figure 5. Destination of Diverted Food Waste, Retail and Wholesale Sector
Respondents (as a percentage of the amount of food waste diverted)
100%
Donated, 23.3%
80%
Aerobic or anaerobic digestion, 8.3%
Rendering or biofuel, 10.3%
60%
Land application, 7.0%
40% Composting, 24.6%
Animal feed, 26.2%
20% Other, 0.3%
0%
Barriers to Decreasing Food Waste
All retail and wholesale respondents indicated that there are barriers to food
donation, and 92 percent indicated that there are barriers to food waste recycling.
For those companies that identified barriers, Tables 4 and 5 outline the major
barriers to decreasing food waste as identified by retailer and wholesaler survey
respondents. Each group’s top two barriers are in bold.
Table 4. Barriers to Donating Food, Retail and Wholesale Sectors
Retail and
Wholesale Sectors
Transportation constraints 69%
Insufficient storage and refrigeration at food banks 69%
Liability concerns 54%
Insufficient storage and refrigeration on site 46%
Regulatory constraints 15%
Table 5. Barriers to Recycling Food Waste, Retail and Wholesale Sectors
Retail and
Wholesale Sectors
Insufficient recycling options 92%
Transportation constraints 58%
Concerns about collection and storage related to 50%
food safety
Liability concerns 41%
The top barriers to donation are transportation constraints and insufficient
storage and refrigeration at food banks, while the top barriers to recycling are
insufficient recycling options and transportation constraints.
Specific barriers mentioned for food donation include regulatory mandates to
destroy returned products, space limitations at retail stores and at food banks,
BSR | Analysis of U.S. Food Waste Among Food Manufacturers, Retailers, and Restaurants 16inability to keep food cold throughout the donation process, food safety concerns, lack of internal understanding of the benefits of donating food, insufficient food volumes to justify pickup by the food bank, inconsistent rules across food banks regarding what food they will accept, and labor costs to sort donated food. Specific barriers mentioned for food recycling include the limited availability of organic recycling facilities, difficulty making the business case for cost effectiveness when compared to disposal (especially with low landfill tipping fees in certain areas of the country), distance between stores and recycling facilities (leading to a high cost of transport), sanitation and space constraints related to food storage, and the high cost of on-site solutions like digesters. BSR | Analysis of U.S. Food Waste Among Food Manufacturers, Retailers, and Restaurants 17
Survey Findings: Restaurant Sector
Sector Context

The restaurant sector faces unique challenges with regard to diverting and
recycling food waste that should be explained to give context to the following
data. The restaurant sector includes many different types of businesses—from
managed-services cafeteria operations to quick-service restaurants to fine dining
establishments. The options for decreasing and diverting food waste differ
significantly for each of these different types of restaurants.

For example, full-service restaurants generally have more food waste generated
on their premises, as customers mainly consume the food on site. Quick-service
restaurants generally have less on-site-generated food waste, as customers
often take their food to go, disposing of waste off the premises. Notably, retailers
and manufacturers (for the most part) do not handle significant amounts of food
waste generated by consumers; this is a challenge unique to the restaurant
sector.

Another factor that can complicate the tracking and management of food waste
diversion in a multiunit restaurant company is whether restaurant locations are
franchised. Corporate and brand headquarters have limited access to and control
over the activities of franchised locations, which are owned and operated by a
third party. It can be more challenging for companies with a franchise-based
business model to centrally track food waste and institute system-wide food
waste programs, as individual franchises may use different donation, recycling,
and disposal partners, depending on their location. At the same time, though
single-unit restaurants are more centralized, it can also be difficult for smaller
organizations to dedicate the resources and staff time necessary to manage food
waste programs.

In regard to donation of prepared food, a restaurant must consider many factors,
such as food safety concerns, local laws and regulations, and food storage and
transportation.

Finally, for food waste recycling, the availability of composting is a major
challenge; composting infrastructure is unavailable in many places in the United
States. The relative lack of economic incentives for composting is a factor as
well, especially compared with used cooking oil recycling (which is in demand for
                          20
conversion to biodiesel).

Food Waste Diversion

The restaurant sector faces the unique challenge of diverting food waste that
consumers themselves generate on site. Approximately 15.7 percent of food
                                                              21
waste generated by restaurant survey respondents in 2013 was donated or
recycled, as shown in Figure 6. On average, survey respondents generated 33
pounds of food waste per thousand dollars of company revenue. As an
illustrative example, for a large company with $1 billion in revenues, average
food waste generation (based on survey results) would be 33 million pounds. The

20
   CNBC, “Rising Gas Prices Create Smoking Hot Demand for Used Cooking Oil,” 2012, available at
www.cnbc.com/id/46607261.
21
   Not all survey responses were able to be included in the survey findings; please see Appendix A for
additional details.

BSR | Analysis of U.S. Food Waste Among Food Manufacturers, Retailers, and Restaurants          18
total food waste generated, for the restaurant companies that submitted full
22
survey results, was 2.1 billion pounds.
Figure 6. Destination of Food Waste, Restaurant Sector Respondents
100%
80%
60% Donated, 1.4%
Recycled, 14.3%
40% Disposed of, 84.3%
20%
0%
Food waste diversion rates commonly vary from company to company;
restaurant respondents donate or recycle anywhere between 10 and 60 percent
of their food waste. One explanation for this diversity is the fact, discussed
above, that the restaurant sector includes many different types of businesses,
including quick-service and full-service restaurants, which have very different
food waste profiles. Another explanation is companies’ varying levels of expertise
and emphasis on food waste diversion.
METHODS
Figure 7 below provides additional details about the methods that restaurant
survey respondents use to divert food waste to higher uses. The most common
method of diverting food waste was the recycling of used cooking oil, followed by
composting and then food donation.
The results of the survey conducted for this report specifically addressed
donation of food that would otherwise have been discarded as waste, not
restaurants’ overall charitable food donations. A separate, recent survey of more
than 1,000 restaurant operators found that 22 percent of restaurants donate
23
leftover food to food banks or other organizations, and previous NRA research
shows that 73 percent of restaurants—a significantly larger number—donate food
as part of their community service efforts, which can consist of donation of both
leftover or unsaleable food, as well as saleable food prepared for donation
24
purposes.
The FWRA has highlighted a number of best practices and successful case
studies for the restaurant sector. For more information, please see the “Best
25
Practices & Emerging Solutions Toolkit.”
22
Ten large companies and seven small companies submitted full survey results so are included in
this total. For the purposes of this report, large restaurant companies are defined as having more
than ten locations, and small companies are defined as having less than ten locations.
23
National Restaurant Association, “Restaurant Operator Survey,” 2014, unpublished research.
24
National Restaurant Association, “Restaurant Industry Charitable Activities: Research Update,”
September 2010.
25
Food Waste Reduction Alliance, “Best Practices & Emerging Solutions Toolkit,” 2014.
www.foodwastealliance.org/wp-content/uploads/2014/04/FWRA_Toolkit_FINAL_0415141.pdf.
BSR | Analysis of U.S. Food Waste Among Food Manufacturers, Retailers, and Restaurants 19Figure 7. Destination of Diverted Food Waste, Restaurant Sector
Respondents (as a percentage of the amount of food waste diverted)
100%
80%
Donated, 8.8%
60% Used cooking oil recycling, 71.5%
Composting, 19.4%
40%
Animal feed, 0.1%
Other, 0.3%
20%
0%
Barriers to Decreasing Food Waste
For large restaurant companies (those with more than 10 locations), 64 percent
of those surveyed indicated that there are barriers to food donation, and 92
percent indicated that there are barriers to food waste recycling. For smaller
restaurants, 64 percent of those surveyed also indicated that there are barriers to
food donation, and 54 percent indicated that there are barriers to food waste
recycling. For those companies that identified barriers, Tables 6 and 7 outline the
major barriers they face. Each group’s top two barriers are in bold.
Table 6. Barriers to Donating Food, Restaurant Sector
Large
Small companies
companies (more than 10
(1–10 locations) locations)
Transportation constraints 78% 78%
Insufficient storage and refrigeration on 67% 67%
site
Liability concerns 67% 56%
Regulatory constraints 56% 56%
Insufficient storage and refrigeration at 22% 44%
food banks
BSR | Analysis of U.S. Food Waste Among Food Manufacturers, Retailers, and Restaurants 20Table 7. Barriers to Recycling Food Waste, Restaurant Sector
Small Large
companies companies
(1–10 (more than 10
locations) locations)
Insufficient recycling options 83% 100%
Management or building constraints 50% 83%
Transportation constraints 100% 67%
Concerns about collection and storage 33% 50%
related to food safety
Liability concerns 17% 33%
The top barriers to donation are transportation constraints, insufficient on-site
storage, and liability concerns, while the top barriers to recycling are insufficient
recycling options, transportation constraints, and management or building
constraints.
Specific barriers mentioned for food donation include difficulties tracking data
from individual locations, employee training and engagement, short product shelf
life, too small an amount of food waste to justify a food bank pickup, liability for
branded products, storage at food banks for large donations, high cost of
transportation relative to the value of the product, and lack of control given a
franchised business model.
Specific barriers mentioned for food recycling include difficulties tracking data
from individual locations, employee training and engagement, extra cost relative
to waste disposal, lack of available recycling options, a lack of information on
how to start recycling programs, lack of space on site, food handling risks, and
pest concerns.
BSR | Analysis of U.S. Food Waste Among Food Manufacturers, Retailers, and Restaurants 21Next Steps
This survey represents the second time that industry-wide, corporate-level food
waste data has been gathered directly from U.S. food manufacturers,
wholesalers, and retailers. It is the first time that such data has been gathered
from restaurants. As the FWRA evaluates these results and collects more data,
there will be opportunities for collaborative action and for enhancing data
collection.
Opportunities for Taking Action
As noted earlier, one of the FWRA’s goals is to identify opportunities to share
best practices and collaborate to advance solutions that keep food waste out of
landfills and ensures that edible food is donated. Earlier in 2014, the FWRA
released the “Best Practices & Emerging Solutions Toolkit,” to provide
companies guidance on how to reduce food waste, as well as successful case
studies to learn from.
The following are some additional ways that companies can take action:
» The survey highlighted significant differences in food donation and recycling
rates from company to company. Companies can use the data in this report
to compare their performance with peers, determine if their diversion,
donation, and disposal rates are comparatively high or low, and share
targeted success stories and lessons they have learned.
» Survey participants identified many different barriers, and a myriad of
collaborative opportunities could follow. For instance, a group of companies
could focus on logistical solutions, such as opening a composting facility near
a cluster of food manufacturing facilities. Policy change may also be
achieved collaboratively; for example, changing tax policies to encourage
additional food donation. In addition, shared educational platforms may help
companies overcome internal barriers to change.
Considerations for Enhancing Data Collection
Compared with 2011, a number of food manufacturing, wholesale, and retail
companies have expanded their collection and reporting of food waste data, and
we anticipate that this expansion will continue in future years. In addition, there
are opportunities for expanding and strengthening this survey’s data collection in
future years, including:
» Number of participants: Continuing to increase the number of FMI, GMA,
and NRA members who participate in the survey will enable the FWRA to
estimate the amount and destination of food waste more accurately.
» Measurement approaches: Approaches to measuring food waste differ
significantly from company to company, which poses a challenge for
consistency of results. For example, some companies consider the
conversion of food waste into energy a form of diversion rather than disposal,
and some companies track saleable and unsaleable food donations as a
single figure.
» Ease of reporting: As the FWRA looks forward, an online food waste
tracking system would speed the reporting process and enable more
frequent reporting of results.
BSR | Analysis of U.S. Food Waste Among Food Manufacturers, Retailers, and Restaurants 22» Expanded assessment of food waste generation: As outlined in the EPA
Food Recovery Hierarchy, the first priority for addressing food waste is
source reduction. Future surveys should include additional detail on
approaches and barriers to reducing the amount of food waste generated in
the manufacturing, wholesale, retail, and restaurant sectors.
» Measurement standards: The World Resources Institute is coordinating the
development of the Food Loss & Waste Protocol, a multistakeholder effort to
develop a global standard for measuring food loss and waste. FWRA
members should become engaged in these standardization efforts, which will
help companies better track and compare their performance.
BSR | Analysis of U.S. Food Waste Among Food Manufacturers, Retailers, and Restaurants 23Appendix A: Additional Analysis Details
Below are several key assumptions and other factors that may impact the results
presented in this document:
» Data availability: Not all survey participants answered every survey
question. In particular, the amount of food waste sent to landfills was not
always available, as waste vendors do not typically track that figure
separately. (They usually track overall disposal volumes, not the composition
of the waste stream.) In this analysis, a company’s data was excluded from a
particular calculation if complete data for that calculation was unavailable. As
a result, the number of companies included in these findings varies from
calculation to calculation. Whenever possible, company data has been
included in the results.
» Saleable and unsaleable donations: Not all companies track separate
figures for the amount of saleable and unsaleable food donations, so the
amount of donated food cited in this report does include some saleable food.
Where possible, only unsaleable food is included.
» Rounding: Please note that the totals in figures may not add up to 100
percent due to rounding.
» Data accuracy: There are many areas where food waste data is not fully
available, and estimates and extrapolations must be made. Participants
reported varying levels of confidence in the data they provided. As part of the
survey, they were asked to self-report the accuracy of their responses on a
scale of 1 to 10, where 10 is most confident. In addition, as for any survey,
misinterpretations of the questions and inadvertent errors are possible. The
reported accuracy of the data is as follows:
Table 8. Reported Data Accuracy, Manufacturing Sector Respondents
2011 2013
Amount of food donated 7.96 7.33
Amount of food waste recycled 7.73 8.17
Amount of food waste disposed of 4.92 5.60
Total municipal waste disposed of Not collected 7.67
Table 9. Reported Data Accuracy, Retail and Wholesale Sector
Respondents
2011 2013
Amount of food donated 6.95 7.27
Amount of food waste recycled 7.73 8.08
Amount of food waste disposed of 5.12 5.20
Total municipal waste disposed of Not collected 7.42
BSR | Analysis of U.S. Food Waste Among Food Manufacturers, Retailers, and Restaurants 24Table 10. Reported Data Accuracy, Restaurant Sector Respondents
2013
Amount of food donated 7.14
Amount of food waste recycled 5.50
Amount of food waste disposed of 5.22
Total municipal waste disposed of 5.33
As can be seen in Tables 8 and 9, the accuracy of reported data improved
somewhat but did not change significantly between 2011 and 2013.
Notably, however, in both years survey respondents were least confident about
the amount of food waste disposed of. Because food waste is typically mixed
with other types of waste, waste-hauling vendors do not track it as a dedicated
waste stream. Instead, it must be assessed via a separate waste audit, which
involves gathering and sorting a sample of a facility’s waste and determining
what percentage is food, recyclables, and other materials. Guidance on
conducting a waste audit can be found in the FWRA “Best Practices & Emerging
Solutions Toolkit.”
Compared to the manufacturing and retail sectors, the restaurant sector reports a
lower level of confidence in both food waste recycling and municipal waste
disposal data; the difficulty of collecting data from a large number of locations is
likely a significant factor in this difference.
BSR | Analysis of U.S. Food Waste Among Food Manufacturers, Retailers, and Restaurants 25Appendix B: 2014 Food Manufacturer and
Retailer Food Donation and Food Waste
Survey
Every year Americans dispose of approximately 80 billion pounds of food waste and very
little of that waste is recovered. This means that for the 312.7 million people in the
United States, over 250 pounds of food per person is thrown out every year. Food sent to
a landfill represents lost opportunities to improve management efficiencies, to reduce
operating costs, to feed the hungry, to recover valuable resources, and to realize other
benefits.
The Grocery Manufacturers Association (GMA) and Food Marketing Institute (FMI) are
partnering with the National Restaurant Association (NRA) and other stakeholders in
order to address this important issue. The GMA, FMI, and NRA Food Waste Reduction
Alliance (FWRA) has two goals, which are to reduce the amount of food waste sent to
landfills and increase the amount of unsaleable food donated to food banks. The purpose
of this survey is to better understand how much food is being donated, how much food
waste is being recycled or recovered, and how much is sent to landfills and other waste
disposal facilities in the United States.
Your participation in this simple survey is critical to the success of this important
initiative. To ensure confidentiality, we have engaged BSR (Business for Social
Responsibility), a highly regarded sustainability organization, to handle all of the data.
Results will only be presented to GMA, FMI, and NRA in the aggregate without
attribution to any company. Please send the completed survey to Corinna Kester at
email: ckester@bsr.org or fax: (415) 984-3201. The survey response deadline is
March 14, 2014.
BSR will remove all identifying information before providing the aggregated data to
FWRA members. If follow up is required, it will be conducted by BSR so as to maintain
confidentiality.
If you have any questions or require additional information regarding this survey, please
contact Meghan Stasz at GMA (202-639-5935), Jeanne von Zastrow at FMI (435-259-
3342), or Corinna Kester at BSR (415-984-3244).
1. General Information: General information regarding the size of your
company is needed in order to analyze the data, and to make industry-wide
assumptions after the data is aggregated. Please provide a point of contact so that we
may follow up with you, if needed. All information will be kept confidential using
our third-party consultant.
a) Company name ________________________.
b) Annual U.S. sales (US$) ________________ Fiscal year __________.
c) Number of U.S. employees (rounded to the nearest thousand)
___________________.
d) Primary business: is your company (please only check one):
___ Primarily a food manufacturer
___ Primarily a food retailer
___ Primarily a food wholesaler
BSR | Analysis of U.S. Food Waste Among Food Manufacturers, Retailers, and Restaurants 26e) In addition to the primary business indicated in 1d), what other business
operations does your company own and operate (please check all that apply):
___ Food manufacturing
___ Food retailing
___ Food warehouse and/or distribution
f) How many food retail locations does your company operate?
g) How many food manufacturing locations does your company operate?
h) How many food warehouse/distribution locations does your company operate?
i) Point of contact information (name) __________________________________
Point of contact (phone number and email): _____________________________
2. Unsaleable Food Donations for Human Consumption:
Unsaleable food may be generated throughout the manufacturing and retail value
chain. For instance, mistakes during production may result in food that is perfectly
safe and delicious, but not saleable due to quality, overproduction, or labeling issues.
Product ingredients and semifinished products that are not suitable for retail but are
safe for human consumption may also be donated. The outer packaging of grocery
items may become damaged during distribution and retail operations, thus making
them unsuitable for sale but still perfectly safe to eat. Fresh food items such as day-
old bread, produce with blemishes and prepared foods and other perishable items that
are near sell-by dates, such as milk, juices, and fresh meats may also be unsuitable
for sale, but safe for consumption. Please only include unsaleable food in your
answer below. Do not include food that is produced expressly for donation,
purchased food provided by customers or employees expressly for donation, or any
food that is donated to organizations if it is still suitable for retail sale.
a) What is the total weight in pounds of unsaleable food donated for human
consumption by all of your company’s U.S. operations during calendar year
2013? If you do not know the exact amount, please provide as accurate an
estimate as possible.
Donations: _________________________ lbs
b) Please use the following scale to indicate the accuracy of your
answer to Question 2a. Number one on the scale indicates that your
answer is a best guess based on experience, not measured data.
Number five indicates that your answer is based on some measured
data used to extrapolate a somewhat accurate answer. Number ten
means that your answer is based on actual measures that are
believed to be very accurate.
Please circle one number: 1 – 2 – 3 – 4 – 5 – 6 – 7 – 8 – 9 – 10
c) Are there barriers, either internal or external, that prevent your
company from donating more unsaleable food? For example:
liability concerns, regulatory constraints, or food bank limitations
(i.e., insufficient refrigeration, transportation, etc.).
Yes____No____
If yes, please check all that apply, and explain in the space below
or by attaching a separate page.
Liability concerns Yes____No____
Regulatory constraints Yes____No____
Insufficient refrigeration and/or storage on site Yes____No____
Insufficient refrigeration and/or storage at
BSR | Analysis of U.S. Food Waste Among Food Manufacturers, Retailers, and Restaurants 27You can also read