Indicators for the Smart Development of Villages and Neighbourhoods in Baltic Sea Coastal Areas - MDPI
←
→
Page content transcription
If your browser does not render page correctly, please read the page content below
sustainability

Article
Indicators for the Smart Development of Villages and
Neighbourhoods in Baltic Sea Coastal Areas
Maris Kalinka , Sanda Geipele *, Edgars Pudzis , Andrejs Lazdins, Una Krutova and
Jurijs Holms
 Riga Technical University, Kal, k, u iela 1, Centra rajons, LV-1658 Rı̄ga, Letonia; maris.kalinka@rtu.lv (M.K.);
 edgars.pudzis@rtu.lv (E.P.); lazdins.andrejs@gmail.com (A.L.); una.krutova@rtu.lv (U.K.);
 jurijs.holms@rtu.lv (J.H.)
 * Correspondence: sanda.geipele@rtu.lv; Tel.: +372-29-449-881

 Received: 16 April 2020; Accepted: 23 June 2020; Published: 30 June 2020

 Abstract: A formal village/neighbourhood planning process is typically focused on three planning
 levels (national, regional and local) and is usually linked with administrative units of the territory
 (state, region or municipality). The local planning level (village or neighbourhood) “pocket plan” is a
 development challenge for spatial planners. The small coastal village Tuja in Latvia was taken as a pilot
 territory for “pocket planning” due to the unique location; biodiversity and ecosystems; significant
 natural, cultural, economic and social values; specific interests; and the needs of the involved local
 society. All these factors create a dynamic flow of data and information. Geographic information
 systems (GIS) are widely used as planning support systems. GISs for pocket plans must accommodate
 the special needs of communities in villages and neighbourhoods. Ensuring the availability of
 information in dynamic real time is an opportunity to build both community integration in specific
 environments and to understand the future plans of the territory. Access to a WEB-GIS (internet GIS)
 provides possibilities for every person with a mobile phone to use and update information. Static
 and statistical information is generally used for spatial planning. For pocket plans, the data and
 information flow has to be dynamic and has to interact with non-professional users. The special
 wishes and needs of every member of a community must be accommodated by a pocket plan for the
 well-being of the people and the sustainability of the surrounding territory. Small territory planning
 involves a very narrow circle of individuals or communities that identify spatial development needs
 for the future, which includes the socio-economic, cultural, historical, environmental and climate
 change scenarios. In order to assess the development opportunities and needs of such areas, the
 detection, accumulation and monitoring of reliable data is necessary. Methodically derived data
 (facts) provide objectivity and transparency. Currently, as information between the present and the
 past is able to circulate very fast, analysis of the current situation to forecast the future and show
 different constructed realities (scenarios) using a GIS is necessary. Therefore, to explore and determine
 a local needs-based and smart spatial planning approach, we must identify indicators that can be
 used for the short-term and long-term analysis of specific territories in coastal areas.

 Keywords: territory planning; village development; community development; coastal areas;
 indicators of village/neighbourhood planning; using GIS; GIS layers

1. Introduction

1.1. General Information about this Research
     The objective of the present research was to explore the local territory planning at the Baltic
Sea Region in the context of using a geographic information system (GIS) as well as to highlight the

Sustainability 2020, 12, 5293; doi:10.3390/su12135293                             www.mdpi.com/journal/sustainability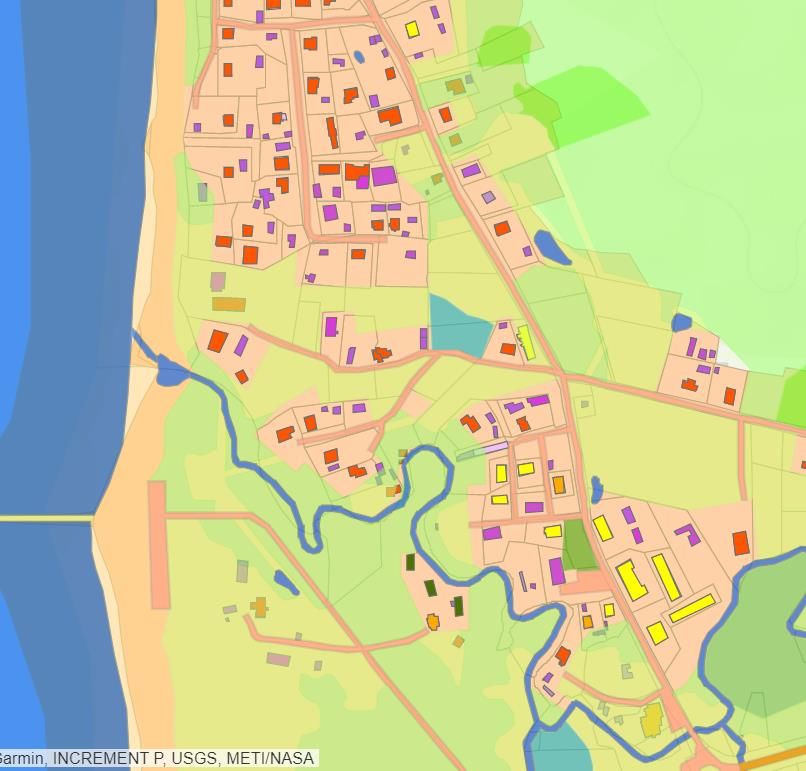
Sustainability 2020, 12, 5293                                                                       2 of 13

topicality for the smart and sustainable development of a local needs-based planning approach in
coastal areas. The authors emphasize that the local territory described in this research represents a
demarcated territory, such as a village or a neighbourhood of a coastal city or town, and includes the
community that lives in this territory. The object of the research are villages and neighbourhoods in
the Baltic Sea coastal areas, which are considered as territorial communities. MacQueen and other
scientists found five core elements of territorial community: (1) Locus, a sense of place, referred to
a geographic entity ranging from a neighbourhood to a city, or a particular milieu around which
people gather (such as a church or recreation centre). (2) Sharing, common interests and perspectives,
referring to common interests and values that can cross geographic boundaries. (3) Joint action, a sense
of coherence and identity, including informal common activities, such as sharing tasks and helping
neighbours, but these were not necessarily intentionally designed to create community cohesion. (4)
Social ties, which involved relationships that created an ongoing sense of cohesion. (5) Diversity,
referring not primarily to ethnic groupings, but to the social complexity within communities in which
a multiplicity of communities co-exist. [1] Community status derives from the ability to self-organize
for concrete purposes in coastal areas.
     The present research prioritizes the data that should be collected and monitored to ensure
trustworthy, long-term, and smart developments for specific coastal area territories. The in-depth
investigation of local needs-based planning approaches will be provided in further research of the
indicator analysis tool for new, informed, and objective decisions and vivid solutions in village and
neighbourhood territory planning.
     To approach the objective of the present research, we developed two indicator groups influencing
the smart development of coastal villages or neighbourhoods.

1.2. Village or Neighbourhood
      Village as a term is very widespread in the description of settlements. A small area may not always
be considered as a village but may also be considered as a suburban area or territorial community. As
cities and towns evolve, suburban areas are formed and the territories of cities/towns are increasingly
divided into informal neighbourhood areas; therefore, diverse types of spatial planning units are
created. Outside the urban and sub-urban areas, villages are dispersed—that is, at a great distance
from each other or linearly behind each other, for example, coastal villages. Villages as a populated
area are of a very dynamic size—they can be transformed into a city/town or may cease to exist as the
population increases or decreases [2].
      The status of village shall be granted and revoked by the municipality council, based on the local
government territorial planning, in which the village border is defined and the need for developing a
village is justified [2,3]. Communities and neighbourhoods are informal settlements and are based on
the feelings and links of the inhabitants and the physical borders. In the present research, only villages
and neighbourhoods with communities were studied.
      Community life in local territories depends on the communication and links between the local
inhabitants. Typically, a territorial community is a group of people who have similar interests and
goals that are territorially limited. Communities that are living in a defined territory must find smart
and sustainable ways to develop their neighbourhood. Social, cultural, and economic interest groups
are one of the intersections for an active, smart, and sustainable community in a territory.

1.3. Specific Features of Coastal Areas
     Coastal areas around the Baltic Sea have traditional fishing and cultural communities, such as
the Viking culture, and different small ethnographical groups, like the Suite, Kurland, and Gauja
cultures in the Baltic region. An integrated approach is needed to provide a strategic, integrated, and
forward-looking framework to help achieve both sustainable development and nature conservation [4].
Territories in the coastal areas that are rich with natural, cultural, economic, and social values usually
have a diverse range of stakeholders with specific interests and needs. These include local inhabitants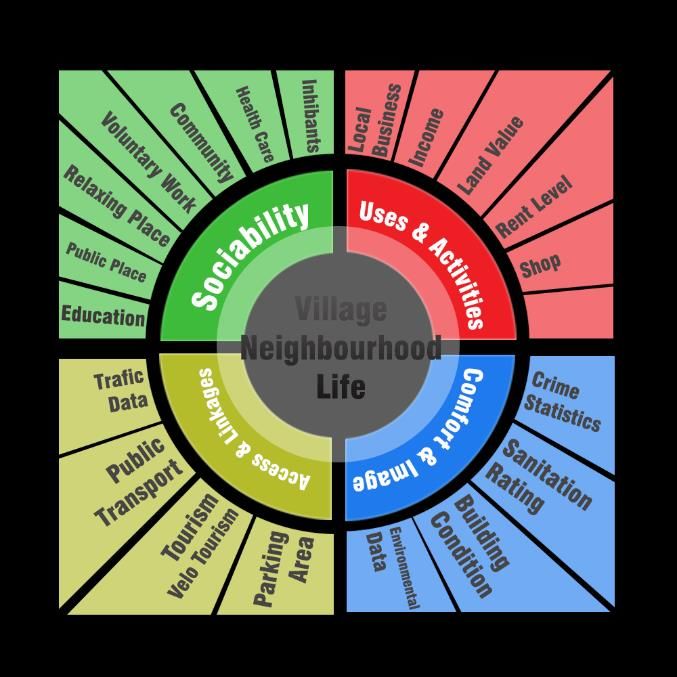
Sustainability 2020, 12, 5293                                                                       3 of 13

who live in the territory all year around, seasonal migrants, local municipalities, and representatives of
local businesses based on the available sea resources.
     Local community life in the coastal areas is strongly dependent on the seasonal migration of
the inhabitants, tourism, the existing biodiversity and ecosystem, climate changes, recreation, work
opportunities, and natural sea and water resources. The existing biodiversity, ecosystem and climate
changes are crucial factors that will affect the future. We highlight the importance and balance among
nature, humans and economic growth. Only such a balanced approach can provide a sustainable and
smart society in the coastal areas, and the support of technology, including GISs, can help achieve this.

1.4. Theoretical Aspects of Local Territories Planning
      When investigating coastal territories as rural territories, it is important to consider the rural
development policies in the European Union and Baltic Sea region countries. Rural development
policies have been based on different theoretical models. A neo-endogenous model is currently in
use. This model envisages a greater role and involvement of the local communities in the planning
and development processes, while respecting the regional needs and conditions [1–10]. The problems
of rural communities in the context of rural development have been directly or indirectly addressed
in many studies that characterized the general situation in rural areas of the Baltic Sea region and
analysed the public participation in decision-making [5–7]. Europe is experiencing a paradigm shift
from the countryside as a place solely linked to agricultural production to a space that offers other
services, experiences and goods not only for the rural population but also for citizens and tourists [8].
Increasingly, researchers are emphasizing the use of people-centred as well as area-based approaches
to rural and regional development, respecting the local specifics and conditions [9].
      Various indicators have long been used in planning, but this does not preclude the development
and diversification of the methodology for calculating indicators. An indicator should reflect the
phenomenon in the process by tracking its evolution over a sufficiently long period, which also allows
the trend to be assessed [10,11]. There are numerous definitions of indicators. Broadly speaking,
an indicator can be a sign, symptom, signal, tip, clue, grade, rank, object, organism, or warning
of some sort, including many things in everyday life. In other words, an indicator is simply “an
operational representation of an attribute (quality, characteristic or property) of a system” [12]. Often,
four basic dimensions are defined: social; environmental; economic; and institutional. It should be
considered that the indicator can carry a certain social burden, promoting public participation in the
decision-making process [13].
      To ensure sustainable development, a simplified Banfields’ [14] rational model can be used in
an infinite loop. The loop steps include: (1) data collection, (2) analysis, (3) forecasting the future
(planning), establishing goals (planning) and the design of alternatives (planning), (4) assessment,
indicator screening and comparing with goals and (5) reactions to the land development trends. If
necessary, alternative development plans may be used as the input for step (1) [15]. Reactions to the
land development trends can be implemented through ‘Stakeholder Dialog’ [16].
      To more precisely look at the European Union experience in coastal area planning, the authors
of this research analysed the Mediterranean Multidimensional Fuzzy Index, which was created by
scientists in other parts of the European Union. This index is the basis for methodological research on
multidimensional indices, particularly in the areas of sustainability, quality of life and poverty. Fuzzy
set theory was shown to be a powerful tool to describe the multidimensionality and complexity of
social phenomena, replacing the classical crisp approach, which generally tends to overestimate or
underestimate social dynamics. Indicators are used to assess the potential of a site.
      A research study by ESPON [17] found that the three key issues for territorial development were:
(1) the need to better understand patterns of differentiation between different kinds of rural areas,
(2) the nature of the different opportunities for development that each of them faces and (3) the way
in which such opportunities depend upon and may be strengthened by interactions between rural
and urban areas. For the comparison of experiences, the authors of this research studied experiences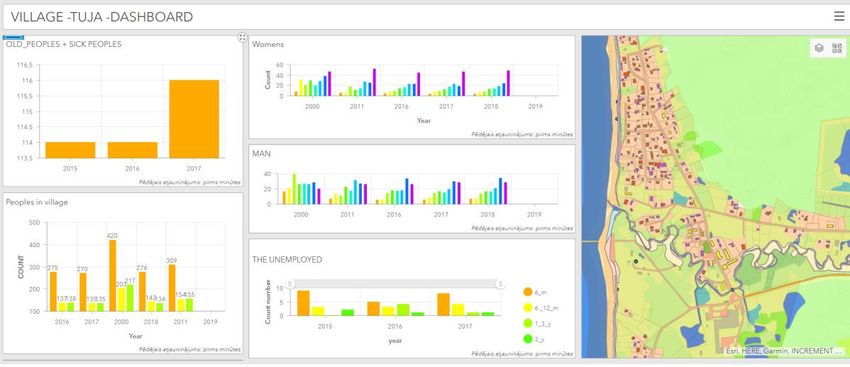
Sustainability 2020, 12, 5293 4 of 13
in local territories by the coast of the Baltic Sea, and indicator groups developed by University of
Latvia researchers were used. The sustainable coastal development governance indicator system was
developed for the Saulkrasti municipality and accepted by the Saulkrasti local authority as a part of
Sustainability 2020, 12, x FOR PEER REVIEW 4 of 14
supervision for their municipal long-term strategy and mid-term programs. The system contains 65
146 indicators,
indicators, including
divided in19 sixenvironmental
thematic groups; indicators,
15 socialdivided in seven
indicators, thematic
divided in five groups;
thematic 20 economic
groups; 8
147 indicators,
governancedivided in six
indicators, thematic
divided groups;
in three 15 social
thematic indicators,
groups; dividedindicators.
and 3 integral in five thematic groups; 8
148 governance indicators,
The majority of thedivided in three
indicators thematic groups;
are integrated andtwo
at least for 3 integral indicators.
dimensions of sustainability [10,18].
149 In order to understand the trends, continuous data collection and calculations of
The majority of the indicators are integrated at least for two dimensions of sustainability
the indicators [10,18].
should
150 In order to understand the trends, continuous data collection and
be conducted. A systemic monitoring must cover multiple scales of analysis, be ablecalculations of the indicators should
to link changes
151 be conducted.
in the economyAtosystemic
impactsmonitoring must cover
on the environment multiple
and providescales of analysis,
sufficient beanswer
detail to able to policy-relevant
link changes in
152 the economy
questions to impacts
regarding on the
specific environment
aspects and provideinsufficient
of the bioeconomy detail to
an overarching answer policy-relevant
framework. This has two
153 questions regarding specific aspects of the bioeconomy in
implications: (1) modelling is a key aspect of a systemic bioeconomy monitoringan overarching framework.framework,
This has
154 two implications: (1) modelling is a key aspect of a systemic bioeconomy
accompanied by further approaches, such as economy-wide resource accounting and life-cycle monitoring framework,
155 accompanied
analysis and (2) by sustainability
further approaches, suchand
indicators as economy-wide resource
targets are essential accounting
to evaluate and life-cycle
whether analysis
the bioeconomy
156 and (2) sustainability indicators and targets are essential to evaluate whether the bioeconomy
transition is contributing to sustainable development [19,20]. A literature review is not only an end transition
157 is
incontributing
itself but alsotorepresents
sustainable development
the need to create [19,20]. A literature
an analytical tool review is not
to achieve theonly
bestan end in itself but
results.
also represents the need to create an analytical tool to achieve the best results.
158 2. The case study, materials and methods
2. The case study, materials and methods
159 2.1. Case
2.1. Casestudy
study
160 The study
The study area area is Tuja,
is Tuja, which which is a coastal
is a coastal village
village in Latvia.
in Latvia. ThisThis village
village is located
is located on the
on the coastcoast of
of the
161 the
GulfGulf of Riga
of Riga (see(see Figure
Figure 1),km
1), 33 33 km
from from
the the government
government centre
centre Salacgriva
Salacgriva district
district andand 75 km
75 km fromfrom
the
162 the capital city of Latvia, Riga. On average, 276 people live in T ūja. In the summer, tourists
capital city of Latvia, Riga. On average, 276 people live in Tūja. In the summer, tourists visit and stay visit and
163 stay in camping
in camping sites.
sites. In the
In the territory
territory of Tuja,
of Tuja, thethe territoryofofdetached
territory detachedhouses
housesoccupies
occupies 44%,
44%, recreation
164 area occupies
occupies 11%,
11%, garden
garden plots
plots occupy
occupy 2%2% and
and mixed
mixed business
business area
area occupies
occupies 5% 5% (in
(in approximate
approximate
165 distribution). A library is available in Tuja village. In Tuja, there are partly centralized
distribution). A library is available in Tuja village. In Tuja, there are partly centralized sewer sewer and water
and
166 supply networks.
water supply Tuja is Tuja
networks. the most
is thepopular seasideseaside
most popular resort inresort
Vidzeme (the northwest
in Vidzeme region ofregion
(the northwest Latvia).
of
167 There areThere
Latvia). also old
are fishing
also oldtraditions. Public services
fishing traditions. are available
Public services to the public.
are available to theTherefore, the experts
public. Therefore, the
168 chose
expertsthe Tuja the
chose local community
Tuja as the pilot
local community area.
as the pilot area.
169
170 Figure 1. Tuja village location (map
(map developed
developed by
by the
the authors).
authors).
171 2.2.
2.2. Tool
Tool for
for Data
Data Acquisition
Acquisition and
and Analysis
Analysis
172 In
In this
this research,
research, the
the systematization
systematization of of information
information is is one
one ofof the
the prerequisites,
prerequisites, as
as the
the choice
choice of
of
173 the
the key performance indicators depends, to a large extent, on the ability to identify specific sources
key performance indicators depends, to a large extent, on the ability to identify specific sources
174 and
and process
process thethe information
information flow.
flow. This
This ensures
ensures that
that the
the information
information can can be
be used
used to
to draw
draw conclusions
conclusions
175 and decisions. We identify critical elements in the process of selecting key
and decisions. We identify critical elements in the process of selecting key performance performance indicators: (1)
indicators:
176 the choice of indicators, (2) the intelligibility and compliance of indicators and (3) the
(1) the choice of indicators, (2) the intelligibility and compliance of indicators and (3) the feasibility feasibility and
177 credibility of theofindicator
and credibility checkcheck
the indicator process [12]. [12].
process
178 The GIS plays an important role
The GIS plays an important role in the in the planning
planning process.
process.A customized
A customized GIS GIS
can becanused as a local
be used as a
179 needs-based planning tool with positive impacts on the economic development,
local needs-based planning tool with positive impacts on the economic development, smart growth, smart growth, quality
180 of life, biodiversity,
quality and ecosystems.
of life, biodiversity, and ecosystems.
181 Powerful indicator assessment tools for sustainable land planning and online decision making
182 built using GIS technologies and new complex approaches based on spatial data infrastructure (SDI)
183 should become available soon [15].
184 This research highlights how to collect and analyse data for demarked territories and their
185 communities. This is performed in line with the territory development from the perspectives of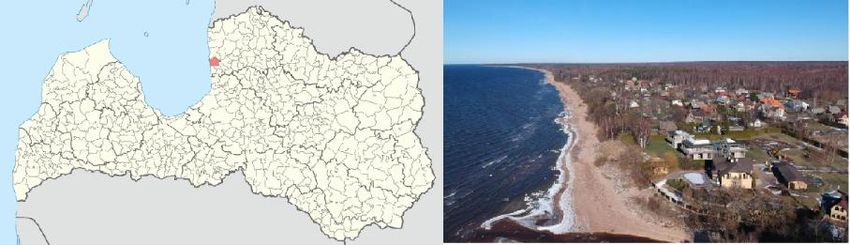
Sustainability 2020, 12, 5293 5 of 13
Powerful indicator assessment tools for sustainable land planning and online decision making
built using GIS technologies and new complex approaches based on spatial data infrastructure (SDI)
should become available soon [15].
This research highlights how to collect and analyse data for demarked territories and their
communities.
Sustainability 2020, This is performed
12, x FOR PEER REVIEW in line with the territory development from the perspectives 5 of of
14
social–economical relationships and the use of local resources, and demonstrates the use of a GIS.
AGIS cancan
GIS be used
be usedas aastool to collect,
a tool analyse
to collect, and visualize
analyse the geospatial
and visualize and analytical
the geospatial data to support
and analytical data to
a transparent
support and inclusive
a transparent planning
and inclusive processprocess
planning in a local
in territory. The main
a local territory. Thepossibilities to use to
main possibilities a GIS
use
aforGIS
planning supportsupport
for planning includeinclude
data visualization without without
data visualization geographic coordinates,
geographic traditionaltraditional
coordinates, 2D maps,
3D maps,
2D maps, alternative scenarios and
3D maps, alternative the analysis
scenarios and ofthemulti-attribute tables. The results
analysis of multi-attribute of this
tables. Thecomputing
results of
can be
this shown ascan
computing WEB-GIS
be shownlayers, thematical
as WEB-GIS maps,thematical
layers, dashboards and dashboards
maps, cartographicalandmaps. WEB-GIS
cartographical
layers are
maps. commonly
WEB-GIS layersknown and users
are commonly without
known andspecific knowledge
users without canknowledge
specific combine and cananalyse
combine layers
and
and obtain
analyse layersuseful
and information
obtain usefulfor decision making.
information Dashboards
for decision making. provide
Dashboardsthe possibility
provide thetopossibility
combine
analytical
to combinedata from analytical
analytical data fromdatabases
analyticaland display and
databases this information on the web, linked
display this information on the with
web,feature
linked
layers.
with Figure
feature 2 shows
layers. Figurea 2dashboard example example
shows a dashboard for the collection of analytical
for the collection information
of analytical from
information
government
from government databases and and
databases statistical databases
statistical databasesregarding
regarding thethe
age
ageofofvillage
village inhabitants. This
principle can also be used for for dynamical
dynamical datadata collection
collection and
and analysis.
analysis.
Figure 2.
Figure Tuja village
2. Tuja village dashboard
dashboard (developed
(developed by
by the
the authors).
authors).
Thematical maps show spatial information created from analytical data and geospatial data. The
Thematical maps show spatial information created from analytical data and geospatial data. The
GIS analysis function allows the combination of feature layers with analytical data. The results of this
GIS analysis function allows the combination of feature layers with analytical data. The results of this
data combination are new feature layers with new attribute information. Figure 3 shows the building
data combination are new feature layers with new attribute information. Figure 3 shows the building
of a thematical map in the WEB-GIS combining the analytical and geospatial information from state
of a thematical map in the WEB-GIS combining the analytical and geospatial information from state
and local governments and showing the heights of the houses.
and local governments and showing the heights of the houses.
Cartographical maps (base maps) collect different feature layers and can be shown as separate
maps with combinations of feature layers by type and visualized using colours and symbology. The
base map can be published on a website or printed out and used as a “normal” map. Figure 4 shows a
village base map.
Figure 3. Village thematical map (developed by the authors).
Cartographical maps (base maps) collect different feature layers and can be shown as separate
Thematical maps show spatial information created from analytical data and geospatial data. The
GIS analysis function allows the combination of feature layers with analytical data. The results of this
data combination are new feature layers with new attribute information. Figure 3 shows the building
of a thematical map in the WEB-GIS combining the analytical and geospatial information from state
Sustainability 2020, 12, 5293 6 of 13
and local governments and showing the heights of the houses.
Sustainability 2020, 12, x FOR PEER REVIEW 6 of 14
base map can be published on a website or printed out and used as a “normal” map. Figure 4 shows
a village base map. Figure 3. Village thematical map (developed by the authors).
Figure 3. Village thematical map (developed by the authors).
Cartographical maps (base maps) collect different feature layers and can be shown as separate
maps with combinations of feature layers by type and visualized using colours and symbology. The
Figure 4. Village base map (developed by the authors).
A
A literature
literature review,
review, observational
observational data
data collection,
collection, discourse
discourse analysis,
analysis, induction, deduction,
induction, deduction,
synthesis
synthesis andand logical
logical access
access methods
methods were
were used
used inin this
this study.
study. For
For the
the identification
identification ofof the
the indicators
indicators
influencing the village and neighbourhood planning in the coastal
influencing the village and neighbourhood planning in the coastal areas, we used theareas, we used the expert interview
expert
method. The selection
interview method. of experts
The selection was based
of experts was basedon groups
on groupswith a direct
with a directimpact
impacton on community
community
life: municipality planning
life: municipality planning specialists,
specialists, representatives
representatives of of the
the village
village community,
community, scientists
scientists and
and
representatives of the ministry responsible for regional
representatives of the ministry responsible for regional policy. policy.
Social
Social communication
communication methods methods were
were used
used to to identify
identify the
the findings
findings and
and the
the need
need toto use
use them,
them,
including seminars, individual discussions and discussions on the meaning
including seminars, individual discussions and discussions on the meaning and necessity of special and necessity of
special
tools. tools.
We
We identified
identified the
the factors
factors of
of the
the systematic
systematic strategic
strategic process
process diagram
diagram using
using the
the mind
mind mapping
mapping
technique,
technique, to help in organizing categories and ideas. Mind maps are used around a central problem
to help in organizing categories and ideas. Mind maps are used around a central problem
to
to express
express ideas,
ideas, created
created through
through content
content analysis,
analysis, into
into aa visual
visual diagram
diagram [21]. They provide
[21]. They provide imagery
imagery
and
and insights
insights by capturing all
by capturing concepts related
all concepts related to
to aa concern
concern and
and focusing
focusing onon the
the relationships
relationships between
between
concepts
concepts [22,23]. Conceptual maps
[22,23]. Conceptual maps stimulate
stimulate thethe creation
creation ofof ideas,
ideas, rapid
rapid results,
results, visual
visual graphical
graphical
representations
representations and and thethe relationships
relationships ofof the
the generated
generated ideas
ideas [21].
[21].
Computer
Computer assisted
assisted overlay
overlay techniques,
techniques, especially
especially thethe spatial
spatial overlay
overlay techniques
techniques of of geographic
geographic
information
information systems (GISs) [24], are very effective for processes involving vector overlap due
systems (GISs) [24], are very effective for processes involving vector overlap due to their
to their
advantages in terms of time, cost and labour consumption. A GIS was used in this study to overlap
various factor maps and to obtain suitable final maps faster and more efficiently.
3. Results and Discussion
3.1. Discussion: Determining Local Territory Indicators and Using a GIS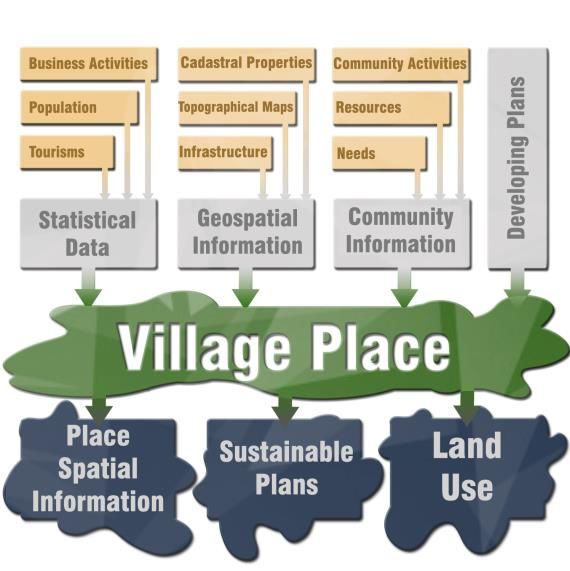
Sustainability 2020, 12, 5293                                                                                       7 of 13

advantages in terms of time, cost and labour consumption. A GIS was used in this study to overlap
various factor maps and to obtain suitable final maps faster and more efficiently.

3. Results and Discussion

3.1. Discussion: Determining Local Territory Indicators and Using a GIS
      One of the biggest challenges for data model creation is in choosing the appropriate indicators for
analysing local territories. There are two principle ways to solve this “indicators” issue. One method
to analyse an area is to use different types of indicators that describe the area in terms of the function,
structure and location [25]. Using these three large groups would require extensive analysis, including
historical, financial, social, ecological and climate data [26]. By covering the indicators of the territory,
Sustainability 2020, 12, x FOR PEER REVIEW                                                                          7 of 14
it is possible for the local community, in cooperation with the municipality, to develop a long-term
strategy
important  forindicators
                the development      of the village
                             is sociability.         or neighbourhood
                                             The World                     territory.along
                                                           Health Organization,       One of  the the
                                                                                            with  important
                                                                                                      Office ofindicators
                                                                                                                  Disease
is sociability.   The   World    Health  Organization,    along  with  the  Office of Disease
Prevention and Health Promotion’s Healthy People 2020 initiative, identified social support andPrevention    and   Health
                                                                                                                     good
Promotion’s       Healthy     People  2020   initiative, identified   social  support   and  good
social relations as key determinants of health and well-being. The Project for Public spaces showed social  relations   as
key   determinants       of health  and  well-being.    The  Project for Public   spaces   showed   how
how to work with different places [27,28]. To deal with this challenge, the most important indicators     to work    with
different
group forplaces      [27,28].
              the local         To deal are
                          community     with   this challenge,
                                             sociability;       the most
                                                          uses and          important
                                                                     activities; comfortindicators  group
                                                                                           and image;   andfor   the local
                                                                                                              access  and
community        are  sociability;  uses  and   activities; comfort   and
linkages, which form the subgroups developed by the authors (see Figure 5). image;   and  access  and linkages,    which
form the subgroups developed by the authors (see Figure 5).

      Figure 5. Indicator groups that influence village or neighbourhood planning (developed by the authors).

      Another
       Figure 5. method
                  Indicatortogroups
                               analyse  local
                                      that     territories
                                            influence       is toorpay
                                                       village         special attention
                                                                    neighbourhood         to analysing
                                                                                     planning   (developed thebyhistorical
                                                                                                                  the
       authors). of the local territory, to collect its traditions and find a sustainable way for the future to
development
integrate the traditions and culture with developing the territory. This characteristic of local territory
may Another
       require amethod      to analyseand
                  unique approach       locala territories  is to payindicators
                                                focus on different      special attention  to roles
                                                                                   that play  analysing
                                                                                                    for thetheimage
                                                                                                                historical
                                                                                                                      and
 development of
attractiveness   of the
                     the local
                         local territory,  to collect
                                territory [29].       its traditions
                                                 Regarding             and findexpert
                                                              the conducted      a sustainable
                                                                                       interviews,waywefordeveloped
                                                                                                            the futuresix
                                                                                                                        to
 integrate  the traditions
indicator groups (Table 1):  and   culture  with  developing      the territory. This characteristic  of  local  territory
 may require a unique approach and a focus on different indicators that play roles for the image and
•attractiveness
      economic of  factors;
                      the local territory [29]. Regarding the conducted expert interviews, we developed
•six indicator
      social factors;
                groups (Table 1):
•     environmental;
       • economic factors;
•      • social factors;
      cultural-historical;
•      • environmental;
      government      basket service;
•      • cultural-historical;
      specific sea resources (in the water and inland).
       • government basket service;
       • specific sea resources (in the water and inland).
       One of groups “specific sea resources (in the water and inland)” is defined as a horizontal factor
 group that is part of the sub-factors and shown in Table 1 marked with SA.
       Economic factors impact the design of the economic development of the village or
 neighbourhood, and this requires information about the employment, wages, salaries, real estate in
 the local territory, migration, and entrepreneurship in the local territory (village or neighbourhood)
Sustainability 2020, 12, 5293 8 of 13
Table 1. Indicators influencing village or neighbourhood planning (developed by the authors).
Indicators of the Local Territory
I. Economic factors in the local territory
- employment
- wages and salaries
- real estate in village/neighbourhood (SA—particularly the seasonality of real estate usage)
- migration (SA—particularly seasonal migration)
- entrepreneurship in local territory and in municipality (region) (SE—in the fields that are directly
connected with sea resources)
- spending of municipalities on social and other support or discounts for taxes in the
village/neighbourhood (if applicable; for land or real estate)
II. Social factors in local territory
- structure of inhabitants
- nationality
- size of the household
- level of education
- treatment of foreigners in the local territories
III. Environmental
- housing information
- quality and volume of resources delivered and produced in the local territory
- environmental information (SE—protected areas, protection and sustainable usage of sea resources)
- property structure
- ecological structure (SE—sea resources and the influence of climate changes on these resources)
IV. Cultural
- cultural activities.
- free time for local inhabitants (cafes, walks, forest, shops, short migration, homes, and sport)
- number of tourists per year, spent financial resources
- historical links with the territory, traditions in the local community (coffee, sauna, fish smoking, berry
picking, etc.) (SE—fishing traditions, recreation traditions)
- population activity and level of cooperation with the municipality (in the village, village elder, Facebook
group, WhatsApp group, etc.)
V. Service basket
- taxi
- public transport
- regional and government centres
- regulations in place
- health services
- shop services
One of groups “specific sea resources (in the water and inland)” is defined as a horizontal factor
group that is part of the sub-factors and shown in Table 1 marked with SA.
Economic factors impact the design of the economic development of the village or neighbourhood,
and this requires information about the employment, wages, salaries, real estate in the local territory,
migration, and entrepreneurship in the local territory (village or neighbourhood) and in the municipality
(region). These economic factors will provide the main information regarding the planning of the
territory development and analysis of the economic health in the local territory and community. By
using this information, the community and local government can analyse the economic activities insideSustainability 2020, 12, 5293 9 of 13
the local territory and the economical manner of the local inhabitants. Economic factors are known to
be in synergy with social factors, including life quality and satisfaction in the family and in the society
(community), and they reflect the environment of the local territory as well.
Social factors present the interrelatedness of the social roles, behaviours and actions of the local
community, providing detailed information regarding the social structures in the local territory to
analyse the age, nationality and education. This information identifies the analytical categories and
relationships between them, i.e., the needs of the local community from the age and ethnographical view.
Environmental factors play important roles in the local territory through infrastructure
development (public, municipal and private) by indicating the structure and housing information.
The environmental factors are closely linked to the social factors. The factors of the environmental
give important information regarding the minimum needs for stays in a village or neighbourhood
including:
• the drinking water and sewers;
• the roads and their quality;
• the energy saving possibilities; and
• the ecological situation.
Cultural factors include the traditions, attitudes, beliefs, values and self-definitions of the local
community, which are important in territory planning and can show information regarding the free
time and leisure activities in the territory and nearby territories. To collect this information, there are
no optimal parameters regarding how far from the village or neighbourhood the free time activities
should be located, but this parameter must be an attribute.
Government service basket factors include information on what services can be obtained directly
from the government in the developing territory and how far it is to obtain services for health, shopping
and local and regional centres. These factors also include restrictions on territory development and
protection zones.
Specific sea resources (in the water and inland) must be analysed to collect and monitor information
that is based on the smart specialization of coastal areas. It is important to analyse the resources that
are directly connected to the sea in the water and those inland. This will not be a separate indicator
(not included in the Table 1); however, certain indicators must be specifically analysed regarding the
differences of coastal local territories (marked with SA in the lower table).
There is an issue regarding the interdisciplinary harmonized indicator classifications [30]. Every
stakeholder attempts to use their own indicators, although there are many developed Ecosystem
Services (ES) indicator models. In future research, we will attempt to harmonize the local level
indicators with ES indicators.
3.2. Methods for Collecting the Values for Indicators and Its Data Sources
For analysing local territories, methods that produce accurate and precise data should be chosen.
These data must cover the largest part of the territory and most of the inhabitants. Triangulation
involves the use of different methods and sources to check the integrity of, or extend, the inferences
drawn from the data. Triangulation has been widely adopted and developed as a concept by qualitative
researchers as a means of investigating the ‘convergence’ of both data and the conclusions derived
from them [31]. This technique is often cited as one of the central methods of ‘validating’ qualitative
research evidence.
The methods for collecting of the data:
• mapping of the geospatial data—geodetical surveying on the field, use the geospatial databases to
collect the environmental data;
• survey—use mutual and written methods, use social forms, also possibly use the GIS platform;
• interview—collect the cultural information and needs for inhibitors;Sustainability 2020, 12, 5293 10 of 13
• observations—collect information on the habits and behaviours; and
• analyse documents—collect information on the services and regulations of the government, the
decisions of the government and submissions.
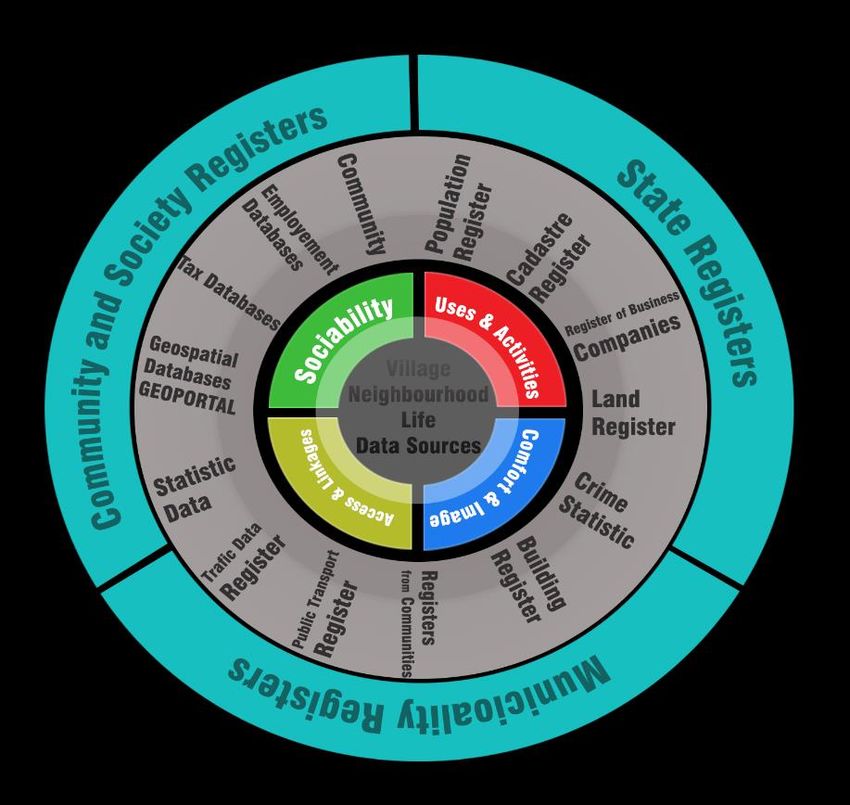
Data sources for the information vary from maps to databases (see Figure 6):
• geospatial databases (textual and graphical);
• statistical databases;
•Sustainability
archives; and
2020, 12, x FOR PEER REVIEW 10 of 14
• on the field collection.
Figure 6. Data sources for indicators (developed by the authors).
In this respect, inFigure 6. Data sources for indicators (developed by the authors).
the village or neighbourhood planning, the indicators mainly focus on the local
needs and people’s lives by using the hard data and integrating it in the GIS tools. In village planning,
In this respect, in the village or neighbourhood planning, the indicators mainly focus on the local
a GIS is the tool to collect, analyse and visualize the results. Spatial analysis results from the GIS
needs and people’s lives by using the hard data and integrating it in the GIS tools. In village planning,
give the tasks for the future to show what the village needs and what is possible to do. Combining
a GIS is the tool to collect, analyse and visualize the results. Spatial analysis results from the GIS give
the different geospatial and analytical layers is possible (see Figure 6). For example, for analysis of
the tasks for the future to show what the village needs and what is possible to do. Combining the
the population, to show the needs and analyse the possibilities in the village or surrounding area is
different geospatial and analytical layers is possible (see Figure 6). For example, for analysis of the
possible. The GIS tool can help organize the life in villages.
population, to show the needs and analyse the possibilities in the village or surrounding area is
possible.
3.3. MethodsTheforGIS tool canand
Analyzing help organize Indicators
Visualizing the life in villages.
There is for
3.3. Methods a possibility
Analyzing andto use many ofIndicators
Visualizing the methods to analyse the village or neighbourhood life
indicators. There are two primary important categories: statistical and/or logical methods. For
There is
visualizing, a possibility
it is possible to touseuse many of the
combinations ofmethods to analyse
the analytical data andthecartographical
village or neighbourhood
maps, or to uselife
indicators. There are two primary important categories: statistical and/or logical
the GIS and statistical and/or logical methods for describing, illustrating, reducing, summarizing and methods. For
visualizing,
evaluating theit data
is possible
[32,33].toBased
use combinations of the
on the data, these analytical
methods data
allow usand cartographical
to draw maps, or to
inductive conclusions
use the GIS and statistical and/or logical methods for describing, illustrating, reducing, summarizing
and separate the signal (the phenomenon of interest) from the noise (statistical fluctuations or subjective
and in
bias) evaluating
the data. A theGIS
data
gives[32,33]. Based on
a connection withthe
thedata,
placethese methods allow
and possibilities us to draw
to visualize inductive
the results with
conclusions and separate the signal (the phenomenon of
the geographical features to provide interactions with different data layers.interest) from the noise (statistical
fluctuations
Consideringor subjective bias) inpart
the discussion the of
data.
thisApresent
GIS gives a connection
research, with the
we designed theplace and possibilities
information system
to visualize the results with the geographical
architecture of the indicator analysing tool (Figure 7). features to provide interactions with different data
layers.
Considering the discussion part of this present research, we designed the information system
architecture of the indicator analysing tool (Figure. 7).Sustainability 2020, 12, x FOR PEER REVIEW 11 of 14
Sustainability 2020, 12, 5293 11 of 13
Figure 7.
Figure The information
7. The information system
system architecture
architecture of
of the
the indicator
indicator analysing
analysing tool
tool (developed
(developed by
by the
the
authors).
authors).
According to Figure 7, the results of the indicator analysis tool must show the main possibilities
According to Figure 7, the results of the indicator analysis tool must show the main possibilities
for communications, needs and possibilities to develop the village or neighbourhood territory. The
for communications, needs and possibilities to develop the village or neighbourhood territory. The
tool will allow for understanding and analysis of the economic, environmental, social, service and
tool will allow for understanding and analysis of the economic, environmental, social, service and
cultural factors, as well as specific sea resources (in the water and inland), including the scenarios and
cultural factors, as well as specific sea resources (in the water and inland), including the scenarios
forecast approach. The results can also indicate threats to sociality and economical possibilities, as well
and forecast approach. The results can also indicate threats to sociality and economical possibilities,
as possibilities for using the strengths of the local community. In future research regarding the village
as well as possibilities for using the strengths of the local community. In future research regarding
or neighbourhood indicator analysis tool, more detailed characteristics of indicators and GIS layers
the village or neighbourhood indicator analysis tool, more detailed characteristics of indicators and
will be developed. The results must be dynamical and open to changes in adapting to circumstances.
GIS layers will be developed. The results must be dynamical and open to changes in adapting to
circumstances.
4. Conclusions
The territory-developed methods for the evaluation of economic and social processes, as well
4. Conclusions
as the methods of analysis for territory development data are widely studied in the scientific
The territory-developed methods for the evaluation of economic and social processes, as well as
literature. The obtained results (indicators) are used in forecasting, planning and in defining strategic
the methods of analysis for territory development data are widely studied in the scientific literature.
directions of development at various territorial levels. Territory planning is usually used in larger
The obtained results (indicators) are used in forecasting, planning and in defining strategic directions
planning units—municipalities, regions or states. The planning of smart and sustainable villages and
of development at various territorial levels. Territory planning is usually used in larger planning
neighbourhoods in Baltic Sea coastal areas can be considered a sufficiently new concept, which needs
units—municipalities, regions or states. The planning of smart and sustainable villages and
to be further detailed with new approaches and examples.
neighbourhoods in Baltic Sea coastal areas can be considered a sufficiently new concept, which needs
We explored local territory planning for the villages and neighbourhoods in Baltic Sea coastal areas
to be further detailed with new approaches and examples.
in the context of using a GIS, and we highlighted its topicality for the development of local needs-based
We explored local territory planning for the villages and neighbourhoods in Baltic Sea coastal
planning approaches. To approach the objective, we developed three indicator groups (statistical data,
areas in the context of using a GIS, and we highlighted its topicality for the development of local
geospatial information and dynamic information) that influence village or neighbourhood planning.
needs-based planning approaches. To approach the objective, we developed three indicator groups
We demonstrated the primary idea of using the hard data and a GIS by designing the information
(statistical data, geospatial information and dynamic information) that influence village or
system architecture of the indicator analysis tool.
neighbourhood planning. We demonstrated the primary idea of using the hard data and a GIS by
Indicators are a tool used to help to analyse the present and predict the future development of
designing the information system architecture of the indicator analysis tool.
villages and neighbourhoods in Baltic Sea coastal areas based on credible evidence. A GIS is one of the
Indicators are a tool used to help to analyse the present and predict the future development of
best ways to present and process statistical and geospatial information using spatial analysis methods,
villages and neighbourhoods in Baltic Sea coastal areas based on credible evidence. A GIS is one of
e.g., geoprocessing. The indicators provide a potential contribution to the social, economic and
the best ways to present and process statistical and geospatial information using spatial analysis
sustainable development of a local territory and the growth in quality improvement (potential future
methods, e.g., geoprocessing. The indicators provide a potential contribution to the social, economic
layers). This creates better communities for future generations and establishes viable communities,
and sustainable development of a local territory and the growth in quality improvement (potential
local planning services and urban and regional planning. In the development of brownfields and the
future layers). This creates better communities for future generations and establishes viable
land development plans can be adjusted to reach most of the expected results from inhabitants through
communities, local planning services and urban and regional planning. In the development of
stakeholder dialog and cooperation (to develop a cohesive community).
brownfields and the land development plans can be adjusted to reach most of the expected results
from inhabitants through stakeholder dialog and cooperation (to develop a cohesive community).Sustainability 2020, 12, 5293 12 of 13
The effective application of indicators is possible in cooperation with village representatives and
municipal specialists, ensuring the flow of information to the GIS database. A GIS can function fully
when ensuring a regular flow of information. Regular discussion between the community and the
municipality is a method to identify new indicators. The existing biodiversity, ecosystem, climate
changes and specific sea resources (in the water and inland) are crucial factors that will affect the
future local community life of the coastal areas. It is important to highlight these and the balance
among nature, humans and economic growth. The local needs-based planning approach for smart and
sustainable development in the villages and neighbourhoods can provide a more inclusive society in
the coastal areas supported using a GIS.
Author Contributions: Conceptualization, M.K., S.G. and E.P.; methodology, M.K.; software, M.K.; validation,
A.L., E.P. and S.G.; formal analysis, J.H. and U.K.; investigation, M.K.; resources, M.K.; data curation, M.K.;
writing—original draft preparation, M.K.; writing—review and editing, S.G. and E.P.; visualization, M.K. and
A.L.; supervision, S.G. and E.P.; project administration, S.G. All authors have read and agreed to the published
version of the manuscript.
Funding: This research was funded by the INTERREG Central Baltic program project “Coast4us” within the P2
project priority—Sustainable use of the common resources, project number 627.
Conflicts of Interest: The authors declare no conflicts of interest.
References
1. Holms, J.; Arhipova, I.; Vitols, G. Linking environmental data models to ecosystem services’ indicators for
strategic decision making. In Proceedings of the ICEIS 2018—20th International Conference on Enterprise
Information Systems, Funchal, Portugal, 21–24 March 2018; Volume 1.
2. Project for Public Spaces (2016). Available online: https://www.pps.org/ (accessed on 20 November 2019).
3. Gollana, N.; Voyer, M.; Jordan, A.; Barclay, K. Maximising Community Wellbeing: Assessing the Threats to
the Benefits Communities Derive from the Marine Estate. Ocean. Coast. Manag. 2019, 168, 12–21. [CrossRef]
4. Reveiu, A.; Dârdală, M. Techniques for Statistical Data Visualization in GIS. Inform. Econ. 2011, 15, 72.
‘
5. Cimdin, a, A.; Raubiško, I. Cilvēks un Darbs Latvijas Laukos. Sociālantropologisks Skatı̄jums; Zinātne: Rı̄ga, Latvia,
2012.
6. Kalibatas, D. The Multi-Attribute Assessment of Environmental Factors Influencing on Dwelling-houses. In
Summary of Doctoral Dissertation; Vilnius Gediminas Technical University: Vilnius, Lithuania, 2009; 22p.
7. Kārklin, a, R. Lauku Kopienu, Pašvaldı̄bu un Valsts Iestāžu Sadarbı̄ba Attı̄stı̄bas Plānošanā. No, A. Cimdin, a,
& I. Raubiško (Sast.). In Dzı̄ve, Attı̄stı̄ba, Labbūtı̄ba Latvijas Laukos; Zinātne: Rı̄ga, Latvia, 2012; pp. 67–87.
8. Clout, D.H. The Countryside: Towards a Theme Park. In the Oxford Handbook of Postwar European History;
Stone, D., Ed.; Oxford University Press: Oxford, UK, 2012. [CrossRef]
9. Bently, G.; Pugalis, L. Shifting Paradigms: People-centred Models, Active Regional Development, Space-blind
Policies and Place-based Approaches. Local Econ. 2014, 29, 283–294. [CrossRef]
10. Ernsteins, R.; Kaulins, J.; Zilniece, I.; Lontone, A. Coastal Governance Solutions Development in Latvia:
Collaboration Communication and Indicator Systems. Coastal Zones; Elsevier: Amsterdam, The Netherlands, 2015.
11. Franceschini, F.; Galetto, M.; Maisano, D. Management by Measurement: Designing Key Indicators and Performance
Measurement Systems; Springer Berlin Heidelberg: Torino, Italy, 2007; 242p. [CrossRef]
12. Gallopin, G.C. Indicators and their use: Information for decision-making. In Sustainability Indicators;
Moldan, B., Billharz, S., Eds.; Wiley: New York, NY, USA, 1997; pp. 13–28.
13. Bossel, H. Assessing viability and sustainability: A systems-based approach for deriving comprehensive
indicator sets. Conserv. Ecol. 2001, 5, 12. [CrossRef]
14. Future Trends in the Baltic Sea. 2010. Available online: http://assets.wwflv.panda.org/downloads/wwf_
future_trends_in_the_baltic_sea_2010_1.pdf (accessed on 23 October 2019).
15. Meyerson, M.; Banfield, E.C. Politics, Planning, and the Public Interest; Free Press: New York, NY, USA, 1955.
16. Holms, J.; Arhipova, I.; Tulbure, I.; Vitols, G. Ecosystem Provisioning Services Automated Valuation Process
Model for Sustainable Land Management. Procedia Comput. Sci. 2017, 104, 65–72. [CrossRef]
17. ESPON. EDORA European Development Opportunities for Rural Areas; ESPON: Luxembourg, Germany,
2013; 81p.Sustainability 2020, 12, 5293 13 of 13
18. Casini, M.; Bastianoni, S.; Gagliardi, F.; Gigliotti, M.; Riccaboni, A.; Betti, G. A Methodological Proposal for a
Multidimensional Fuzzy Index in the Mediterranean Area Sustainable Development Goals Indicators. 2008.
Sustainability 2019, 11, 1198. [CrossRef]
19. Momtaz, S.; Zobaidul Kabir, S.M. Evaluating Community Participation in Environmental Impact Assessment.
In Evaluating Environmental and Social Impact Assessment in Developing Countries, 2nd ed.; Elsevier: Amsterdam,
The Netherlands, 2018; Chapter 6; pp. 123–140. [CrossRef]
20. O’Brien, M.; Tsiropoulos, Y.; Smets, E.; Forsell, N.; Valin, H.; Lindner, M.; Moiseyev, A.; Verburg, P.;
Verhagen, W.; Bringezu, S. Tools for Evaluating and Monitoring the EU Bioeconomy: Indicators. Deliverable 2.2 of
the SAT-BBE Project; European Commission: Brussels, Belgium, 2014.
21. MacQueen, K.M.; McLellan, E.; Metzger, D.S.; Kegeles, S.; Strauss, R.P.; Scotti, R.; Blanchard, L.; Trotter, R.T.
What is Community? An Evidence-based Definition for Participatory Public Health. Am. J. Public Health
2001, 91, 1929–1938. [CrossRef] [PubMed]
22. Ju, C.Y.; Jia, Y.G.; Shan, H.X.; Tang, C.W.; Ma, W.J. GIS-Based Coastal Area Suitability
Assessment of Geo-Environmental Factors in Laoshan District, Qingdao. 2012. Available
online: https://www.researchgate.net/publication/258685714_GISbased_coastal_area_suitability_assessment_
of_geo-environmental_factors_in_Laoshan_district_Qingdao (accessed on 20 October 2019).
23. Malczewski, J. GIS-Based Land-Use Suitability Analysis: A Critical Overview. Available online: http:
//staff.unila.ac.id/ekoefendi/files/2011/10/Malczewski_2004.pdf (accessed on 20 October 2019).
24. Tomlin, C.D. Geographical Information Systems and Cartographic Modeling; Prentice-Hall: Englewood Cliffs, NJ,
USA, 1990.
25. Hopkins, T.S.; Bailly, D.; Stottrup, J.G. A Systems Approach Framework for Coastal Zones. Ecol. Soc. 2011,
16, 25. [CrossRef]
26. Denzin, K.N.; Lincoln, S.Y. Handbook of Qualitative Research; Sage Publications, Inc.: Thousand Oaks, CA,
USA, 1994; 643p.
27. Parker, D.C.; Manson, S.M.; Janssen, M.A.; Hoffmann, M.J.; Deadman, P. Multiagent systems for the
simulation of land-use and land-cover change: A review. Ann. Assoc. Am. Geogr. 2003, 93, 314–337.
[CrossRef]
28. Project for Public Spaces. 2016. Available online: https://uploadsssl.webflow.com/5810e16fbe876cec6bcbd86e/
5a626855e27c0000017efc24_Healthy-Places-PPS.pdf (accessed on 23 October 2019).
29. Kārklin, a, R. Vai Laukos ir Pilsoniskā Sabiedrı̄ba? No, B. Bela, & B. Zepa (Zin.red.). Identitātes. Kopienas. Diskursi;
LU Akadēmiskais apgāds: Rı̄ga, Latvia, 2012; pp. 47–60.
30. Cano, E.L.; Moguerza, J.M.; Ermolieva, T.; Yermoliev, Y. A strategic decision support system framework for
energy-efficient technology investments. TOP 2017, 25, 249–270. [CrossRef]
31. Galdeano-Gómez, E.; Aznar-Sánchez, J.A.; Pérez-Mesa, J.C. The Complexity of Theories on Rural
Development in Europe: An Analysis of the Paradigmatic Case of Almera (South-east Spain). Sociologia
Ruralis. 2011, 51, 54–78. [CrossRef]
32. Pudzis, E.; Geipele, S.; Geipele, I. Community Participation in Village Development: The Scale of Latvia.
Balt. J. Real Estate Econ. Constr. Manag. 2016, 4, 84–99. [CrossRef]
33. Auzin, š, A.; Geipele, S. Creative Destruction for Sustaining a Land Development in Residential Areas; Riga Technical
University: Rı̄ga, Latvia, 2016; pp. 283–294.
© 2020 by the authors. Licensee MDPI, Basel, Switzerland. This article is an open access
article distributed under the terms and conditions of the Creative Commons Attribution
(CC BY) license (http://creativecommons.org/licenses/by/4.0/).You can also read