GHC Guidance: People in Need Calculations - World Health Organization
←
→
Page content transcription
If your browser does not render page correctly, please read the page content below
GHC Guidance:
                           People in Need Calculations

Introduction
The following document seeks to provide general guidance on how to produce people
in need figures for the Humanitarian Needs Overview (HNO). It has been written
specifically for the process that will be undertaken for the 2021 HNOs, in light of the
restrictions to data collection that have arisen due to COVID-19. It is recognized that the
data landscape will vary greatly from one location to another and for this reason, the
guidance remains broad and flexible to help encompass all potential situations. Even so,
it is possible that some clusters may lack the resources required to utilize this guidance. In
those circumstances ad hoc support will be provided.

In order to apply this guidance, it needs to be read in conjunction with the
accompanying Health PiN Calculator. While the included annexes do detail how the
indicators are calculated for PiN numbers, it is still necessary to ensure you have the excel
workbook.

Background
The (Humanitarian Needs Overview) HNO is designed to support the development of a
shared understanding of the impact and evolution of a crisis and inform the Humanitarian
Response Plan (HRP). It is the responsibility of the cluster/sector to provide the required
information on health needs to inform the intersectoral HNO. Clusters/sectors are required
to contribute to the development of the HNO and must provide people in need (PiN)
figures, ideally disaggregated by gender and age group, as well as flagging the most
vulnerable groups and factors associated with “critical problems related to physical and
mental wellbeing”. It is also necessary to quantify the severity of health needs. This
information is used in the Humanitarian Response Plan (HRP) to outline the various sectoral
needs and provide an explanation of the various funding requests included in the
response plan. The severity of needs is then factored into the intersectoral analysis and
overall severity that is, in part, used to help donors identify where to allocate funding. For
this reason, it is extremely important to ensure the HNO is well informed.

In an ideal situation, a coordinated needs assessment would be conducted to help
inform Health PiN and severity in conjunction with the available Public Health Information
Services (PHIS), but funding (and access) may not always be available for large-scale
needs assessments. If a coordinated needs assessment is not possible, particularly in
locations with limited active PHIS, it is necessary to either conduct a sector-wide joint
assessment (funding permitting) or to pool existing harmonized data from completed
assessments to create a concerted picture of need across the crisis affected area. When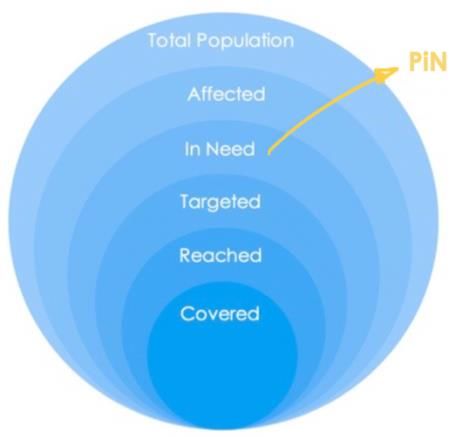
Health Cluster PiN Guidance | August 5th, 2020

producing information for the HNO, it is necessary to clearly document where the
information came from and the process used to calculate all provided figures. 1
Severity
When looking at needs it is necessary to understand ‘how bad’ the situation is. In this
sense, need can be understood as a simple question, is someone/a household in need
or not? Severity further elaborates by helping to understand how badly in need a
person/household/population is. Measurements of severity usually measure either
degree or magnitude. Indicators using degree can often be measured at the
household/individual level and help to classify how severe a situation is, while
measurements of magnitude (extent) are often determined at the area level helping to
classify how prevalent a situation is. For example, if someone is sick, their symptoms may
indicate how severe their illness is, with different symptoms associated with different
degrees of an illness. While measuring the degree of severity is a very useful objective,
health needs and health responses are determined at more macro levels and thus must
rely on measuring magnitude. For example, severity as it relates to measles vaccinations
looks at the proportion of the population vaccinated and becomes progressively more
severe as that proportion becomes lower (e.g. If at least 95% are vaccinated in urban
areas it is considered ok, while less than 85% vaccinated might be considered a severity
level of 5). To provide another example, distance to health facilities could be looked at
both ways, it is possible to measure degree by determining different levels of time to
reach the nearest health facility (e.g. less than an hour might be severity 2 while 2 hours
might be severity 4), or it can be measured by the percent of people living less than an
hours walk from the nearest health facility (e.g. 80% or more living less than an hours walk
away is severity level 1, while less than 60% is severity level 5).

People in Need (PiN)
PiN refers to the quantification of the number of people presenting needs, disaggregated
as appropriate.2 It provides the number of people in need of e.g. health assistance,
broken down by geographic region (the administrative level may vary by crisis but is often
set around the District level) and often by category of service (e.g. Health PiN of
reproductive health services). Data are usually disaggregated by women, men, girls,
boys as well as displacement status (refugee, IDP, returnee), population group and
people with disabilities.

Purpose
The purpose of this document is to provide guidance to produce Health PiN numbers. It
is hoped that through the provision of guidance these figures can become more
standardized enabling a more comprehensive picture of health need globally. It is also
felt that guidance can help to clarify the process required for Health PiN calculation
particularly as health needs do not generally follow the same process as many of the
other sectors and, as such, are not always simple to calculate.

1 The following two sources are useful for providing further details [PHIS Standards and TOOLKIT] &
[GHC Guide]
2 THE TEMPLATE FROM LAST YEAR IS BEING REVISED RIGHT NOW – WILL LINK TO THAT DOCUMENT
ONCE IT IS AVAILABLE.

                                                2
Health Cluster PiN Guidance | August 5th, 2020
The IASC defines people in need as “those members
[of a population]:
• whose physical security, basic rights, dignity, living
conditions or livelihoods are threatened or have
been disrupted, AND
• whose current level of access to basic services,
goods and social protection is inadequate to re-
establish normal living conditions with their
accustomed means in a timely manner without
additional assistance.”3
The humanitarian community currently classifies six population groups (though these are
usually disaggregated into additional groups that will be explained in detail further on).
The diagram above shows how PiN figures fit within the wider population group. Among
the population affected by a given crises, a subset is identified as ‘In Need’. In the case
of the Health Cluster, this would mean people identified as being in need of some form
of health assistance.
Population
The first step for any needs identification is clearly outlining the total population. In some
locations this is a straightforward process and merely requires access to agreed
population data. Yet, in many humanitarian locations this process is not so simple.
Population figures are generally based on census data, after a census is completed
(which is a very time consuming process), each year the population figures are updated
based on projections. Normally, a new census would be conducted after a certain
interval, for example in the US, UK, Italy, Thailand and China it is run every 10 years.
However, in many humanitarian settings, population data are not so easy to come by,
and even when it can be found, it is often unreliable. There are some countries where
cyclical census are not run. For example, Lebanon has not run an official census since
1932. Sometimes, there are large gaps between census, such as in Pakistan where there
was a 19 year gap between the most recent census (2017) and the one before it. In a
few locations, even with more recent census data, the information may no longer be
valid. Where widespread displacement occurs, movements can alter the distribution of
the population, and in situations where people flee across boarders, the overall
population figures can change. Beyond population movements, conflict, and natural
disasters, can lead to loss of life that would not be accounted for in the standard
projections. Ultimately, in order to determine who is in need, it is necessary to first
determine who is there.
When population data are considered unreliable, or is simply not available, it is important
to identify alternate sources. In the past few decades humanitarians have turned to
remote sensing options to help identify population figures. One such source of this data
3 IASC, Humanitarian Population Figures, 2016
3Health Cluster PiN Guidance | August 5th, 2020
is the LandScan Global Population Database 4, which uses algorithms that look at a
variety of factors, including lights at night, to determine how many people are in a given
area. These data are updated annually. Population figures derived from high-resolution
population distribution data can help to provide additional sources of information when
the available data are considered questionable.
Where displaced populations are concerned, IOM and/or UNHCR data on population
movements can be used to assist in updating figures. In some locations this process may
be intersectoral with organizations coming together to agree on how to factor in
displacement.
Where there is no agreed mechanism for identifying overall population figures, the Health
Cluster will need to agree with partners on which figures to use.
Health Affected
Once there is an agreed population dataset, it is necessary to determine which
population groups fall into the ‘Health Affected’ category. The Health Affected
population are those whom the health cluster identifies as people who should be
covered by the services offered through cluster partners. This may sometimes differ from
the wider ‘affected population’. For example, it may be determined that the health
cluster is only supporting displaced populations while host communities may also be
identified as ‘affected’ by the humanitarian crisis. Identifying who should be reached is
the first step to narrowing down Health PiN figures.
Health Needs
One of the most important factors in humanitarian settings is understanding what
affected populations’ “accustomed means” actually are. While Sphere has produced
minimum standards for humanitarian response, there is always a dilemma between what
falls under humanitarian responsibility and what falls under the responsibility of
development actors. The clearest distinction is generally understanding the situation
before the crisis as the baseline, and the goal of humanitarian actors being to arrive back
at said baseline. Meaning, if the situation did not meet the minimum standards before
the crisis, arguably it does not need to afterwards.
Health needs can be difficult to quantify as they are not defined purely on an individual’s
health status but rather must take into consideration the ability of health systems to
respond to needs. It is also necessary to consider any additional factors that may
exacerbate standard health requirements, such as outbreaks, famine, conflict etc. In this
sense, there are two major considerations for identifying health needs, and thus the
number of people in need of health assistance.
4 Though the LandScan data are one of the more well known population databases, it does come
with its own set of drawbacks. Some of the more commonly noted ones are that it is not entirely
transparent about the methodology used to calculate populations and factor in displacement.
Please note, updated LandScan data needs to be purchased, and it is often not current enough
for factoring in recent displacement figures.
4Health Cluster PiN Guidance | August 5th, 2020
i. Health Service Requirements - How many people can be covered by the existing
service capacity at a minimum (and therefore, how many people cannot be
covered – who are then classified as ‘in need’), and;
ii. Compounding Factors - What factors exist that may increase the number of
individuals the health system is required to service and thus increase the number
of individuals
In some of the longer-standing clusters, additional groups have been identified (e.g.
Health Seeking Behaviours, Health Outcomes, Health Accessibility, and Impact on
Populations Health and Morbidity). The diagram below shows how those groups can fit
into the broader two categories outlined above.
Health Service Requirements Compounding Factors
Health Health
Health Resource Coping Health Outcomes
Strategies Seeking
+
and Service
Behaviours
Availability
Impact on
Health Service Populations
Coverage Health Affected Health and
Accessibility Population Morbidity
In future years it is likely that Health PiN will be calculated through a wider range of sub-
topics. However, due to COVID-19 and restrictions on primary data collection, it was
decided to limit the classification of indicators into sub-topic in order to ensure some
clusters do not end up with large gaps for entire topics.
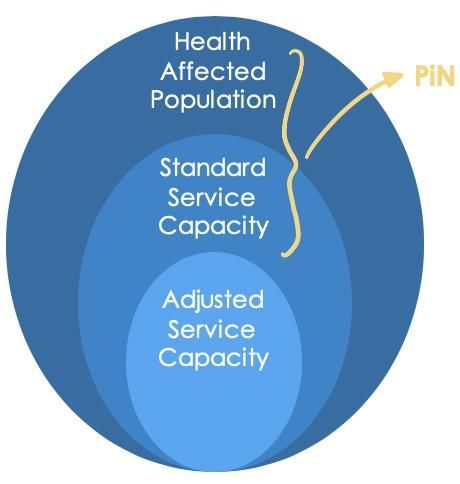
Health Service Requirements
In the case of humanitarian settings, the entire ‘Health Affected’ Population should be
taken as the starting point. It is the objective of the health sector to ensure all affected
people have access to the health services
they require. In this sense, we end up with a
‘Health Onion’ to identify the health needs of
a population. This ‘onion’ (shown on the left)
has three circles, with the middle circle
representing the current capacity of health
services to cover a minimum set of
requirements outlined in the core health
indicators. The list of indicators that are
factored into ‘standard service capacity’ can
be found below, but include such factors as
number of community health workers per 500
people in rural and hard-to-reach locations,
percentage of population that can access
primary healthcare within one hour’s walk
from dwellings, number of skilled birth
attendants per 10,000 people etc.
5Health Cluster PiN Guidance | August 5th, 2020
The exact thresholds used for these indicators may vary by location. The ones suggested
in the core indicator list are based on minimum standards, but, as noted above, there
may be situations where the pre-crisis conditions were below the minimum standards. In
those situations, the thresholds may be altered to be in line with the pre-crisis baseline.
Compounding Factors
Standard service delivery looks at the minimum requirements for providing healthcare to
a population, but these requirements may not be sufficient in areas where there are
added stressors on the health of the affected population. In outbreaks, it may be
necessary to have more beds available to treat increased numbers of sick patients. In
famines, there is an expectation of higher numbers of people with severe acute
malnutrition with complications that would need treatment. During conflict, attacks can
lead to greater numbers of injuries while psychosocial trauma may also increase. To
ensure the affected population has access to the services they require it is necessary to
calculate the additional needs these factors may place on health facilities. In light of
these factors, the service capacity must be adjusted as the diagram above indicates.
Thus:
Health PiN = Affected Population – Affected Population covered by Adjusted Service Capacity
Health PiN Calculation
The Health PiN calculator provides the first step in determining Health PiN requirements. It
is broken into two sections that look at Health Service Requirements and then
Compounding Factors. It follows the Global Health Cluster Core Indicator list using
available thresholds. Each cluster may add indicators they deem relevant to their
context, but it is important to ensure thresholds are added as well. As Health PiN is not
calculated based on specific individual data, it is not currently possible to determine who
needs what (and where needs converge), for this reason, the Health PiN calculator
assumes overlaping needs. To accurately determine how different needs relate, it would
be necessary to have household or individual level data that could tell us which
households need what (and how many different needs a single household/individual
may have). As we are not able to collect all data from a single source, and have to rely
on area-level, and facilities-based, data for most indicators, we must then assume that
needs are overlapping.
For each administrative area, the calculator will take the highest ‘in need’ figure
available, accounting for all included indicators. What this means is that in areas where
50% of the population is not covered by availability of ICU beds and 20% of the
population is not covered by skilled birth attendants, the higher need (i.e. 50%) would be
used. This decision assumes that lack of sufficient service then overlaps with any
extenuating circumstances (e.g. high rates of children not vaccinated for measles) which
may not always be accurate and is likely to underestimate need. For this reason, the
Health PiN calculator can only be considered a first step towards the identification of
Health PiN numbers and expert discussion must be undertaken before any figures can be
finalized.
6Health Cluster PiN Guidance | August 5th, 2020
EXAMPLE:
Scenario A Scenario B
20,000 in Need
(available health
facilities)
PiN is the 20,000 in Need 8,000 in PiN is the
Max. Vs (available health Need (DTC3 Sum
(20,000) 8,000 in . facilities) Vaccination (28,000)
Need (DTC3 s)
Vaccination
s)
In Scenario A, needs are shown as overlapping, assuming that the 8,000 people in need
of vaccination support are also living in areas without functioning health facilities.
Scenario B assumes the opposite, that those in need of vaccination support are not
also living in areas without functioning health facilities. In reality, the situation is likely to
be a mix of the two. Unfortunately, as we are not in a position (at this time) to determine
exactly how needs converge at the household / individual level, the maximum
approach is the best assumption as we can say with some confidence that we know
at least 20,000 people are in need. The work of the expert judgement group is to help
adjust the numbers if they feel some needs are not overlapping, and thus more people
are in need. Using this fictional example, available 3/4 W data may indicate that a
vaccination campaign was recently carried out across much of the administrative
area, but missed two communities of roughly equal size. The available data from
HeRAMS shows that one of the two communities has a functioning health facility
nearby while the other does not, it can be assumed that half of the population in need
of vaccination support do not overlap with those in need of access to primary health
facilities. Thus the expert judgement group may revise the suggested PiN number up
from 20,000 to 24,000 and note that the decision was based on available 3/4 W data.
A note on displaced populations
In camp situations it is likely that many (or all) of the health services available are being
provided by partners rather than the state. In these situations, those services should not
be included in the service capacity as funding will be required to ensure they can be
maintained. As the objective of Health PiN is to provide an overview of needs to inform
the Humanitarian Response Plan (and thus funding requests), it is important to ensure any
services that need to be maintained are counted as ‘in need’. In this sense, if health
services in camps are provided solely by partners, the entire camp population would be
deemed ‘in need’. In many situations, camp or spontaneous settlement populations may
be considered in need of health assistance regardless of weather or not services are
provided by state or non-state actors. It is important to note if displaced populations are
considered ‘in need’ of health assistance, and if so, to include their entire population
figure.
COVID-19
While, at present, there is a Global Humanitarian Response Plan that covers the COVID-
19 specific needs, that response plan will expire at the end of 2020 when COVID needs
should be absorbed into country specific Humanitarian Response Plans (HRPs). For this
reason, the HNO’s for 2021 will need to factor in COVID-19 needs.
7Health Cluster PiN Guidance | August 5th, 2020
At present we are recommending COVID-19 be considered in two ways, the first is in
Health PiN and the second is in scenario projections. To calculate Health PiN, the Adaptt
tool is recommended. Adaptt will provide an estimated number of beds required for
scenarios based on four different attack rates: Very Low, Low, Medium, and High. For
Health PiN we request that the ‘Low’ attack rate be used with the bed requirement for
critical cases comprising the Health PiN requirement for COVID for that location. As it is
possible to edit the population figures used in Adaptt, the population can be adjusted if
the crises affected population does not cover the whole state (e.g. Cox’s Bazar). For the
scenario projections, we recommend that scenario descriptions be provided for both
Medium and High attack scenarios as well. The results of the Adaptt tool using the low
attack rate should then be input into the Health PiN calculator in the Compounding
factors sheet.
Severity Calculation
Much like PiN, severity is calculated using Health Service Requirements and
Compounding Factors, however this time greater weight is placed on compounding
factors. The indicators included under Compounding Factors tend to be more severe as
they focus on the present situation rather than the capacity of health services to meet
their day-to-day requirements. For this reason, they play a greater role in determining
severity. It is important to note that in many cases, the highest PiN figures will arise from
the Health Services Requirement grouping of indicators as services are required for entire
population groups and gaps can often be large. As severity is weighted more towards
the indicators classified as compounding factors, it is very possible to have a large
discrepancy between the calculated severity figure and the calculated PiN figure. For
example, it is possible that an area will be classified as a severity level 2 but have more
than 80% identified as in need. These discrepancies should be discussed by the expert
judgement group and, if no alterations are made, a brief rationale for the discrepancy
should be provided (e.g. There are very few medical facilities in this area which is a
situation that needs to be addressed, however, at present there are no pressing health
concerns requiring immediate attention).
Severity Thresholds
For the 2021 HNO process, the severity thresholds are designed in-line with the JIAF
thresholds that will be used for intersectoral severity. As the JIAF only uses severity levels 3
and above to determine PiN, the current (core) health indicators only provide 4 scales
instead of 5, with the provided scale for severity levels 1 and 2 being the same 5. The main
threshold is the one provided for severity level 3.
Not all indicators have thresholds provided. Those without the requisite levels of thresholds
will not be used for determining severity6. In the case of any indicators added at the
cluster level, it will be important to ensure severity thresholds are included so indicators
may help for identifying severity. This is particularly true of indicators measuring incident
rates and/or case fatality ratios for key diseases in those locations.
5 There is one exception to this rule, the indicator measuring disabilities based on The Washington
Group Questions has five different levels of severity, however it is measured at the household level
6 It is not always necessary to provide thresholds for all severity levels, but it is recommended to at
least provide three.
8Health Cluster PiN Guidance | August 5th, 2020
How the Thresholds Have Been Designed
Severity thresholds of indicators are usually classified in one of two ways, measuring the
degree of an outcome vs. the magnitude of the situation. The degree of severity is
generally measured at the individual or household level. For example, the Washington
Group Questions classify disabilities at the individual level from “no difficulties” at severity
level 1 to “at least four domains are ‘cannot do all’7” at severity level 5. Symptoms of
diseases are often classified in this way as well with certain symptoms being associated
with a more severe prognosis. However, as health needs are not determined at the
individual or household level, outside of disabilities, degree of severity is not an overly
useful method for health clusters. Thus, we must rely on magnitude. When classifying
severity by magnitude, two factors are considered, the first is binary – e.g. who has or has
not received a given vaccination, and the second is the percent of the population that
classifies in that group (e.g. 70% of the population has received the measles vaccine).
Severity thresholds are then designed around that proportion, e.g. 95% and above is not
considered ‘in-need’ and thus is below a severity level 38. Less than 95% is at least a level
3. Degrees of severity have then been broken down into equal groupings. In this case,
5%. So, below 95% is a 3, below 90% is a 4 and below 85% is a 5.
Please note, the only threshold that has been widely agreed is the one provided under
severity level 3. At present we have recommended thresholds using even groupings for
severity levels 4 and 5, but these will need to be re-examined and adjusted based on
lessons learned.
Universal Severity
The premise behind universal severity is that all indicators are classified using the same
scale. At present, all clusters are classifying each of their indicators (or indicators that can
be classified) using the same 5 point scale. Meaning that all indicators should have
thresholds provided for each level. Universal severity, on the other hand, would provide
a common definition for each severity level and indicators would only have thresholds
provided where suitable. For example, if a level 5 equates to imminent death, then most
indicators would not have a threshold for level 5.
Critical Indicators
In lieu of universal severity, critical indicators are being used. Indicators that measure the
most severe situations (e.g. those that, in a universal severity model, would have
thresholds for level 5) are flagged as being ‘critical’. The severity level of these indicators
can then override the severity of others. Using an individual level example, think of a
person with extremely severe malnutrition. If they are in such a severe state that death is
imminent, it does not matter if all other indicators are positive, they still should be
measured as a severity level 5.
Critical indicators that measure magnitude are quite a bit more difficult to classify.
COVID-19 can provide a useful example. The first measure that should be determined is
where the situation becomes a problem. So, for COVID-19 this would mean identifying
the point where the incidence rate is likely to exceed the capacity of medical services.
Thankfully, there are a number of tools available which can help to project resource
7 For further detail on The Washington Group questions please reference their guidance
8 In rural communities it would be 90%
9Health Cluster PiN Guidance | August 5th, 2020
requirements for COVID-19 and these can help set the thresholds. Using a fictional
example, lets say the projected bed requirement for a medium attack rate (using
Adaptt) is 215 ICU beds, and you know there are a total of 250 in-patient beds in the
area. Considering you require 215 ICU beds for COVID-19 and this leaves only 35 beds for
every other medical issue that might arise, you know you will have a bed shortage at the
medium attack rate (set at an incident rate of 20%).9 At the local level you will then need
to agree where to set the different thresholds. You know, once the COVID-19
requirements start taking up too many of the available resources care for other needs
will suffer. At a certain point this resource strain will start to impact critical care and could
result in increased mortality. At a severity level 5, people will be dying because the
resources are not available to keep them alive. As these lines are strongly based around
the available resources in-country, they need to be locally defined. Even at the local
level they may prove difficult to set as the situation may vary from one location the next.
Defining critical indicators will be one of the most important roles for the expert
judgement group, and setting those thresholds may prove one of their most difficult tasks.
To do this, they must ensure that these indicators are highly severe, and that the
thresholds created at the highest levels (e.g. severity 5) equate to ‘imminent death’.
For example, it may be decided that in camps situations where living conditions are
crowded, lower incidence rates may equate to higher thresholds as the R0 would be
higher.
Calculating Severity
Once thresholds have been agreed for the various severity levels, and critical indicators
have been identified, severity can be calculated. Using the same ‘Score Card’ used for
PiN (scrolling down on the worksheet), the severity calculations will be shown. They are
determined by comparing the results of all the indicators included in the severity
calculations to the various available thresholds. A severity level is then provided for each
indicator.
Of the core indicators included, 10 have severity thresholds provided, 5 classified as
Health Service Requirements and 5 as Compounding Factors. Their results will be
averaged for each grouping. They are then combined with the Health Service
Requirements providing 40% of the weight and Compounding Factors providing 60% of
the weight. Compounding Factors has increased weighting as these are the indicators
that generally measure humanitarian circumstances.
Any critical indicators that are included will then be used to over-ride the calculated
severity. An over-ride would equate to increasing the score only. Thus, the weighted
severity score will remain the same if the critical indicators are a lower severity level, but
if they are a higher level, they will over-ride the weighted score and provide the basis for
severity.
For example, if you have the following indicators:
9Other medical resources can also be factored in as the tools available help to project many
different resource requirements
10Health Cluster PiN Guidance | August 5th, 2020
Indicator Severity Weight Calculation Score
Average Health Service
3 0.4 1.2
Requirements Severity
3.6
Average Compounding
4 0.6 2.4
Factors Severity
Ebola Severity (Critical) 2
3
Plague Severity (Critical) 3
Using the example above, the severity for each of the two groups is multiplied by the
weight then the two results are added together to provide a weighted score. For critical
indicators, the score is the maximum severity for the provided critical indicators. The final
severity level is then calculated using an ‘if’ function. If the critical severity is higher than
the weighted severity, the overall severity should be the critical figure. If the critical
severity is lower, then the overall severity would reflect the weighted severity score (in this
case 3.6).
Expert Discussion
Once the Health PiN calculator has been used, the results should be shared with a pre-
identified panel of ‘experts’. Defining ‘experts’ can be problematic in humanitarian
settings. Often the identified individuals are just the ones who were available to attend
the meeting. In this particular case, it is recommended that the following profiles be
included in the panel that will provide expert judgement on Health PiN.
• Knowledge of analysis and a firm understanding of the Health PiN calculator and
the formulas behind it
• Local knowledge on the areas being evaluated – this can be individuals who have
spent significant amounts of time working on the ground, conducting research, or
who are from that area
• Knowledge of the datasets being used to inform the analysis, particularly anyone
who worked on the assessments in question
In humanitarian terms, these would be field staff who are well informed about the various
areas, M&E or assessment staff, IMOs and/or analysts. In some cases, there may be staff
who are known to be knowledgeable that should be sought out – regardless of their
current title. The objective is to find a panel of individuals who are knowledgeable on the
subject matter and who the wider cluster recognizes as being knowledgeable. To ensure
a productive discussion, it is recommended that the group be kept relatively small
(approximately 10 people).
Once the panel is identified, it is recommended that a workshop be arranged for them
to meet and run through the various indicators and information available for each
administrative area. These ‘scorecards’ – the output of the Health PiN calculator - then
need to be considered alongside additional indicators that may not have specific
thresholds (e.g. percentage of identified SSA incidents verified).
Step 1: Identify Health Affected Population
In some circumstances the population identified as ‘health affected’ may not be as clear
as in others. It is important to ensure all decisions are recorded and explained so the
methodology can be well understood by partners. As noted above, this population may
11Health Cluster PiN Guidance | August 5th, 2020
not be the same as the wider ‘crisis affected population’, and likely is a subset of the total
population. As Health PiN is used for the development of the HNO and thus informs the
HRP, it is important to ensure the affected population falls within the boundaries of the
population covered by the HRP. In this sense, the number of health affected should not
exceed the population affected. As all information will be calculated for that group of
individuals, it will be important to ensure all data are available at that level.
Step 2: Reliability
Data reliability is always a concern. With rapidly evolving situations, it is important to
ensure data are as up-to-date as possible, sufficiently representative, and collected using
a transparent and well-defined methodology. However, in humanitarian situations, it is
often necessary to rely on data that are not considered highly reliable. At this stage we
do not have a set methodology for quantifying reliability, rather, it is recommended that
during expert judgement, a reliability score should be set for each data source and that
score should be noted for the record. Each data source should be graded on a score of
1-5, where 5 = Reliable and 1 = not useable. Any provided score should be explained
(e.g. insufficient sample size, high non-response rate, sufficient data but out of date, etc.)
Where datasets are scored below 5, their results should be considered by the expert
judgement group and the following questions should be asked:
a) Is the data so unreliable that it should be excluded?
b) Are the results lower than they should be?
c) Are the results higher than they should be?
If required, the resulting Health PiN for unreliable data can be altered, however it is
important to record the reasons that decision was taken and what information was used
to draw the conclusion reached.
Step 3: Review Thresholds
The thresholds provided are based on minimum standards, many of which have been
taken from Sphere. However, these may not always be the best thresholds to use.
Generally speaking, humanitarian assistance is provided after a crisis to ‘put things back’
while development assistance deals with longer-term, socio-economic issues. If the
situation in a given context was below minimum standard prior to a disaster, it would then
not be the obligation of humanitarians to meet our set minimum standard, but rather
ensure that things are at the standard they were prior to the hazard that led to the crisis.
For example, in the fictional Kingdom of Arnor over 70% of the population lives more than
an hour’s walk from a health facility. Arnor experiences a large earthquake and the entire
country is affected. Of their 500 health facilities, 30 are directly damaged and 20,000
people have been displaced. It is the responsibility of humanitarian actors to repair the
damaged facilities and ensure people have access to healthcare in those areas, as well
as ensuring the 20,000 displaced have access to sufficient healthcare. However, it is not
the responsibility of those humanitarians to build more health facilities and provide
healthcare to the point of meeting the minimum standard. In essence, if the nearest
health facility is 3 hours away before a disaster, it is not the responsibility of humanitarians
to ensure it is closer after the disaster. This particular topic can be quite contentious –
particularly when there are areas of high need that may not be related to the crisis being
12Health Cluster PiN Guidance | August 5th, 2020
responded to. While the purpose of this guidance is not to tell you how to decide which
people to consider ‘health affected’ within the context of a given crisis, it may sometimes
be necessary to alter thresholds so they meet a pre-crisis baseline. In this case, if only 30%
of people lived within an hour’s journey of a health facility before the crisis, the threshold
for the percentage of the population living within an hour’s walk from the nearest health
facility could be revised to 30%.
In many situations, baselines will not be available. For those circumstances we
recommend using the thresholds provided as a starting point but allowing for adjustment
based on discussion.
Please note, that while it is often the objective to return people to the situation they were
in before the crisis, when their previous circumstance far exceeds the minimum standards
we do not recommend revising them upwards.
When reviewing the thresholds to be used for assessing severity, it is also necessary for the
expert judgement group to identify critical indicators (if any have been used). Please
ensure any indicator identified as ‘critical’ meet the definition where a severity level 5
would equate to imminent death.
Step 4: Review the ‘scorecards’ and finalize Health PiN
Using the figures produced by the Health PiN calculator, this group will then need to
agree on a final Health PiN number of each location. It will be very important to consider
additional factors like accessibility (e.g. hard-to-read or remote areas where they may
not have any access to health services would then have their entire population in need).
For each location, the additional ‘expert judgement’ indicators will need to be discussed
and factored in using the following questions:
a) Does this information suggest that more people are in need than the Max Health
PiN?
i. If yes, what should the Health PiN be adjusted to?
b) Does this information suggest that less people are in need than the Max Health
PiN?
i. If yes, what should the Health PiN be adjusted to?
Step 5: Severity
Severity ‘scorecards’ can be found below the PiN scorecard, and they also provide a
breakdown for each indicator. The calculated severity should be examined against the
individual breakdown of indicators, and the following questions should help guide the
discussion:
a) Are there any outlier indicators? (indicators that are particularly high that may
suggest the situation is more severe than the calculated severity suggests)
b) Does the severity level make sense in light of the finalized PiN? (as a guide, the
following thresholds can be used: Severity 1 approx. 15% in need, Severity 2
approx. 35% in need, Severity 3 approx. 55% in need, Severity 4 approx. 70% in
need, Severity 5 approx. 90% in need)10
10These proportions have been derived from those used at present in some cluster locations. They
should be re-examined against the final calculations across all clusters for the 2021 HNO.
13Health Cluster PiN Guidance | August 5th, 2020
c) Are there any additional data sources that suggest a different severity level for this
area? (Even if they do not provide the threshold requirements)
d) Is this data sufficiently reliable or is there more recent anecdotal or qualitative
information available that should be factored in?
Note on Reporting Against Health PiN
As mentioned before, Health PiN is not as straightforward as determining the health status
of an individual or household. In order to ensure sufficient capacity to respond to health
needs, it is necessary to project standard need requirements and plan on meeting them.
This helps to provide a Health PiN figure, but can be complicated when it comes to
measuring the response. As the services provided by health partners generally do not
involve distributions to household or individual like many of the other sectors, the way
they are reported is also different. Response indicators will vary from the indicators used
to calculate Health PiN and may include measures to determine the types of medical
procedures provided, treatment courses, number of consultations etc.
When it comes to measuring the COVID-19 response, indicators can be extremely difficult
to identify. In some scenarios it has been suggested to use district level mortality rates,
however, even with wide intervention, if cases are still increasing, it is likely the mortality
rates will also rise so it is entirely possible that successful interventions will not result in an
overall decrease as they would be reducing the rates that might have occurred but did
not.
The diagram below is a fictional example to illustrate this:
In this graph, the dark blue line represents the current
Mortality: 5.1
situation, where there is a mortality rate of 3.2. The
yellow line represents the situation without partner
Mortality: 4.1
intervention, reaching a mortality of 5.1, the bright
Deaths
Mortality: 3.2
blue dotted line represents the mortality with
intervention which is 4.1. If the baseline is taken as 3.2
the intervention would appear to have been
Days unsuccessful as the mortality still increased, it just did
not increase as much as it would have without intervention. The problem is that we are
then trying to measure something that did not happen. Quantifying a negative such as
this can be very difficult. One option to consider is to monitor against projections as
opposed to baselines, but projections are estimates so should not be considered
concrete evidence.
Health PiN Indicators
Most of the following indicators are taken from the GHC Core Indicator List, those in red
are from other clusters lists. There is an annex of this document that provides more detail
on each of these indicators with comments on how they should be collected. They should
not be considered exhaustive and will require supplementation with indicators more
specific to the context. Some indicators we recommend you consider are:
• Cost of healthcare as a means of accessing healthcare
• Number of elderly as a proportion of the population
• Number of children under 5 years old as proportion of the population
14Health Cluster PiN Guidance | August 5th, 2020
• Number of attacks on healthcare facilities
• Access to sufficient electricity
The following questions are provided as possible suggestions for inclusion into MSNA’s if
they are taking place. If an MSNA is going forward the Global Health Cluster IM Team
can provide support and guidance on useful questions to include11:
• Has there been an unusual number of deaths in the last 4 months? [time period
can be adjusted]
• Is there anything that prevents you from accessing health services?
• Are there any people/groups who have a harder time accessing health services?
• What sort of obstacles do people/groups face when trying to access health
services?
• Are there any problems with access to medication? (not available, high cost, low
quality, etc.)
• What do people in your household do if someone gets sick? (traditional healers vs.
healthcare facilities, pharmacies, etc.)
• Are there healthcare workers working in your community?
• What are your top 3 concerns about you and your family’s health right now?
• Are there many people in your community who are currently so upset to be unable
to conduct usual daily activities (for example getting out of bed, ability to work, to
take care of family…)?
• Have you ever heard of COVID-19?
• If yes, what can you do to stop you and your household getting sick? (use
contextualized answer options – e.g. this disease does not affect our ethnic group,
take malaria medication, etc. along with recognized methods for reducing the
spread. These answer options should not be read out, the question should be
asked and the answer options that best describe what the individual says should
be selected).
Prior to commencing with Health PiN calculation, it will be important for partners to agree
on which indicators to add and where the data will be sourced from. Please note, many
of these indicators may not be available, so use the information you have on hand or are
able to procure.
Health Service Requirements
Indicator Threshold
Average urban population per functioning health facility 1 per 10,000
Average rural population per functioning health facility 1 per 250,000
Number of inpatient beds per 10,000 people >= 18
Number of community health workers per 500 people in rural
Locally determined
and hard-to-reach locations
Percentage of population that can access primary
>= 80%
healthcare within one hour’s walk from dwellings
Percentage of healthcare facilities that deliver essential
>= 80%
package of health services
11These indicators would all fit under ‘Compounding Factors’ and could help to inform severity,
but need to be combined with information on service availability in order to determine Health PiN
15Health Cluster PiN Guidance | August 5th, 2020
Proportion of healthcare facilities with a trained IPC health
100%
worker
Proportion of healthcare facilities where the main source of
water is an improved source, located on premises, from 100%
which water is available
Number of health facilities with Basic Emergency Obstetric
>= 4 BEmOC
Care per 500,000 population
Number of health facilities with Comprehensive Emergency
>= 1 CEmOC
Obstetric Care per 500,000 population
Number of skilled birth attendant personnel per 10,000
>= 23
people
Compounding Factors
Indicator Threshold
Coverage of DTC3 (DPT3 / PENTA3) in 90%
90%
received measles vaccination
in rural areas
Taken as a whole
Severe acute malnutrition (SAM) in children 6 to 59 months
figure
All without access
Percent of Households having access to an improved water considered at risk of
source requiring medical
support
All considered in
Percent of the population identified as having disabilities (in
need of medical
line with the Washington Group Questions)
support
All considered in
Pregnant and lactating women as a percentage of total
need of medical
population
support
Need to clarify if
partners are
Displaced population providing primary
healthcare. If so, total
population is taken
(Where Integrated Phase Classification is in place) Proportion
Total population
of the population identified as IPC Phase 5 and Phase 4
Expert Judgement Indicators with no thresholds available
Indicator Threshold
16Health Cluster PiN Guidance | August 5th, 2020
Percent of health facilities providing clinical management of rape (EC, PEP and STI
treatment)
Number of days essential medicines are not available in a one-month period
Percentages of medical facilities, social service facilities and community programs
who have staff trained to identify mental disorders and to support people with mental
health and psychosocial problems
Percentage of identified SSA incidents verified
Health PiN Calculation Process: Checklist
1) Create Expert Judgement Group
Put together a small working group for the HNO Health PiN
calculations comprised of representatives from partners
with experience in analysis and/or extensive local
knowledge for the geographic region covered by the
HNO.
2) Identify Indicators
Go through the list of indicators and determine which you
will include. Please be sure to factor in which indicators you
will have information for and how recent that information
is.
Add indicators that you feel are relevant to your specific
context
Ensure all indicators listed in Health Service Requirements
and Compounding Factors have thresholds applied.
If major changes are required reach out to the GHC so the
calculator can be adjusted to your specific requirements
3) Run the Calculator
Input available data at the smallest administrative level
required for reporting.
Run the calculator and share the results with the Expert
Judgement Group
4) Run Workshop
Recommend planning a workshop for the Expert
Judgement Group to go through the results of the
calculator and consider the various indicators listed under
‘Expert Judgement’. This group must agree on a final
Health PiN figure for each required administrative area
The expert judgement group must also agree on severity for
each required administrative area
It is the responsibility of cluster coordination to ensure all
rationalizations for each decision taken are recorded. A
comments space is provided for each indicator and beside
each administrative area for these decisions to be
17Health Cluster PiN Guidance | August 5th, 2020
documented. Once completed the workbook should be
saved to provide a record of the methodology used.
18Health Cluster PiN Guidance | August 5th, 2020
Annex A
GHC Core Indicators incorporated into the Health PiN Calculator
Health Service Requirements Indicators
HeRAMS or
One healthcare
similar service
Average population per facility per 10,000
EPI
functioning health facility Baseline, people; and
microplanning
(HF), by type of HF and by Outcome One district or rural
data from
administrative unit hospital per 250,000
vaccine or NID
people
campaign
Comments: This is a proxy indicator of geographical accessibility and of equity in
GH_4
availability of health facilities across different administrative units within the crisis
areas
Please note, this will not adequately measure healthcare coverage in all settings
and should be used in conjunction with other indicators.
If an existing current population dataset is available, then HERAMS is preferable for
broad statements like national or sub-national (but not community) coverage.
When planning at LOCAL levels then other methods should be used.
It is important to assess the quality of the data available and make a note of said
quality where the indicator is reported.
Number of inpatient beds Baseline /
HeRAMS, RHA >= 18
GC_2
per 10,000 people Output
Comments: Indicator for the availability of hospital beds across crisis areas and
proxy indicator of equity in the allocation of resources.
HeRAMS or
Number of community health
similar service, 1 - 2 (depending
workers per 500 people in Baseline /
Cluster Partner on the identified
rural and hard-to-reach Output
Reporting constraints)
locations
(3/4W)
GC_3
Comments: Community programming with CHWs (including volunteers) increases
access to hard-to-reach populations, including marginalised or stigmatised
populations. If there are geographical constraints / acceptability issues in diverse
communities, one CHW may only be able to serve 300 people rather than 500.
Depending on circumstance, this indicator may only relate to rural areas (which
would need to be clearly defined).
Percentage of population
GC_4
that can access primary Baseline /
Survey >= 80%
healthcare within one hour’s Outcome
walk from dwellings
Percentage of healthcare
Baseline / HeRAMS or
facilities that deliver essential >= 80%
Output similar service
GC_5
package of health services
Comments: The ‘essential package of health services’ must be defined to use this
indicator. Use the minimum package of services that has been agreed at country
level.
19Health Cluster PiN Guidance | August 5th, 2020
Proportion of healthcare
Baseline / HeRAMS /
facilities with a trained IPC 1
IP_1
Output similar service
health worker
Comments: Proxy indicator for infection, prevention and control (IPC)
Proportion of health care
facilities where the main
source of water is an Baseline / HeRAMS /
1
improved source, located on Output similar service
premises, from which water is
IP_2
available
Comments: Proxy indicator for infection, prevention and control (IPC). Could be
considered an output indicator if running water is being installed as part of a
project.
This indicator should be coordinated with the WASH Cluster.
Number of HF with Basic
Emergency Obstetric Care/ HeRAMS / >= 4 BEmOC/500
Input, proxy
500,000 population, by similar service 000
administrative unit
SR_1
Comments: Proxy indicators for the physical availability and geographical
accessibility of emergency obstetric services and their distribution across districts in
the affected areas. An unbalance between the availability of BEmOC and CEmOC
(with too few BEmOC) is often observed.
Recommend coordinating with UNFPA regarding figures
Number of HF with
Comprehensive Emergency
HeRAMS / >= 1 CEmOC/500
Obstetric Care/500,000 Input
similar service 000
population, by administrative
unit
SR_2
Comments: Proxy indicators for the physical availability and geographical
accessibility of emergency obstetric services and their distribution across districts in
the affected areas. An unbalance between the availability of BEmOC and CEmOC
(with too few BEmOC) is often observed.
Recommend coordinating with UNFPA regarding figures
Number of skilled birth
attendant personnel Baseline /
HeRAMS >= 23
SR_3
(doctors, nurses, certified Output
midwives) per 10,000 people
Comments: SPHERE standard.
Compounding Factors Indicators
Coverage of DTC3 (DPT3 /
PENTA3) in < 1 year old, by Outcome HIS, Survey > 90%
CH_1
administrative unit
Comments: This data may be available through projections, but if so, the quality of
the data should be checked and noted.
20Health Cluster PiN Guidance | August 5th, 2020
Proportion of under 5 year-
olds confirmed malaria cases EWARs or other
who received antimalarial Output surveillance
treatment after diagnosis system
(clinical and lab)
CH_2
Comments: Only for malaria endemic areas.
Though data may not always be available on treatment received (rather than
number of confirmed cases), it is advised that treatment data be collected where
possible in order to provide an adequate output measure.
Research has suggested that treatment coverage is not suitable for household level
collection. For further information, please see:
https://malariajournal.biomedcentral.com/articles/10.1186/s12936-018-2636-3
Thresholds must be
% of the population identified defined according
HH or
as having disabilities (in line to the local
Baseline Individual level
with the Washington Group context and the
survey
Questions) nature of the crisis.
Measure trends
Comments: The Washington Group Questions should be used for collecting this data
GH_3
if the data are not already available from more detailed (reliable and recent)
surveys.
It may be necessary to add some questions in certain contexts. (e.g. If there is
concern about disproportionally high percentages of people living with disability
because of the crisis, it may be necessary to ask when the difficulty started.) For
further information please look at: https://reliefweb.int/report/world/disability-data-
collection-summary-review-use-washington-group-questions-development
Please note, it is important to ensure enumerators are properly trained and
questions are CAREFULLY translated.
Expert Judgement Indicators
% of health facilities providing
clinical management of rape
(EC, PEP and STI treatment Baseline / HeRAMS or
1
disaggregate by which of the Output similar service
GB_2
three services are being
provided)
Comments: Comprehensive post-rape care -for this indicator- is defined as offering
EC, PEP and STI treatment.
This indicator is a more comprehensive measure of clinical management of rape
(CMR).
IRA, RHA,
Number of days essential Surveys,
GC_1
Baseline /
medicines are not available Broader surveyHealth Cluster PiN Guidance | August 5th, 2020
Comments: SPHERE standard. Essential medicines include drugs, vaccines and
blood products. Should be based on the national essential medicines list. The
indicator will need a list of 'essential medicines' for each context. ANY of those
being unavailable for a day counts as 1 day. Expired medicines should not be
counted
Percentages of medical
facilities, social services
facilities and community
programs who have staff Baseline /
trained to identify mental Output
disorders and to support
people with mental health
and psychosocial problems
MH_1
Comments: MHPSS programs are likely to vary a lot from one country to the next,
not just in terms of content, but also in terms of delivery methods. It is important to
make note of the local context, so it may be considered if results ever need to be
aggregated at higher levels.
Inclusion of social services facilities and community programs is according to the
size of the area under measurement, as it can sometimes be feasible and
sometimes not. If not feasible (i.e. no idea about the denominator), it is better to
focus on health facilities only, recognising that real coverage is likely
underestimated (i.e. we are missing all services provided through other providers).
Percentage of identified SSA
SS_1
Process SSA
incidents verified
22You can also read