Farmers' Willingness to Pay for Services to Ensure Sustainable Agricultural Income in the GAP-Harran Plain, Sanlıurfa, Turkey - MDPI
←
→
Page content transcription
If your browser does not render page correctly, please read the page content below
agriculture
Article
Farmers’ Willingness to Pay for Services to Ensure
Sustainable Agricultural Income in the GAP-Harran
Plain, Şanlıurfa, Turkey
Hatice Parlakçı Doğan 1 , Mustafa Hakkı Aydoğdu 1 , Mehmet Reşit Sevinç 2, *                and
Mehmet Cançelik 3
 1    Department of Agricultural Economics, Faculty of Agriculture, Harran University, 63050 Şanlıurfa, Turkey;
      hparlakcidogan@yahoo.com (H.P.D.); mhaydogdu@hotmail.com (M.H.A.)
 2    Department of Bozova Voc. Sch., Harran University, 63850 Şanlıurfa, Turkey
 3    Department of Social Science Voc. Sch., Harran University, 63200 Şanlıurfa, Turkey;
      m.cancelik@harran.edu.tr
 *    Correspondence: rsevinc@harran.edu.tr; Tel.: +90-414-3183749

 Received: 27 March 2020; Accepted: 29 April 2020; Published: 4 May 2020

 Abstract: Sustainable agriculture is necessary for farmers to have a sustainable income. This research
 aims to determine the willingness to pay (WTP) of farmers in the GAP-Harran Plain for services
 that would ensure sustainable agricultural income, the factors affecting their willingness, and the
 minimum amount they would be willing to pay. The main material of the research has been obtained
 by means of face-to-face surveys involving farmers selected by a simple random sampling method
 in the GAP-Harran Plain. The sampling volume was determined with a 95% confidence limit
 and a 5% error margin. Heckman’s two-stage model was used for the analysis. According to the
 results of the research, 22.61% of the participants showed WTP, and the average amount they were
 willing to pay was 180.82 TL/hectare (ha) ($31.86/ha). This amount was 3.08% of the average annual
 agricultural income calculated. About 41.22% of the participants showed no WTP. They believed
 that the public sector is accountable of the services and consequently, they should be provided free
 of charge. About 23.14% of the participants showed WTP only for the services that they needed.
 The average WTP for all participants was calculated as 40.9 TL/ha ($7.21/ha) and 1.2 million $/year
 for the GAP-Harran Plain. This amount is the minimum and may increase by several folds with
 a demand-based variety of service delivery. The factors that statistically effect WTP have been
 determined as age, education, experience, number of households working in agriculture, amount of
 land, agricultural income, non-agricultural income, membership status of agricultural cooperatives,
 and product pattern. The results provide useful information to guide researchers, decision-makers,
 and policy-makers.

 Keywords: sustainable agricultural income; agricultural service provision; WTP; GAP-Harran Plain;
 Şanlıurfa-Turkey

1. Introduction
     Agriculture has of great importance to all countries to meet their food needs. Agricultural
production, which is the main source of life, faces sustainability problems due to various reasons.
Agricultural production is a source of rural livelihood and employment, and it is becoming more
important as a driving force for rural economic growth and poverty reduction in developing
countries [1]. For sustainable agriculture, farmers must obtain sustainable satisfactory income
from their production [2]. According to the Global Risks Report of 2018, the five most serious global
risks that may occur are weapons of mass destruction, extreme weather events, natural disasters,

Agriculture 2020, 10, 152; doi:10.3390/agriculture10050152                      www.mdpi.com/journal/agriculture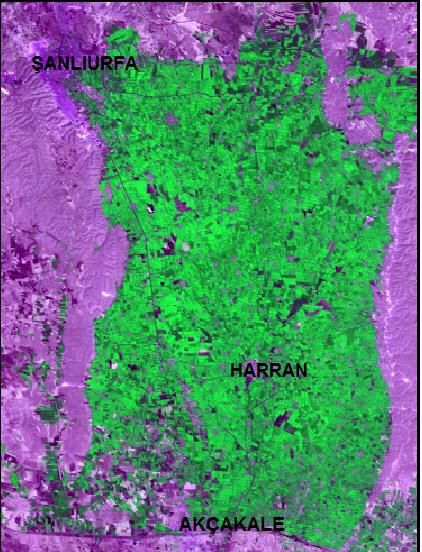
Agriculture 2020, 10, 152                                                                           2 of 16

migration and adaptation problems due to climate change, and water crises [3]. Almost all of these
five global risks are directly related to agriculture and food safety issues and threaten sustainable
agricultural activities. On the other hand, it cannot be said that decision-makers pursue adequate,
rapid, and effective measures against these risks. To be able to meet the global food demand in
2050, agricultural production should be increased by 60% more than in 2005–2007 [4]. In addition to
natural disasters such as climate change and drought, human activities such as intensive agricultural
production have worsened the sustainability problems [5]. Despite the rapidly increasing world food
demand, the possibility of expanding agricultural production areas is quite limited. Even in many
countries, agricultural lands are gradually decreasing [6]; globally, more than 10 million ha of land
continue to deteriorate annually [7] and more pressure is put on the rest of the agricultural production
areas. On the other hand, deliberate practices have been made to increase the quantity of products
from a unit area have resulted in some problems, too. The widespread use of synthetic chemicals
for uncontrolled irrigation, frequent tillage, fertilization, and pesticides to increase yield for crop
production and income in the early years [8,9]. However, later on, depending on the structure and
topography of the cultivated land, these practices started to affect the production area, yield, produce,
ecology, environment, and natural resources negatively in the medium and long term [10,11]. Besides,
the relationship between pesticides, fertilizers, and hormones which are used in agricultural practices
and increasing health problems have has been increasingly discussed [10,12].
     Sustainable agricultural income is the income that farmers and their families obtain by using
agricultural resources to provide their livelihood in the rural areas and to be at the welfare standards
of the society in which they live for today and cover future needs. As a result of uncontrolled natural
events, the income of farmers can fluctuate from year to year, and in the years when the product
to provide sufficient income cannot be bought, farmers are worried about their livelihoods [13,14].
While the increase in sustainable agricultural income basically will have positive effects on food
security, employment, raw materials for other sectors, and at most on rural development targets.
This situation positively affects the farmer’s tendency to remain in agriculture and to continue
agricultural production [14]. In the case of a decrease in income, while the positive effects due to
the increase will be negative, it will create negative pressures on social welfare, and migration from
rural to urban. In this case, agricultural lands cannot be cultivated sufficiently and agricultural areas
remain idle [15]. Accordingly, production amounts will decrease in rural areas, prices will increase,
and pressure on public financing will increase both in rural and urban areas. At this point, those who
do not have experience in working outside the agriculture sector and have low education levels cannot
keep up with the rapid developments in information and technology, must either find a job in the
marginalized sector or increase urban unemployment rates [16]. These results will cause to loss of
welfare of the society. Sustainable agriculture includes systems and practices that lead to increased
and diversified food production, with healthy, sufficient, and quality quantities at affordable costs;
boost the economic viability of agriculture; and enhance the protection of the environment and natural
agricultural areas, as well as the welfare of farmers and society [17]. Therefore, it becomes important to
ensure food safety and to support the sustainable management of ecosystems, soil, water, and natural
resources [4]. With sustainable agriculture, it is possible to obtain optimal yields from production
areas, positively affect ecology, provide an additional contribution to production, and find solutions to
food and employment problems. Sustainable agricultural income can be obtained through sustainable
use of agricultural resources based on optimum usage principles [18]. Farmers generally make up
the least educated part of the community in which they live [19]. Farmers need to be informed at all
stages of agricultural activities, from production to marketing, for efficient, effective, and sustainable
use of resources. Agricultural sustainability covers issues such as climate change, flood, drought,
unexpected natural events, river basin system, ecosystem, environmental ecology, irrigation water,
protection of agricultural land, advanced technologies, climate change, drought-resistant seeds, etc.
Effective needs-oriented services that include policies, compliance policies that have been adapted
by the public or private sector, are necessary for local conditions. The adoption of service delivery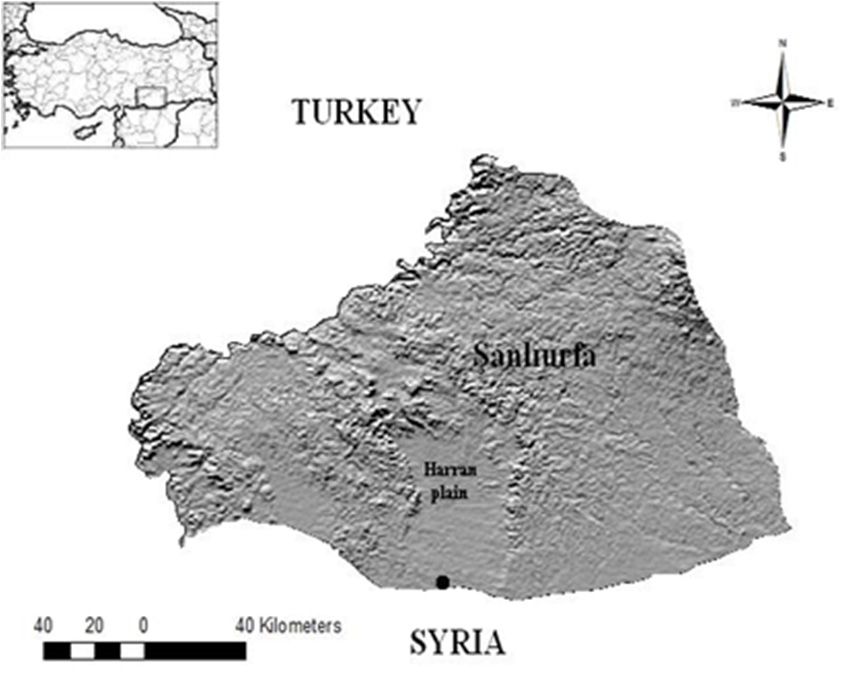
Agriculture 2020, 10, 152 3 of 16
practices for sustainable agricultural income leads to a sustainable provision of agricultural activities
and significantly contributes to a reduction in agricultural concerns. The responsibility here is not
only the public sector’s but also the private sector and farmers also have responsibilities. In a study
of EU countries, it is stated that producers—i.e., farmers—have responsibilities in the context of
sustainable development [20]. These responsibilities cover not only the planning and participation
dimensions but also the sharing of costs. While this is important to all countries, it is most important
to developing countries. Therefore, it is vital to evaluate the participation of farmers in the valuation of
services for sustainable agricultural income and to reveal the factors affecting this participation and its
economic dimension.
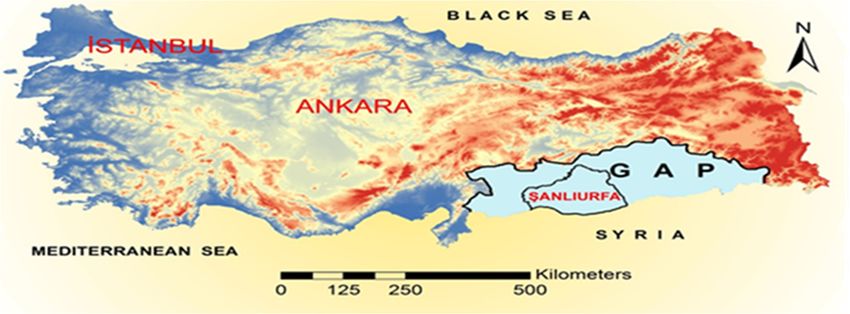
The Southeastern Anatolia Project (GAP) is the most important integrated sustainable regional
development project in the history of the Republic, aiming to increase the sustainable income and
welfare of the people of the region. The project aims to activate the agricultural potential of the
region based on water and soil resources. Şanlıurfa is the most important agricultural city of the GAP
Region and the Harran Plain is the most important plain of the project. The expected increase in
agricultural production and the income of farmers, both in Şanlıurfa and in the Harran plain, has not
been sufficiently achieved due to many reasons and one of them is lack of detailed field survey based
on the needs and attitudes of farmers.
The aim of this research is to determine the attitudes of farmers in the GAP-Harran Plain to accept
payment for service supplies that will provide sustainable agricultural income. Also, the affecting
factors on these attitudes of the farmers, and their willingness to pay (WTP) with the payment amount
of Turkish liras per hectare for these services were investigated. This research is the first of its kind
in the GAP Region in this context. The farmers’ WTP amount for service delivery for sustainable
agricultural income in the GAP-Harran plain was calculated for the first time with this research. In this
sense, the results of this study provide useful data and information that will constitute a basis for
other studies both in other regions of Turkey which is a lack of this subject until now and also in other
countries with the same socio-economic similarities.
2. Literature Review
In the literature-based studies given below, in essence, farmers’ WTP on various topics for
sustainable agricultural activities has been investigated. This situation is also necessary for sustainable
agricultural income. Therefore, it is assumed that it is also valid in sustainable income. Because the main
source of sustainable income in agriculture is a sustainable agricultural environment and activities.
In a study on sustainable agriculture conducted in Oklahoma, USA, economic analysis of
drought-resistant crop cultivation strategies was carried out to reduce the effects of climate change
on agricultural production. It has been determined that farmers are concerned about crop types,
productivity, and marketing, and that culture affects their WTP on sustainable agriculture [21]. A study
conducted in Tanzania focused on the importance of advanced technologies adapted to local conditions
for farmers under sustainable agricultural policies. However, it is not clear which factors affect the
willingness and demands of small-scale farmers for such technologies. An improved agricultural
extension service, besides seeds and fertilizers have been effective in increasing the WTP on sustainable
agricultural policy based on the income of the farmers [22]. In a study conducted in Wuhan, China, it was
determined that farmers are not satisfied with the ecological environment of existing agricultural lands,
which affects sustainability, and that they express a WTP to protect agricultural lands. The research
proposed the importance and necessity of factoring in WTP in policies on the protection of agricultural
land for an income of sustainable farming [23].
In a study conducted in Şanlıurfa, GAP, Turkey, farmers’ WTP was determined as $48.8/ha for
sustainable use of resources for sustainable income. The factors affecting WTP were determined
as the location of farmers, the number of agricultural manpower available for a given household,
quantity of land and ownership status, and the income derived from agriculture [24]. In a study
conducted in Inner Mongolia of China, the participants’ WTP for ecosystem protection was determinedAgriculture 2020, 10, 152 4 of 16
as $25.11. The effective factors that determined the WTP were age, education, household income,
and sustainability concerns about the income. Younger and more educated respondents had higher
WTP, as well as those who were concerned about protection [25]. In a study conducted in Upper
Hun River Basin, Northeast China, it was found that large losses were experienced as a result of the
degradation of the basin ecosystem due to socio-economic activities of human origin. Emphasizing the
importance of the protection and sustainability of the basin, a WTP of $3.2 million was calculated for
preventing income losses at the basin [26]. In a study on watershed management in Ethiopia, the WTP
was determined to reduce land degradation in 90% of rural residents, with an emphasis on sustainable
use of farming lands for income [7].
Agriculture 2020, 10, x FOR PEER REVIEW 4 of 16
In Taiwan, farmers’ WTP for meteorological information services for safe agricultural production
activities are determined
of the degradationasof$56.06 to $90.92
the basin ecosystem forduesafetoofsocio-economic
income. One of the of
activities factors
humanaffecting
origin. WTP is
the acreageEmphasizing
of the land the[27].
importance
In West of the protection
Java, Indonesia,and sustainability
smallholder of the basin, a WTP
farmers haveofWTP $3.2 million
of $2.67/ha for
was calculated for preventing income losses at the basin [26]. In a study on watershed management
agricultural insurance and sustainable agricultural production based on the risk of climate change.
in Ethiopia, the WTP was determined to reduce land degradation in 90% of rural residents, with an
The quantity of land,
emphasis expectation
on sustainable use ofbased
farmingon crop
lands for pattern,
income [7].and agricultural extension services were
determined as In theTaiwan,
effective factorsWTP
farmers’ [28].forIn ameteorological
study conducted in Greece,
information it was
services for found that farmers have
safe agricultural
production activities are determined as $56.06 to $90.92 for
the WTP for sustainable agricultural irrigation based on income [29]. A study carried safe of income. One of the factors affecting
out in South
WTP is the acreage of the land [27]. In West Java, Indonesia, smallholder farmers have WTP of
Korea also found that participants had WTP for sustainable integrated agricultural productions [30].
$2.67/ha for agricultural insurance and sustainable agricultural production based on the risk of
In anotherclimate
studychange.
by theThe same author,
quantity of land,demographic
expectation based data were
on crop found
pattern, andtoagricultural
be influential
extension factors that
determine services
WTP for werefarming
determined[31].as the effective factors [28]. In a study conducted in Greece, it was found
that farmers
In a study on the have the WTP River
Ganjiang for sustainable
Basin, agricultural
China, the irrigation
importancebased onofincome [29]. Athe
protecting study river basin
carried out in South Korea also found that participants had WTP for sustainable integrated
ecosystem for sustainable use was noted. It was stated that this protection should not only be left for
agricultural productions [30]. In another study by the same author, demographic data were found to
the government but those
be influential factors other stakeholders
that determine WTP should
for farmingbe [31].
involved in the planning without being ignored.
Using Heckman’s In a two-stage
study on themodel,Ganjiangparticipants’
River Basin, China,WTP the was calculated
importance as $47.62the
of protecting forriver
sustainable
basin use of
ecosystem for sustainable use was noted. It was stated that this protection
the ecosystem. The effective factors were found to be the level of education, nature of work, water should not only be left for
the government but those other stakeholders should be involved in the planning without being
quality, and quantity [32]. In a study conducted in Uganda, 89% of farmers were found to have a
ignored. Using Heckman’s two-stage model, participants’ WTP was calculated as $47.62 for
WTP for sustainable
sustainable use agricultural activities
of the ecosystem. for sustainable
The effective income.
factors were found to be The most
the level important
of education, factors were
nature
determined of as land
work, ownership
water quality, andtype, land
quantity quantity,
[32]. In a studyand income
conducted [33]. 89% of farmers were found
in Uganda,
to have a WTP for sustainable agricultural activities for sustainable income. The most important
3. factors
Materials andwere determined as land ownership type, land quantity, and income [33].
Methods
3. Materials and Methods
3.1. Research Area
Turkey3.1.isResearch
divided Area
into seven geographical regions. Southeastern Anatolia Region, despite having
the most water and landdivided
Turkey is into is
resources, seven geographical
the second regions. least
of Turkey’s Southeastern Anatolia
developed. TheRegion,
regiondespite
has a semi-arid
having the most water and land resources, is the second of Turkey’s least developed. The region has
climate [34]. Also, this region has geopolitical importance due to the creation of Turkey’s border
a semi-arid climate [34]. Also, this region has geopolitical importance due to the creation of Turkey’s
with Syriaborder
and Iraq. Its main
with Syria source
and Iraq. of source
Its main livelihood is agriculture
of livelihood and
is agriculture andagriculture-based industry [35].
agriculture-based industry
The Southeastern
[35]. TheAnatolia Project
Southeastern (for Project
Anatolia which (for
the Turkish
which theacronym is GAP)isisGAP)
Turkish acronym the most
is thecomprehensive
most
comprehensive
and costliest and costliest
project in Turkey, whichproject
is in Turkey,in
located which is located in at
the southeast thethe
southeast at the Euphrates–
Euphrates–Tigris basin in the
Tigris basin in the plains of Upper Mesopotamia. The GAP project covers about 11% of Turkey in
plains of Upper Mesopotamia. The GAP project covers about 11% of Turkey in terms of land area and
terms of land area and population [36]. The location of Şanlıurfa, GAP, and Turkey is given in Figure
population1 [36].
[24]. The location of Şanlıurfa, GAP, and Turkey is given in Figure 1 [24].
Figure
Figure 1. 1. Turkey,GAP,
Turkey, GAP, and
andŞanlıurfa.
Şanlıurfa.Agriculture 2020, 10, 152 5 of 16
Agriculture 2020, 10, x FOR PEER REVIEW 5 of 16
The main objectives of GAP are to increase the income level and life quality of the local people by
The main objectives of GAP are to increase the income level and life quality of the local people
utilizing the water and soil resources of the region, to eliminate the development gap between this
by utilizing the water and soil resources of the region, to eliminate the development gap between this
region and other regions, to increase productivity and employment opportunities in the rural area,
region and other regions, to increase productivity and employment opportunities in the rural area,
and to contribute to economic development and social stability goals at the national level. Within the
and to contribute to economic development and social stability goals at the national level. Within the
scope of the project, there are 22 dams, 19 HEPPs, and 1.8 million ha of irrigation areas, with a project
scope of the project, there are 22 dams, 19 HEPPs, and 1.8 million ha of irrigation areas, with a project
budget of $32 billion [36].
budget of $32 billion [36].
Harran Plain is the most important plain in the Southeastern Anatolia Region, which is located
Harran Plain is the most important plain in the Southeastern Anatolia Region, which is located
in Şanlıurfa. Harran Plain has an area of 151.7 thousand ha, and the first irrigations in relation to
in Şanlıurfa. Harran Plain has an area of 151.7 thousand ha, and the first irrigations in relation to GAP
GAP started in an area of 30 thousand ha in 1995 (Figure 2); today, the entire plain is under irrigated
started in an area of 30 thousand ha in 1995 (Figure 2); today, the entire plain is under irrigated
agriculture. The acreage of the irrigated area, including the Upper Harran irrigated area which is just
agriculture. The acreage of the irrigated area, including the Upper Harran irrigated area which is just
above the Harran Plain since 2005, is around 166 thousand ha. Harran Plain has 88.5% gravity and
above the Harran Plain since 2005, is around 166 thousand ha. Harran Plain has 88.5% gravity and
11.5% pressurized irrigation. While there is excessive use of water in the upper parts of the plain,
11.5% pressurized irrigation. While there is excessive use of water in the upper parts of the plain,
there is water failure in the lower parts towards the south. While this creates a risk of salinity in the
there is water failure in the lower parts towards the south. While this creates a risk of salinity in the
upper parts, it creates a drought effect in the lower parts. In both cases, yield and income loss occur in
upper parts, it creates a drought effect in the lower parts. In both cases, yield and income loss occur
agricultural production [37,38].
in agricultural production [37,38].
(a) (b)
Figure2.2.Şanlıurfa
Figure Şanlıurfaand
and Harran
Harran Plain:
Plain: (a) places
(a) the the places of Şanlıurfa
of Şanlıurfa and Harran
and Harran Plain inPlain in (b)
Turkey; Turkey; (b)
irrigated
irrigated
area of thearea of the
Harran Harran
Plain PlainProf.
(Source: (Source: Prof. Dr.Ali
Dr. Mehmet Mehmet
Çullu,Ali Çullu,
Harran Harran University).
University).
3.2.
3.2. Materials
Materials
The
The research
research was
was based
based onon primary
primary sources
sources of of data.
data. The
The main
main material
material of of this
this research
research was
was
obtained
obtained from
from face-to-face
face-to-face surveys
surveys of of farmers
farmers inin the
theGAP-Şanlıurfa-Harran
GAP-Şanlıurfa-Harran plain. plain. The
The number
number ofof
farmers registered in the state farmer registration system on the Şanlıurfa-Harran Plain
farmers registered in the state farmer registration system on the Şanlıurfa-Harran Plain was 15,824 in was 15,824 in
2019.
2019. Farmers
Farmerswere
wereselected
selectedbybya simple
a simple random
random sampling
sampling method, using
method, the sample
using the samplevolume tabletable
volume [39],
with
[39], awith
95% confidence limit andlimit
a 95% confidence a 5%and
margina 5%of error.
margin Theofsample
error. size
The was 376 and
sample size 379
wasquestionnaires
376 and 379
were
questionnaires were used in the analyses. The surveys were conducted in 2019. The surveysquestions
used in the analyses. The surveys were conducted in 2019. The surveys included included
to measuretothe
questions willingness
measure of the farmers
the willingness of thetofarmers
pay fortosustainable agricultural
pay for sustainable income, the
agricultural farmers’
income, the
demographic and socio-economic characteristics, and their ability to pay.
farmers’ demographic and socio-economic characteristics, and their ability to pay.
3.3. Methods
3.3. Methods
During the research, zero observation was obtained because some participants did not want to
During the research, zero observation was obtained because some participants did not want to
participate in the payment of services that would enhance sustainable agriculture. Estimation of the
participate in the payment of services that would enhance sustainable agriculture. Estimation of the
model, with the data showing zero observation, would have caused the deviation of the coefficient
model, with the data showing zero observation, would have caused the deviation of the coefficient
estimates, and since estimating the model by removing zero observation would also have caused
estimates, and since estimating the model by removing zero observation would also have caused
inconsistency. This situation is known as the sample selection deviation. The two-stage estimation
inconsistency. This situation is known as the sample selection deviation. The two-stage estimation
method was used to eliminate sample selection deviation [40]. In the Heckman model, using probit
method was used to eliminate sample selection deviation [40]. In the Heckman model, using probit
instead of logit in the first stage and using the ordinary least square (OLS) instead of other models in
the second stage eliminates errors [41]. Several papers use this model to estimate WTP avoiding theAgriculture 2020, 10, 152 6 of 16
instead of logit in the first stage and using the ordinary least square (OLS) instead of other models in
the second stage eliminates errors [41]. Several papers use this model to estimate WTP avoiding the
problem of selection bias. This research was modeled in two stages to determine the participants’ WTP
for sustainable agricultural income and the factors that affect the WTP amount, for those who agreed
to pay. Heckman’s two-step model was used in the analysis by using the probit model at the first stage
and OLS in the second stage. Heckman correction is a statistical method applied to correct the errors in
randomly selected samples or randomly truncated dependent variables [42]. Heckman correction is
a two-step statistical approach. Here, a two-step prediction method is used to correct bias resulting
from the use of non-randomly selected samples to predict behavioral relationships as a specification
error [43,44].
Due to the two-stage nature of the research, Heckman’s two-stage estimation method was applied
to the data. The first step of the method involved using a typical binary selection probit model to
determine whether farmers were willing to pay for sustainable agricultural income or not. The model
can be written for the first stage as [32,45,46]
P(0, 1) = β0 + β1 X1 + β2 X2 + . . . .+βn Xn + εi (1)
P represents the declared variable; if the participant was willing to pay, it is shown as 1, if not, it is
indicated with 0. β0 is constant, β0 . . . βn represent the regression coefficients of variables, X1 . . . Xn
represent the explanatory variables, and εi represents the error term.
The second stage of the model is the ordinary least square (OLS) approach, which tries to explain
the factors affecting the payment levels if the farmers show WTP for sustainable agricultural income.
The model can be written as follows for the second stage [32,45,46].
Yi |Pi0 = β0 + β1 X1 + β2 X2 + . . . .+βn Xn + βn+1 λ + εi (2)
Yi represents the declared variable, i.e., the level of WTP of the participants, β0 is constant, β0
. . . βn represent the regression coefficients of variables, X1 . . . Xn represent the explanatory variables,
and εi represents the error term. In Equation (2), λ (lambda) represents the Mills ratio. Several papers
use this model to estimate WTP avoiding the problem of selection bias. Detailed information about the
model used in this research is available in the studies of Heckman, 1976, Heckman, 1979; Amemiya,
1985; Newey et al., 1990; Winship and Mare, 1992; Nawata, 1994; Puhani, 2000; Lee, 2001; Cameron
and Trivedi, 2005; Toomet and Henningsen, 2008; Cameron et al., 2010; Xiong, et al., 2018; Kyaw, 2018;
Xiong, 2019 [32,42,43,45–54].
4. Results and Discussion
4.1. Research Findings
The surveys involved only male farmers due to the patriarchal structure of the research area.
The research area is generally conservative, with a tribal structure and a sense of belonging. Norms and
region-specific cultural values predominate [55]. For example, the oldest one in the family and the
chief of the tribe are always the final decision-makers, even about the approval or rejection of marriage
decisions, who are men. Young people in the region are mostly uncomfortable with this situation and
often prefer urban life when they have the opportunity. Because young people are more educated and
open-minded than the final decision-makers although they mostly do not approve of tribal decisions,
they show consent due to their sense of belonging [56]. Therefore, they have more opportunities to
implement their own decisions and income and freedom in city life. Except for the spouses of the
oldest and the chief of the tribe, women do not have much say. Early age marriage is common among
women, on the other hand, divorce is not a situation that is approved and welcomed. Education levels
are generally low, especially among women [15]. The government has been implementing several
policies for the positive development of the socio-economic structure of the region.Agriculture 2020, 10, 152 7 of 16
Cotton is a product of strategic importance, both in Şanlıurfa and all over Turkey [6,57–59]. Of the
81 provinces in Turkey, 6 of them produce 85% of the total cotton in Turkey. Şanlıurfa is the top cotton
producer province of Turkey, with 40% of the total production happening in the researched area [59].
Cotton is known as white gold in Şanlıurfa. The variables used in this research were selected depending
on the socio-economic characteristics of the research area. Of all the participants, 94.9% were married,
2.9% were single, and 2.2% were widowed. In 2019, on average, $1 was 5.676 TL (Turkish lira) [60].
The descriptive statistics of the participants are given in Table 1.
Table 1. Descriptive statistics of the participants.
Variable Definition Mean Std. Dev
If the age of the farmer; between 18–30 is 1 (6.6%), if between 31–40 is 2
Age (27.17%), if between 41–50 is 3 (31.4%), if between 51–60 is 4 (21.11%), 61 3.082 1.1367
and over is 5 (13.72%).
If the farmer is literate 1 (13.72%), primary school graduate 2 (47.76%),
Education middle school graduate 3 (15.57%), high school graduate 4 (13.98%), 2.567 1.1581
university graduate 5 (8.97%).
If the farmer’s experience is 1 (16.62%) for 1–10 years, 2 (31.93%) for
Experience 2.610 1.0467
11–20 years, 3 (25.33%) for 21–30 years, 4 (26.12%) for 31 years and over.
The number of households of the farmer is 1 (15.3%), if, between 1–4, 2
Household number 2.161 0.6651
(53.3%) if between 5–9, and 3 (31.4%) if 10 and over.
Number of
The number of households working in agriculture is 1 (69.69%), if,
household working 1.522 0.7137
between 1–4, 2 (26.39%) if between 5–9, and 3 (12.92%) if 10 and over.
in agriculture
If the amount of land cultivated by the farmer is 5 ha and less is 1
Land Amount (23.75%), between 5.1–10 ha is 2 (26.65%), 10.1–20 ha is 3 (23.48%), 20.1 2.520 1.1118
ha and over is 4 (26.12%).
If the farmer’s cultivated land is his own property 1 (58.58%) and if the
Property Type 0.586 0.4932
tenant and/or partnership is 0 (41.42%).
If the agricultural annual net income of the farmer; 25,000 TL and less is
Income 1 (22.96%), if between 25,001–50,000 TL is 2 (21.11%), if between 2.636 1.1429
50,001–100,000 TL is 3 (25.33%), and if 100,001 and over is 4 (30.6%).
Non-agricultural If the farmer has non-agricultural income is 1 (12.93%), if not is 0
0.129 0.3359
income (87.07%).
Membership of
If the farmer has a membership of any agricultural cooperative is 1
agricultural 0.227 0.4194
(22.69%), if there is no membership is 0 (77.31%).
cooperatives
If the farmer only cultivates cotton is 1 (51.98%), if only wheat is 2
Crop pattern 1.902 0.9669
(5.8%), if mixed crop (cotton, wheat, corn, and barley) is 3 (42.22%).
Participants were asked about their WTP for services needed to generate sustainable agricultural
income. The results are given in Table 2.
Table 2. Results of the participants’ WTP for services to generate sustainable agricultural income.
Annual Average Annual Average
WTP for Average WTP Average WTP
Ratio (%) Agricultural Income Agricultural Income
Services (TL/ha) ($/ha)
(TL/ha) ($/ha)
Those who do
41.22 5552.81 978.29
not accept
In favor
22.61 5875.23 1035.09 180.82 31.86
of—accepted
Conditionally
23.14 5498.87 968.78
in favor of WTP
Have enough
knowledge—not 13.03 5706.76 1005.41
accepted
Average value 5668.87 998.74 40.9 7.21Agriculture 2020, 10, 152 8 of 16
According to the responses received, the amount declared by those who have WTP is 3.08% of
their annual average agricultural income. The farmers who showed no WTP perceived these services
as public services and it was believed that it should be provided free of charge. The farmers who had
understood the importance of sustainable agriculture for a regular income showed themselves to be
conditionally in favor of WTP if there was a service that they needed which satisfied their demands.
Heckman’s first-stage model results regarding the willingness of the surveyed farmers to pay for
sustainable agricultural income are given in Table 3, where Pseudo-R2 was calculated as the measure
of goodness of fit in the model and its value is 18%. This value is an indicator of the effectiveness of the
variables in the model in explaining the dependent variable. Heckman’s second-stage model results
are given in Table 4. Wald chi-square value of the model is calculated as 64.14 and p-value as 0.000.
We see from these results that the model was statistically significant as a whole. Besides, the Mills rate
is meaningless (p > 5%). It can be concluded, from the statistical values, that there is no selection bias
in the model. Therefore, the results obtained are reliable.
Table 3. Heckman’s first-stage model (Probit model/selection model) estimation results.
Variable Sub-Groups Coef. Std. Err. Z p > |z|
31–40 0.572 0.447 1.28 0.201
Age (year) 41–50 0.927 b 0.457 2.03 0.043
51–60 0.706 0.486 1.45 0.147
61 and over 0.651 0.523 1.25 0.213
Primary School 0.097 0.256 0.38 0.704
Secondary School 0.166 0.312 0.53 0.593
Education (level)
High School 0.541 c 0.315 0.71 0.087
University 0.774 b 0.365 2.12 0.034
Between 11–20 0.319 0.264 1.21 0.228
Experience (year) Between 21–30 0.159 0.296 0.54 0.591
31 and above 0.155 0.312 0.50 0.619
Between 5–9 0.015 0.245 0.06 0.951
Household (person)
10 and above 0.059 0.301 0.20 0.843
Working in Between 5–9 0.331 c 0.196 1.68 0.093
agriculture (person) 10 and above −0.152 0.306 −0.50 0.619
Between 5.1–10.0 0.700 b 0.288 2.43 0.015
Land amount
Between 10.1–20.0 0.804 a 0.307 2.62 0.009
(hectare)
20.1 and above 0.643 b 0.317 2.03 0.043
Land ownership type Not own property −0.179 0.157 −1.14 0.255
Between 25,001–50,000 0.426 0.282 1.51 0.131
Income (TL) Between 50,001–100,000 0.336 0.278 1.21 0.226
100,001 and above 0.510 c 0.289 1.76 0.078
Non-agricultural
No 0.557 b 0.236 2.36 0.018
income
Agricultural
cooperative No 0.434 b 0.182 2.38 0.017
membership
Cotton 0.012 0.186 0.07 0.946
Crop type
Wheat −0.593 0.373 −1.59 0.112
Constant −2.844 a 0.588 −4.83 0.000
LR chi-square = 80.71 Prob > chi-square = 0.000 Pseudo R2 = 0.180
The reference groups of variables: those between “18 and 30” for age, “literate” for education, “1–10” for
experience, “1–4” for households, “1–4” for agricultural workers, “5 ha and less” for land amount,
“property owner” for land ownership type, “25,000 and under” for income, “yes” for non-agricultural
income, “yes” for agricultural cooperative membership, “mixed” for crop type are taken as a basic level for
the reference group.
a,b,c Orderly indicates the degree of the statistical significance level of 0.01, 0.05, and 0.10.Agriculture 2020, 10, 152 9 of 16
Table 4. Heckman’s second-stage model (OLS model/payment model) estimation results.
Variable Sub-Groups Coef. Std. Err. Z p > |z|
31–40 14.175 18.131 0.78 0.434
41–50 26.720 19.770 1.35 0.177
Age (year)
51–60 24.933 19.881 1.25 0.210
61 and above 30.477 20.185 1.51 0.131
Primary School 8.431 7.962 1.06 0.290
Secondary School 23.542 b 9.500 2.48 0.013
Education (level)
High School 28.966 b 11.712 2.47 0.013
University 24.880 c 14.203 1.75 0.080
Between 11–20 2.862 10.374 0.28 0.783
Experience (year) Between 21–30 −5.224 10.638 −0.49 0.623
31 and above −2.143 10.525 −0.20 0.839
Between 5–9 −13.059 c 7.240 −1.80 0.071
Household (person)
10 and above −22.759 a 8.431 −2.70 0.007
Working in Between 5–9 16.725 b 7.082 2.36 0.018
agriculture (person) 10 and above 13.435 9.530 1.41 0.159
Between 5.1–10.0 25.328 c 15.379 1.65 0.099
Land amount
Between 10.1–20.0 43.469 b 17.118 2.54 0.011
(hectare)
20.1 and above 37.729 b 15.687 2.41 0.016
Land ownership type Not own property −14.224 a 5.211 −2.73 0.006
Between 25,001–50,000 16.865 10.836 1.56 0.120
Income (TL) Between 50,001–100,000 4.218 10.868 0.39 0.698
100,001 and above 3.206 11.915 0.27 0.788
Non-agricultural
No 10.992 9.286 1.18 0.237
income
Cotton −16.153 a 4.996 −3.23 0.001
Crop type
Wheat −18.923 13.710 −1.38 0.168
Constant −54.345 58.283 −0.93 0.351
lambda 22.783 18.178 1.25 0.210
rho 0.880
sigma 25.887
Number of obs = 379 Censored obs = 274 Uncensored obs = 105 Wald chi2 (25) = 64.14 Prob > chi2 = 0.000
a,b,c Orderly indicates the degree of the statistical significance level of 0.01, 0.05, and 0.10.
Table 4 shows the relationship between the factors that affected the payment level of the variables
used in the model and their subgroups.
4.2. Discussion
According to the model results in Table 3, there was a statistically significant relationship between
the independent variables—which were age, education, experience, the number of households working
in agriculture, the quantity of land, agricultural income, non-agricultural income, membership status
in agricultural cooperatives, and the crop pattern—and sustainable agricultural income, which as a
variable was dependent on the WTP of the farmers.
The average age of the participants was 46.73 years. Young farmers between 18 and 30 years
old were taken as the reference in the age variable groups. A statistically significant relationship
was detected on the farmers between 41 and 50 years of age, with a significance level of p < 5%.
However, a study conducted in China found out that young people showed more WTP for income
derived sustainable ecosystem [25]. In another study conducted in South Korea, it was found that the
demographic data of farmers effectively determined the WTP for integrated agricultural production [31].
Literate farmers were taken as the reference in the education variable groups. There was a
statistically significant relationship at high school graduates, and university graduates. This significance
level was p < 10% for high school graduates and p < 5% for university graduates. The participationAgriculture 2020, 10, 152 10 of 16
of adult individuals in education has been found to be inversely proportional to the need for
training. As the level of education increases, individuals’ willingness to learn more increases, too [2].
An individual with a high level of education needs less information but the demand for knowledge is
high. Because of the increase in the level of knowledge, the individual would be motivated to learn new
things [61]. A study conducted in Oklahoma, USA found that culture is an effective determinant of
the WTP for a sustainable ecosystem system [62]. Again, another study in China found that educated
people showed more WTP for income derived from a sustainable ecosystem [25].
The average farming experience of the participants was determined as 24.77 years. Farmers
with between 1 and 10 years’ experience were taken as the reference in the experience variable
groups. However, no statistically significant relationship was detected at any of the subgroups
(p > 10%). The average household was 8.15 people. Households with between 1 and 4 people were
taken as the reference group. As the household increased, concerns about sustainable income also
increased. This was as a result of the prevailing conditions for agricultural production, since agricultural
production depends on natural conditions, climate, and soil. However, no statistical significance was
determined (p > 10%).
On average, 4.80 people of each household work in agriculture. Households with between 1 and 4
people working in agriculture were taken as the reference group for the number of people working in
agriculture. There was a statistical relationship on households between 5 and 9 working in agriculture.
The significance level was determined as p < 10%. There was a negative relationship on households
with 10 or more people working in agriculture, a result that is remarkable and unpredictable. In such a
family with over 10 members working in agriculture, the labor force can be a work not only on their
own family farms but also for other households for a fee. Thus, participants from these families had
extra sources of income. Similar results were obtained in another study conducted in the same region
about sustainable use of natural resources [24].
The average land size of each participant was 19.5 ha. Landowners of 5 ha and below were taken
as the reference group for the land amount variable. A statistically significant relationship was detected
between all subgroups. This significance was determined as p < 5% for the 5.1 to 10 ha and 10.1 to
20 ha subgroups, and p 10%). In another study conducted in Uganda, it was determined
that land ownership type was an effective factor for WTP for sustainable agricultural activities for
sustainable income [33].
The average annual agricultural income of each participant was calculated as 110,543 TL ($ 19,476).
An annual income of 25 thousand TL and below was taken as the reference for the income variable.
There was a statistically significant relationship in the group of an annual income of over 100 thousand
TL at a significance level of p < 10%. As the level of income rose, there was an increased likelihood of
individuals willing to pay more to sustain the same level of income [61]. In a study conducted in Iran,
farmers’ income was identified as the most important factor affecting WTP for sustainable agriculture
and to reduce flood risk due to climate for a safe income [63]. In other studies, it was determined thatAgriculture 2020, 10, 152 11 of 16
income was an effective factor for WTP for sustainable agricultural environment and activities for
sustainable income [24,25,33].
On average, 0.85 person of each household worked outside agriculture. The average annual
income of participants from non-agricultural sources was calculated as 4584 TL. Those who have
non-agricultural income was taken as the reference group. There was a statistically significant
relationship, with the level of p < 5%. A study conducted in Kenya found that non-agricultural income
has a positive effect on farmers’ access to sustainable irrigation for more income [64].
Membership of agricultural cooperatives was taken as the reference group in the membership
variable. There was a statistically significant relationship with the level of p < 5%. Membership of a
cooperative protects a farmer safe, with regard to income, and gives the farmer a sense of solidarity.
In Şanlıurfa, the sense of belonging that comes with membership of agricultural cooperatives is evident
among farmers [65]. Member farmers enjoy some privileges but non-members do not, which may
come as input supply, marketing, etc. In this sense, the result is consistent. In a study conducted in
northern Italy, it was determined that the membership by farmers of farmer organizations was an
effective factor for the production of sustainable olive oil [66].
Farmers who practiced mixed cropping (cotton, wheat, corn, barley, etc.) were taken as the
reference group in the crop type variable. No statistically significant relationship was detected on
any other subgroup in the crop type variable (p > 10%). In another study conducted in West Java,
Indonesia, the expectation based on product pattern was found to be an influential factor affecting
WTP for sustainable agricultural production [28]. In studies conducted in Oklahoma, USA; Tanzania;
and Uganda, it has been found that crop and seed varieties are effective factors affecting WTP for
sustainable agricultural activities for sustainable income [21,22,33].
Table 4 shows the relationship between the factors that affected the payment level of the variables
used in the model and their subgroups. All other sub-groups in the age variable showed more WTP
with respect to the reference group. However, there was no statistically significant relationship at any
subgroup (p > 10%). In the education variable, all other sub-groups showed more WTP with respect to
the reference group. There was a statistically significant relationship in all of the subgroups, middle
school, high school, and university graduates, and the significance level was determined as p < 5% for
middle and high school graduates and p < 10% for university graduates. In the experience variable,
those with 11–20 years of farming experience showed more WTP with respect to the reference group.
On the other hand, those with between 21 and 30 years’ and above 30 years’ experience showed less
WTP with respect to the reference group. No statistically significant relationship was detected at any
of the subgroups (p > 10%).
As the number of people in a household increased, there was less WTP with respect to the reference
group. There was a statistically significant relationship at each of the subgroups of the household
variable. The statistical significance was p < 5% between households of 5–9 people, and p < 1% between
households with 10 and above people. Large households often mean high living expenses for families.
Therefore, even if there has been a WTP for such households, the excess number of people must have
been negatively affected by their payment ability.
The subgroups of the variable, the number of people in a household working in agriculture,
showed more WTP with respect to the reference group. A statistically significant relationship was
found on the subgroup of 5–9 people working in agriculture and the reference group, with the level
of significance of p < 5%. There was a positive relationship between the number of people working
in agriculture and the level of ability to pay. All subgroups in the land quantity variable showed
more WTP with respect to the reference group. A statistically significant relationship was found
on all sub-variables. There was a significant level of p < 10% at farmers with 5.1 to 10 ha of land.
The statistical significance level at the land amount of 10.1 to 20 ha and above 20 ha was determined as
p < 5%. In other words, as the acreage of land increased, the ability to pay equally increased, therefore
WTP, too.Agriculture 2020, 10, 152 12 of 16
There was a statistically meaningful relationship between the two subgroups of the property
variable—i.e., non-landowners and landowners—which were the reference group. This relationship
was inverse and negative. The degree of significance was p < 1%, which was expected. Because those
who did not own property signed seasonal partnership or tenancy agreements, this group had less
income than those who owned property, and this affected their ability to pay.
Subgroups of the income variable group showed more WTP with respect to the reference group,
as was expected, because as farmers’ income increased, their ability to pay increased. However,
no statistically significant relationship was detected at any of the subgroups of the income variable
(p > 10%). Remarkably, the WTP decreased as the income level of the farmers’ increased. This was
unexpected before the research. This situation may be because the farmers felt more with increased
income and tended not to think that paying more money would lead to losses. In the non-agricultural
income variable, those who did not have non-agricultural income showed more WTP with respect to
the reference group, where non-agricultural income was the reference group. However, a statistically
significant relationship could not be detected between the two groups (p > 10%). Farmers, whose sole
source of income was agriculture showed greater WTP for sustainable income.
Taking the mixed croppers (cotton, wheat, corn, and barley) as the reference group in the crop type
variable, it was found that those who cultivated the only cotton and only wheat showed less WTP with
respect to the reference group, unlike other mono croppers. There was a statistically significant and
negative relationship at cotton-only farmers with a significance of p < 1%. This result is unexpected
under normal conditions, because cotton is a product with high production and income yield and added
value. Unusual climate events took place in Şanlıurfa in 2019. While the average annual precipitation
of Şanlıurfa (1929–2018) is often 451 mm, the average rainfall in the first three months of the 2018–2019
production season has been over 470 mm [34]. This situation caused the late cultivation of cotton.
On the other hand, the temperature in August 2019 was 21% below the average for many years. All of
these reduced cotton yield and thus caused loss of income. While the long term average cotton yield in
Şanlıurfa was between 5.5 and 6 tons/ha, it was between 2.5 and 3 tons/ha in 2019. Besides, although
the input costs of cotton production increased by around 30% on average, cotton prices decreased
by about 26% [67]. The average quantity of land used for mixed cropping, which was the reference
group, was 30.01 ha, the average quantity of land used for only cotton crops was 11.56 ha, and the
overall average quantity of land was 13.65 ha. Mixed crop cultivators, therefore, showed greater ability
to pay due to the advantage of product pattern diversity and land size. Even how these unforeseen
circumstances affected cotton yield is enough argument for the importance of sustainable income in
agriculture. The results obtained, considering the reasons stated, are meaningful and consistent.
According to the calculation that was made considering account of all participants (Table 4),
the WTP for service delivery for sustainable agricultural income in the GAP-Harran plains irrigation
was calculated as $1.2 million by multiplying 166 thousand hectares with $7.21.
5. Conclusions
One of the problems of the socio-economic sustainability of countries is the income gap between
the agricultural and non-agricultural sectors. Many studies have shown that agricultural sustainability
bridges this gap and enhances individual and social welfare. Sustainable agricultural production
benefits both producers and consumers. Agricultural sustainability cannot be achieved only through
the most efficient use of agricultural production resources. It is necessary to educate and take
responsibility of the farmers who use these resources. In other words, sustainable agriculture requires
not only a technical approach, but also social, economic, and political approaches. The requirements
of agricultural sustainability may differ for each community and region, because there are many
combinations of local parameters, conditions, and factors that affect them. Therefore, a general and
global approach to sustainable agricultural production may not give accurate and feasible results.
GAP is the flag project of the Republic of Turkey, in which agriculture is the most important sector.
Many investments and projects have been made for the development of the region within the scope ofAgriculture 2020, 10, 152 13 of 16
GAP, but the targeted progress based on many reasons has not been achieved sufficiently. Although
many types of research have been done on agricultural production and income, the expected benefits
cannot be said to have been satisfactorily provided. Because there is no comprehensive field study on
farmers’ sustainable agricultural income and the factors affecting it in the GAP Region. In far-reaching
integrated development projects, farmer’s thoughts, expectations, and participation in the process
significantly affect the level of project success.
According to the results obtained, 41.22% of the participants were not in favor of taking
responsibility for cost-sharing. This result is meaningful and remarkable. Special attention should
be given to this group. It should be explained to the group that waiting for the public sector to
provide all services may cause delays in the provision of the expected services and thus loss of income.
About 23.14% of the participants believed in the necessity of providing services to boost sustainable
agricultural income, but they had not felt sufficient and income-increasing effects from the services
provided so far. The provision of services based on the needs of this group would foster and increase
their WTP.
The WTP for service delivery for sustainable agricultural income in the GAP-Harran plain was
calculated as $1.2 million. This amount is the minimum and can be increased by several folds with
a variety of accurate and acceptable service delivery based on the demands of the farmers. In this
research, the general WTP of farmers for sustainable agricultural activities has been determined.
The next stage of this is to determine, by local and subject-based studies, which groups of farmers are
willing to pay and the factors affecting their willingness or otherwise. The results obtained from such
studies, together with those of the current research, will provide useful information to guide researchers,
decision-makers, and agricultural policymakers in the public and private sectors. This study is the first
of its kind in the GAP Region.
Author Contributions: Conceptualization, H.P.D. and M.H.A.; Methodology, M.R.S.; Software, M.C.; Validation,
H.P.D., M.R.S., and M.H.A.; Formal analysis, M.C.; Investigation, H.P.D.; Resources, M.R.S.; Data curation,
M.C.; Writing—original draft preparation, M.H.A.; Writing—review and editing, H.P.D.; Visualization, M.R.S.;
Supervision, M.H.A. All authors have read and agreed to the published version of the manuscript.
Funding: This research received no external funding.
Conflicts of Interest: The authors declare no conflict of interest.
References
1. Leao, I.; Ahmed, M.; Kar, A. Jobs from Agriculture in Afghanistan; The World Bank: Washington, DC, USA,
2018; ISBN 978-1-4648-1265-1.
2. Aydogdu, M.H. Evaluation of farmers’ willingness to pay for agricultural extension services in GAP-Harran
Plain, Turkey. J. Agric. Sci. Technol. 2017, 19, 785–796.
3. World Economic Forum. Global Risks Report 2018, 13th ed.; World Economic Forum: Geneva, The Switzerland,
2018; ISBN 978-1-944835-15-6.
4. SKD. Sürdürülebilir Tarım: Dünya’da ve Türkiye’de Güncel Durum. Available online: http://www.skdturkiye.
org/blog/surdurulebilir-tarim-dunyada-ve-turkiyede-guncel-durum (accessed on 11 January 2020).
5. Bateman, I.J.; Day, B.H.; Georgiou, S.; Lake, I. The aggregation of environmental benefit values: Welfare
measures, distance decay and total WTP. Ecol. Econ. 2006, 60, 450–460. [CrossRef]
6. Sevinç, G.; Aydoğdu, M.H.; Cançelik, M.; Sevinç, M.R. Farmers’ attitudes toward public support policy for
sustainable agriculture in GAP-Şanlıurfa, Turkey. Sustainability 2019, 11, 6617. [CrossRef]
7. Abebe, S.T.; Dagnew, V.G.; Zeleke, G.Z.; Eshetu, G.Z.; Cirella, G.T. Willingness to pay for watershed
management. Resources 2019, 8, 77. [CrossRef]
8. Sirat, A. Organik tahıl tarımı. Yüzüncü Yıl Üniversitesi Tarım Bilimleri Dergisi 2016, 26, 455–474.
9. Aydoğdu, M.H.; Kaya, F.; Eren, M.E.; Doğan, H. Organik ürün tüketim nedenleri üzerine bir araştırma:
Şanlıurfa örneklemesi. Akademik Sosyal Araştırmalar Dergisi 2018, 6, 161–170. [CrossRef]
10. Nicolopoulou-Stamati, P.; Maipas, S.; Kotampasi, C.; Stamatis, P.; Hens, L. Chemical pesticides and human
health: The urgent need for a new concept in agriculture. Front. Public Health 2016, 4, 148. [CrossRef]You can also read