Devising a method to remotely model and map the distribution of natural landscapes in Europe with the greatest recreational amenity value ...
←
→
Page content transcription
If your browser does not render page correctly, please read the page content below
a
Frontiers of Biogeography 2021, 13.1, e47737
Frontiers of Biogeography
Research Article the scientific journal of
the International Biogeography Society
Devising a method to remotely model and map the distribution of
natural landscapes in Europe with the greatest recreational amenity
value (cultural services)
Peter R. Long1* , Sandra Nogué2* , David Benz1 ,
Katherine J. Willis1
1
Long-term Ecology Laboratory. Department of Zoology, University of Oxford, Oxford, OX13PS, United Kingdom; 2
School of Geography and Environmental Science, University of Southampton, Highfield, Southampton, SO17 1BJ, United
Kingdom. Corresponding authors: Peter Long: peter.long@zoo.ox.ac.uk, Sandra Nogué: s.nogue-bosch@soton.ac.uk
*contributed equally
Abstract
Highlights
With a growing emphasis on the societal benefits gained
through recreation outdoors, a method is needed to • Our research furthers understanding of nature’s
identify which spaces are most valuable for providing contribution to human welfare by providing a model
those benefits. Social media platforms offer a wealth of to remotely measure recreational amenity across
useful information on where people prefer to enjoy the European landscapes using freely available datasets
outdoors. We combined geotagged images from Flickr including crowd-sourced GPS photographs.
with several environmental metrics in a Maxent model to
calculate the probability of a photograph being taken (the • Our results show that recreation amenity is maximised
potential supply of recreational amenity). We then built a in frequently visited natural areas near population
set of population density kernels to express the potential centres. However, our model also shows that these
demand of recreational amenity. Linear regression was areas may have low aesthetic value.
used to compare supply and demand layers to visitation • Aesthetic appeal is maximised in places with high
records from 540 recreation sites across Europe. The result elevation, coastlines, and large viewshed areas.
was a map estimating the number of visitors/km2/year. However, despite their potential, these areas do not
Our analysis showed that natural areas near population deliver a high level of recreation amenity.
centres deliver more recreational benefit than attractive
sites in remote locations. The former should therefore • We propose that for current and future conservation
be prioritised by planners and policymakers seeking to planning it is important to consider spatially explicit
protect or improve recreational amenity. models of recreational amenity and aesthetic appeal
as two separate entities.
Keywords: aesthetic value, cultural service, green health, natural capital, recreation, social media.
Introduction “non-material benefits people obtain from ecosystems
through spiritual enrichment, cognitive development,
Policies to conserve and enhance biodiversity reflection, recreation and aesthetic experience” (MA
have seen a significant shift in their framing over 2003). Despite the importance of cultural services, not
the past decade. Increasingly there is a focus on the enough is known about the types and spatial distribution
identification and conservation of aspects of nature of nature underpinning these services. In this study
(natural capital assets) that underpin important societal we therefore aimed to develop a methodology that
benefits (Diaz et al. 2018). Natural capital assets could remotely distinguish the European landscapes
include the species, communities and landscapes that with aesthetic appeal and importance for recreational
are important for carbon sequestration (e.g. societal amenity.
benefit: mitigating climate change), prevention of soil Determining the location of the biodiversity that
erosion (e.g. societal benefit: protecting water quality), provides cultural services has quickly gained political
water flow regulation (e.g. societal benefit: reducing importance in many countries as a result of emerging
flood risk), and cultural value (e.g. societal benefit: scientific evidence indicating clear physiological and
recreation). This last category is broadly defined as psychological benefits (Paracchini et al. 2014, Song et al.
e-ISSN: 1948-6596 https://escholarship.org/uc/fb doi:10.21425/F5FBG47737
© the authors, CC-BY 4.0 license 1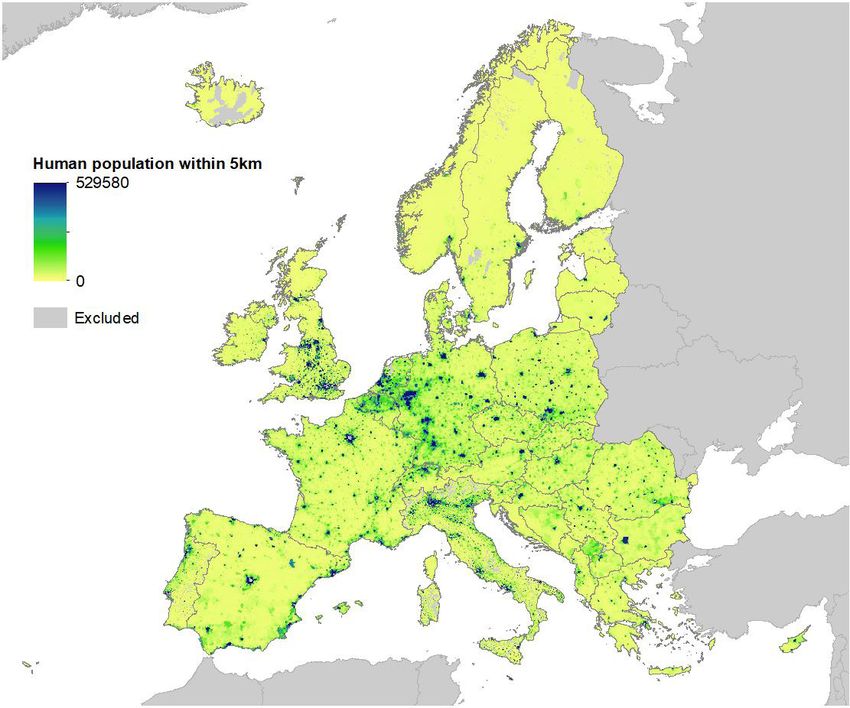
Long et al.                                                                  Modelling the aesthetic appeal of landscapes

2015, Hägerhäll et al. 2018, Twohig-Bennett and Jones       images and stated preferences for types of biodiversity
2018). Many of these studies have demonstrated              that were captured using survey techniques.
improved physical and mental wellbeing outcomes from            Online crowdsourced data appear to hold great
walking, exercising and relaxing in natural, biodiverse     potential for recording visitor numbers and biodiversity
green landscapes (for a review see Hansen et al. 2017).     type preference. However, in order to determine the
Identification of the landscapes that are important         most important landscapes for aesthetic recreational
for providing these recreational services is therefore      value (e.g. walking, contemplation, forest bathing,
a key priority.                                             etc.), especially outside cities, research suggests
    Whilst there is widespread agreement on the need        that a number of other factors must also be taken
to determine where recreational service provision           into consideration. In a study where expert-based
is high, doing so is not easy. There are a number of        participatory mapping was used alongside crowd-
reasons for this. First, people often don’t pay to access   sourced data (13,400 geolocated photographs from
the landscapes that provide these services. National        Flickr) to determine landscapes around Barcelona
parks and cultural heritage sites sometimes have            with the greatest aesthetic appreciation, distance
gate receipts, but the vast majority of nature visited      and accessibility to the landscapes were found to be
does not have a payment system for access. Second,          more important determinants than the ‘pristineness’
there are large cultural variations between people’s        of nature (Langemeyer et al. 2018). Similarly, a study
preferences. What one community sees as aesthetically       in the Hawaii Volcanoes National Park demonstrated
pleasing may well be viewed as less attractive by           that ease of access (i.e. infrastructure) and elevation
another. Third, when people are surveyed about their        were the most important components accounting
“willingness to pay” to access cultural landscapes, a       for visitor distribution across the park (Walden-
strong socio-economic bias emerges whereby those            Schreiner et al. 2018).
with lower income are less willing to pay (e.g. Lo and          Therefore, whilst there is an increasing demand to
Jim 2010). Fourth, aesthetic values are often associated    determine and conserve landscapes that are important
with a particular view or landscape type and have no        for recreational amenities, there is still a knowledge
well-defined boundaries to enable mapping (Oteros-          gap around how to map these landscapes, especially
Rozas et al. 2018).                                         outside urban regions. It is clear that information
    A number of studies in the past few years have          gleaned from social media platforms such as Flickr
therefore aimed to quantify the spatial distribution        can provide some important data and that a number
of cultural services using alternative techniques to        of variables need to be taken into consideration.
traditional surveys, interviews and expert-based                In our study we aimed to develop a new
participatory mapping. In particular, there has been        methododology combining these various approaches
increased attention on the use of crowdsourced              in order to model and remotely map the distribution
data including geo-tagged photographs uploaded to           of non-urban landscapes in Europe with the greatest
platforms such as Flickr and Panoramio (Wood et al.         recreational amenity value. We focused on non-material
2013, Antoniou et al. 2016, Hirons et al. 2017,             recreation and aesthetic values and excluded cultural
Figueroa-Alfaro and Tang 2017) to determine people’s        heritage from our model. We used a combination of
preferences for wildlife, landscape types and aesthetics.   well-established models and evidence from freely
These studies have shown some promising results.            available datasets, including Flickr photographs
For example, to understand the effectiveness of using       and recreational visitor numbers, plus distance to
remotely captured data to survey the use of hiker           urban areas and environmental characteristics. The
trails in a national forest in Washington, Fisher et al.    resulting output is a map covering Europe at 250 m
(2018) compared remotely captured visitor data, from        resolution indicating an estimation of the number of
internet-based trip reports and Flickr images, with         people per km2 per year who participate in outdoor
those collected by more traditional survey methods.         recreation. We go on to discuss the accuracy of this
The latter included data captured from infrared sensors,    approach and the use of such maps in current and
time-lapse cameras and manual on-site counts. When          future conservation planning for landscapes across
the output from the internet-based data was compared        Europe that are important for recreational amenity.
with the traditionally collected data, the authors found
a positive correlation with visitor numbers recorded.       Methods
This study concluded that geo-tagged images and
content on the internet could potentially provide an           We define the ecosystem service of recreational
important new cost-effective and convenient way to          amenity as the number of people per km2 per year
assess visitation numbers to sites. Some interesting        who participate in outdoor recreation in non-urban
results also emerged from a study which looked at           areas (Fig. 1).
the use of internet-based photographs to determine
preferences for different types of biodiversity in Kruger   Study area and environmental covariates
National Park, South Africa (Hausmann et al. 2018).            The study area chosen to model the provision of
Around 13,600 pictures shared on Instagram and Flickr       recreational amenity is Europe, including the European
by tourists visiting the park in a set time interval were   Economic Area (EEA) and countries geographically in
compared to questionnaire-based output. There was           Europe (excluding Turkey). As our baseline land cover
strong similarity between the results captured using        we used the EU Corine Land Cover 2012 map (EEA

Frontiers of Biogeography 2021, 13.1, e47737                                    © the authors, CC-BY 4.0 license       2
Long et al. Modelling the aesthetic appeal of landscapes
Figure 1. Outline of model for recreational amenity showing steps toward the final output. Raw data are in grey boxes
while derived products are in white boxes. Pr(Flickr): probability of occurrence of Flickr records.
2012) at a resolution of 7.5” (each pixel approximately annual visitor density was natural log transformed
230 x 230 m). We excluded urban classes from the prior to analysis. Visitor density data was partitioned
final landcover map because our model is intended to into training (n = 205) and validation (n = 205) sets in
measure cultural amenity in landscapes outside cities. order to assess the accuracy of the final model (Fig. 1).
A different resolution and set of considerations would
need to be taken into account for urban green spaces Volunteered Geographical information and density
(see for example Cortinovis et al. 2018). of non-urban Flickr records/km2/year
We compiled a set of environmental covariates, We used Flickr records from Europe for December
including mean annual temperature (ºC) and total 2016 to November 2017 obtained from the Flickr public
annual precipitation (mm) from Worldclim data API. Flickr is a social media site which allows users to
(Hijmans et al. 2005) resampled from 30” to 7.5” upload photographs with geolocation information. In
resolution. In addition, we included elevation (m.a.s.l) this analysis we were not concerned with the content
(Danielson and Gesh 2011) and calculated viewshed of the photographs, rather the event that a user has
area (km2) using the formulae from Bishop (2003) and decided to take and share a photograph at a particular
Husar et al. (2000) that take into account atmospheric location. The coordinate precision of Flickr record
effects and the earth’s curvature, assuming a viewer locations is ~100m.
height of 2m. As the focus was on non-urban areas, we first
filtered the Flickr records using the previously described
Visitation data landcover map to discard any record in a location
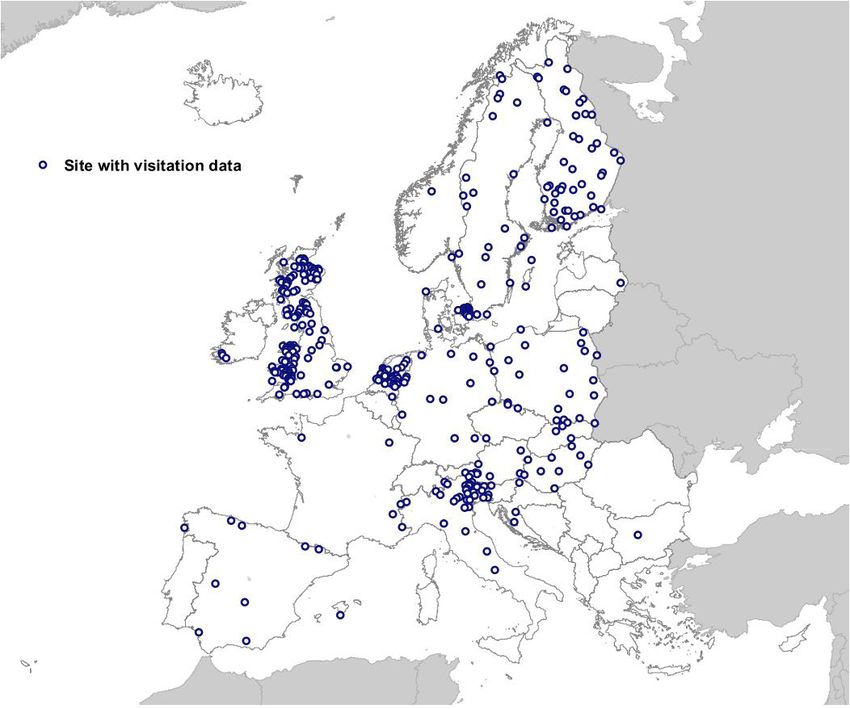
We obtained visitor data from the Schägner et al. with urban land cover class. A random sample of the
(2017) database containing annual numbers of remaining non-urban Flickr records was selected and
recreational visitors to 540 sites in 20 European countries the previously described environmental covariate
(Fig. 2). These sites vary in size from urban parks to values were extracted for each Flickr point. A random
large national parks. However, all are accessible to the sample of locations not associated with Flickr images
public free of charge. To calculate annual recreational (i.e. background sites) in Europe was also selected and
visitor density (individuals/km2/year), 410 of the sites the same covariates were extracted to points. We also
were joined by name and country to Open Street Map explored Flickr’s seasonality, namely the abundance
(OSM) polygons1 (Ramm et al. 2011). In sites where of records uploaded in each month (Supplementary
data for multiple years was available, we calculated a Material).
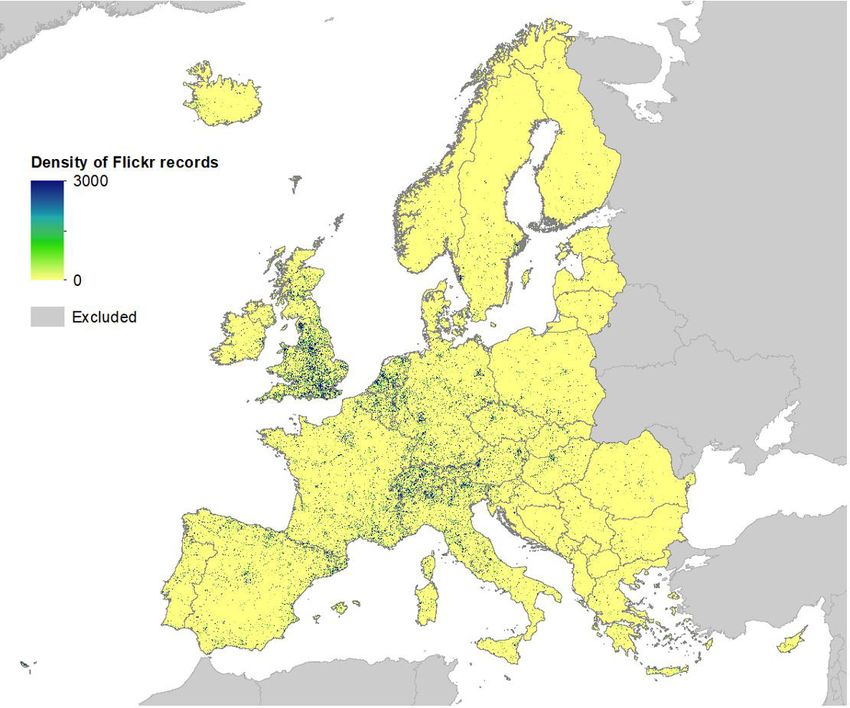
multi-annual visitor average. We also verified that the We calculated photo density using the non-urban
area of each OSM polygon matched that reported in the Flickr records (density of non-urban Flickr records/km2)
visitor dataset. This was followed by an analysis using (Fig. 3). To do this we calculated the kernel density of
zonal geometry to calculate the area of each polygon. all non-urban Flickr records in Europe at various scales:
This step was necessary because places with visitation 7.5”, 15”, and 30” resolution as an alternative set of
data differed in size, and an area normalised measure covariates to explain visitor density. Flickr records are
was required for subsequent modelling. Finally, the sparse, so at fine scales the measure tends to zero.
1 https://planet.openstreetmap.org/, retrieved 22/11/2019.
Frontiers of Biogeography 2021, 13.1, e47737 © the authors, CC-BY 4.0 license 3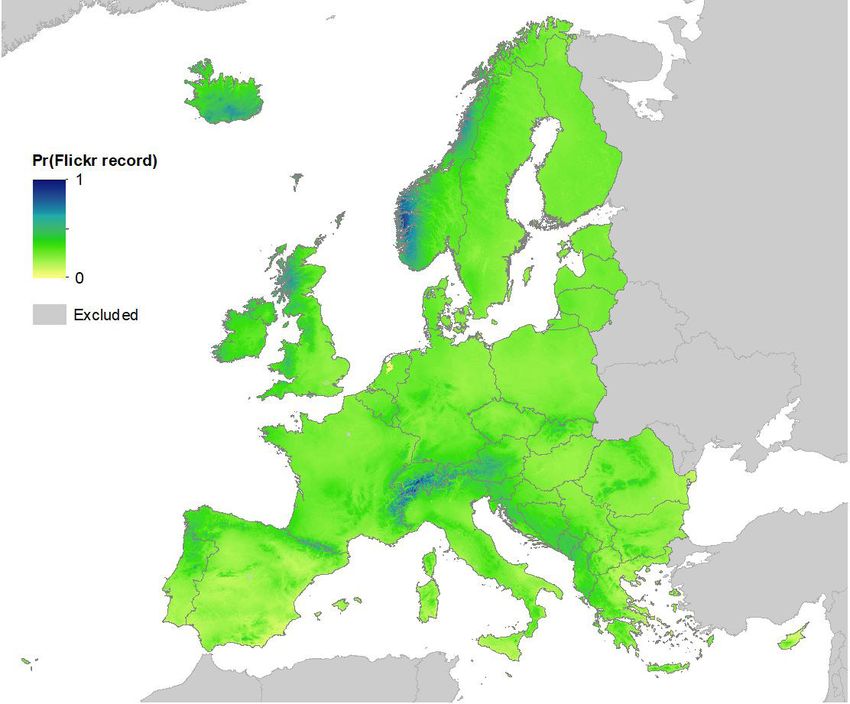
Long et al.                                                                       Modelling the aesthetic appeal of landscapes

Figure 2. Location of sites with visitation data in Europe. Data from Schägner et al. (2017).

Figure 3. Density of non-urban Flickr records in Europe in 2017, measured as records/km2. Values express the kernel-count
of photographs taken at a particular location.

Frontiers of Biogeography 2021, 13.1, e47737                                         © the authors, CC-BY 4.0 license       4
Long et al.                                                                       Modelling the aesthetic appeal of landscapes

However, this approach allows the capture of density           The Maxent output estimated the potential supply of
at ‘honeypot’ sites, which receive very high numbers           recreation amenity according to its aesthetic appeal
of visitors.                                                   (Fig. 4).
Human population                                               Potential demand layer
    To calculate human population density in Europe,               We reasoned that the full ecosystem service of
we obtained 1km data from the Gridded Population               recreational amenity will depend not only on the
of the World 2015 dataset (CIESIN 2018).                       potential of a landscape to supply recreation, but
                                                               also on the ability to access the recreation areas. We
Model for recreational visitor density                         therefore calculated a ’demand layer‘ making use of
    The model for recreational visitor density was             the human population density data (Fig. 5). We used
constructed taking account of two classes of explanatory       distance kernels that varied across four different spatial
variables: 1) potential supply of recreational amenity,        extents. Total human population was measured in
and 2) potential demand for recreational amenity as            kernels ranging from 3x3 km up to 51x51 km. These grids
follows:                                                       represented the set of people potentially demanding
                                                               opportunities to do outdoor recreation activities at
Potential supply layer                                         nested scales from local (within 1km of home), to
    We assume that the potential of a landscape to             regional (within ~25km).
supply opportunities for recreation will be some function
of how attractive it is to people (‘aesthetic appeal’).        Model for recreational visitor density
To understand the environmental features that might               To obtain the final model for recreational visitor
contribute to this aesthetic appeal we used the kernel         density, we zonally summarised the potential supply
density of non-urban Flickr records (described above)          layers and potential demand layers by the training
in combination with the environmental covariates (land         set of polygons for which we have visitor density
cover class, elevation, viewshed area, temperature,            data. We then applied a linear regression model for
and precipitation). These variables along with the             annual recreation visitor density taking into account as
visitor density data were used to build and validate           explanatory variables both supply and demand layers.
distribution models using Maxent (Phillips et al. 2006).       Our final set of models estimated visitor density in the

Figure 4. Potential supply map representing aesthetic appeal in Europe in 2017. The map shows the probability of occurrence
of a Flickr record (Pr(Flickr)) as a function of environmental covariates. Areas in yellow or light green are predicted to
have lower aesthetic value, while dark green to blue areas should have high aesthetic value.

Frontiers of Biogeography 2021, 13.1, e47737                                         © the authors, CC-BY 4.0 license       5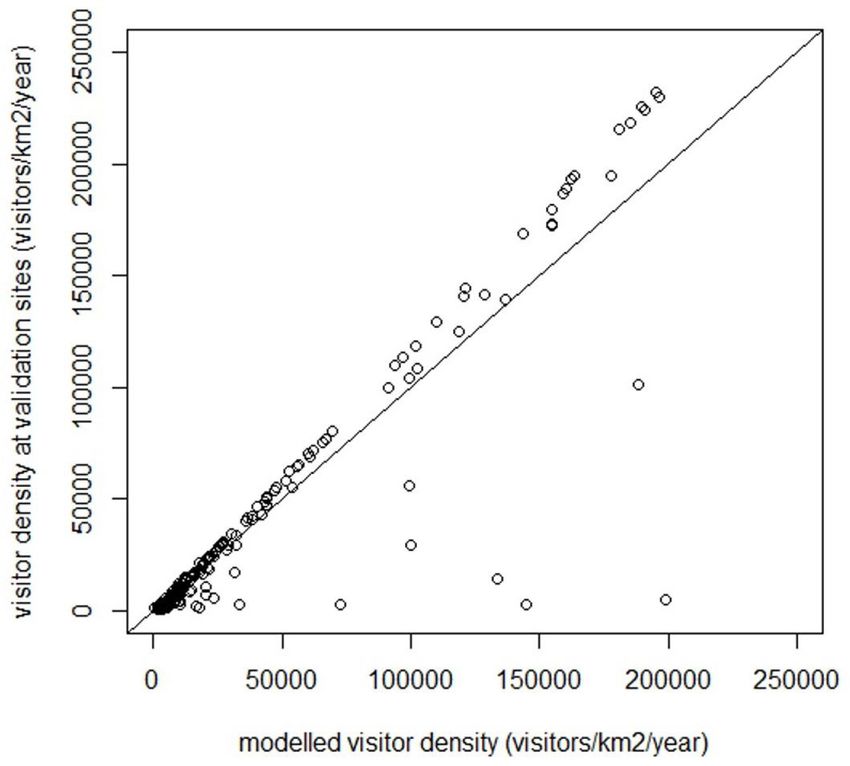
Long et al.                                                                   Modelling the aesthetic appeal of landscapes

Figure 5. Map of total human population within 5km, representing the potential demand for recreational amenity. Areas
in blue have high population, whereas areas in yellow are sparsely populated.

training set of polygons as a function of explanatory       when Flickr records were submitted, we found a
variables as follows: probability of occurrence of Flickr   seasonal pattern: greater numbers of Flickr records
records (pr(Flickr)), density of Flickr in kernels, and     are submitted from April to September (Fig. S1).
human population sum in kernels. A maximal model            Among European countries, Flickr records in 2017 were
cotaining all covariates was stepwise refined using AIC     densest in the UK, where density values reached 3000
to identify the most parsimonious minimum adequate          records/km2/year. Other countries with high densities
model (Burnham and Anderson 2002). Finally, to make         of Flickr records from non-urban environments were
the final map of estimated number of recreational           Belgium, Germany, the Netherlands, and Switzerland
visitors/km2/year, the minimum adequate model was           (Fig. 3).
evaluated using map algebra and the result was natural
antilog transformed (because the response variable in       Potential supply layer
the model was ln visitor density). This was then urban         Maxent results showed the landscape pattern
masked and land masked.                                     of the probability of occurrence of Flickr record
                                                            as a function of elevation (ma.s.l), mean annual
Validation                                                  temperature (ºC), total annual precipitation (mm),
    The validation set of polygons (with visitor density    and viewshed area (km2). Probability of occurrence
data not used to develop the model), was then used          of Flickr records varied greatly between mountain
to zonally summarise the estimated visitor density          regions (e.g. the Alps, Pyrenees, Western Norwegian
in the final recreation amenity map. Regression was         coast, and Scottish Highlands) and coastal regions
used to evaluate the performance of the model and           (e.g. Croatia) (Fig. 4).
uncertainty in the recreational amenity map.
                                                            Potential demand layer
Results                                                         Human population within 5km represents the greatest
                                                            demand for the service of recreation amenity (Fig. 5).
                                                            Human population within several distance kernels
Flickr results                                              were tested in the modelling process, however only
   We obtained a total of 6,920,627 suitable Flickr         human population density within 5km was retained
records for Europe. When accounting for the month           in the final model (Table 1).

Frontiers of Biogeography 2021, 13.1, e47737                                     © the authors, CC-BY 4.0 license       6
Long et al. Modelling the aesthetic appeal of landscapes
Model for recreational visitor density idenfied hotpsots of key geographic features, suggesting
According to our recreational amenity model, that the interest of the population is not only limited
calculated as visitors/km2/year, areas of nature that to natural parks but is also related to accessibility
delivered the most recreational service were located (Gliozzo et al. 2016). Focusing specifically on European
near major European cities with values up to 1.2 million Natural Parks, a case study using Flickr datasets from
visitors/km2/year (Fig. 3). In contrast, the environs of Portugal identified that the highest recreation values
small and more isolated European cities did not display were determined by distance to the ocean and distance
high levels of recreation amenity. The final recreational to touristic and cultural infrastructure. The authors of
amenity model showed that there is little relationship the study concluded that the shore of the Natural Park
between the landscapes with aesthetically appealing is suffering high anthropic pressure but that the same
features such as mountains, lakes, and coastlines (e.g. region is most important economically and politically
Schirpke et al. 2016, Van Berkel et al. 2018), and the (Clemente et al. 2019).
recreation service delivered (Fig. 6). In our study we found a similar trend. Our model
represents an integrative approach that enables remote
Validation identification of high-quality European landscapes
Comparison between the visitor density estimated by with the potential to deliver recreational opportunities
our model and actual visitor density (visitors/km2/year) and to enhance human well-being (per Hansen et al.
at 205 validation sites which had not been used to 2017). We show that social media records, population
develop the model showed a decent performance density, environmental characteristics, and probability
(Linear regression: slope = 1.187 n = 205 sites, pLong et al. Modelling the aesthetic appeal of landscapes Figure 6. a) Final recreational amenity map, showing the pattern of estimated visitor density across Europe in 2017. Insets display recreational amenity at a finer scale for selected urban areas: b) Barcelona; c) Berlin; d) Paris; e) the Rhine and Ruhr Valleys. Blue represents high recreation service provision. Frontiers of Biogeography 2021, 13.1, e47737 © the authors, CC-BY 4.0 license 8
Long et al.                                                                      Modelling the aesthetic appeal of landscapes

Table 1. Minimum adequate model for visitor density in Europe as a function of Flickr record density and human population
density within 5km. Multiple linear regression, n = 205 sites. The t-test statistics for partial slopes of the explanatory
variables retained in the final model are reported. The coefficient of determination R2 = 0.378
          Response                        Explanatory                 Beta                  t                   p
ln(visitor density)               Intercept                         7.248                 61.22
Long et al. Modelling the aesthetic appeal of landscapes
populated, and so have lower demand. On the a novel approach. Ecological Informatics, 24,
other hand, countries with an extensive network 194-199.
of accessible sites can provide a high level of
Beale, C.M . & Lennon, J.J. (2012) Incorporating
recreational service to their populations. Natural
sites between cities ensure high recreation amenity uncertainty in predictive species distribution
over a broad expanse. modelling. Philosophical Transactions of the
Royal Society B: Biological Sciences, 367,
The potential of modelling cultural services is 247-258.
broad, and may help planners at all levels to target
areas that should be preserved or enhanced for public Bik, H.M. & Goldstein, M.C. (2013) An introduction
recreation. Consideration must be given to all aspects to social media for scientists. PLoS Biology,
of the landscape, including its proximity to potential 11, e1001535.
recreational users. Bishop, I.D. (2003) Assessment of visual qualities,
impacts, and behaviours, in the landscape,
Acknowledgements by using measures of visibility. Environment
We thank the support of the European Commission, and Planning B, 30, 677-688.
Directorate-General Environment grant LIFE12 ENV/ Burnham, K.P. & Anderson, D.R. (2002) Model
UK/000473, the VISTA programme from the Norwegian selection and multimodel inference: a practical
Academy of Science and Letters (Project number information-theoretic approach. Springer,
6158), and NERC NPIF Award NE/R011885/1. We also
London.
thank the Oxford Long-term Ecology Laboratory for
stimulating discussion. Center for International Earth Science Information
Network - CIESIN - Columbia University (2018)
Author Contributions Gridded population of the world, version 4
PL, SN, and KJW conceptualised and designed the (GPWv4): population density, revision 11.
study. PL collected the datasets and perfomed the NASA Socioeconomic Data and Applications
analysis. SN and KJW wrote the original draft with Center (SEDAC), Palisades, NY.
contributions from all co-authors. DB and PL created Chandler, M., See, L., Copas, K., et al. (2017)
the figures. Contribution of citizen science towards
international biodiversity monitoring. Biological
Data Accessibility Conservation, 213, 280-294.
Data and code for this study are available via the Chen, X., de Vries, S., Assmuth, T., et al. (2019)
ORA-Data deposit at: Research challenges for cultural ecosystem
https://ora.ox.ac.uk/objects/uuid:2b4410a5-86e6-
4b34-8243-643c9ca533f0 services and public health in (peri-)urban
environments. Science of The Total Environment,
Supplementary Material 651, 2118-2129.
Clemente, P., Calvache, M., Antunes, P., Santos,
The following materials are available as part of the
online article at https://escholarship.org/uc/fb R., Cerdeira, J.O. & Martins, M.J. (2019)
Figure S1. Seasonal distribution of non-urban Flickr Combining social media photographs and
records across Europe in 2017 species distribution models to map cultural
ecosystem services: the case of a Natural Park
in Portugal. Ecological Indicators, 96, 5-68.
References
Cortinovis, C. & Davide, G. (2019) A framework to
Anderson, S. (2018) iNaturalist: understanding explore the effects of urban planning decisions
biodiversity through a digital medium. MA on regulating ecosystem services in cities.
thesis, University of Waterloo. Ecosystem Services, 38, 100946.
Antoniou V., Fonte C.C., See L., Estima J., Arsanjani Danielson, J. & Gesh, D.B. (2011) Global multi-
J.J., Lupia F., Minghini M., Foody G. & Fritz S. resolution terrain elevation data (GMTED2010).
(2016) Investigating the feasibility of geo- USGS Open-File Report 2011-1073, https://
tagged photographs as sources of land cover doi.org/10.3133/ofr20111073.
input data. ISPRS International Journal of Daume, S. (2016) Mining Twitter to monitor invasive
Geo-Information, 5, 64. alien species - an analytical framework and
Barve, V. (2014) Discovering and developing primary sample information topologies. Ecological
biodiversity data from social networking sites: Informatics, 31, 70-82.
Frontiers of Biogeography 2021, 13.1, e47737 © the authors, CC-BY 4.0 license 10Long et al. Modelling the aesthetic appeal of landscapes
Diaz, S., Pascual, U., Stenseke, M., et al. (2018). Hägerhäll, C.M., Ode Sang, Å., Englund, J.E., Ahlner,
Assessing nature’s contributions to people. F., Rybka, K., Huber, J. & Burenhult, N. (2018)
Science, 359, 270-272. Do humans really prefer semi-open natural
Di Minin, E., Tenkanen, H. & Toivonen, T. (2015) landscapes? A cross-cultural reappraisal.
Prospects and challenges for social media Frontiers in Psychology, 9, 822.
data in conservation science. Frontiers in Hansen, M.M., Jones, R. & Tocchini, K. (2017) Shinrin-
Environmental Science, 3, 63 Yoku (forest bathing) and nature therapy: a
Dowthwaite, L. & Sprinks, J. (2019) Citizen science state-of-the-art review. International Journal
and the professional-amateur divide: lessons of Environmental Research and Public Health,
from differing online practices. Journal of 14, 851.
Science Communication, 18, A06. Hauff, C. & Houben, G.J. (2012) Geo-location estimation
European Environment Agency (2012) Corine of Flickr images: social web based enrichment.
Land Cover 2012. Available at: http://land. In: Advances in information retrieval (ed. by
copernicus.eu/pan-european/corine-land- R. Baeza-Yates, A.P. de Vries, H. Zaragoza, B.
cover/clc-2012 Barla Cambazoglu, V. Murdock, R. Lempel
Figueroa-Alfaro, R.W. & Tang, Z. (2017) Evaluating and F. Silvestri), pp. 85–96. Springer, Berlin,
the aesthetic value of cultural ecosystem Heidelberg.
services by mapping geo-tagged photographs Hausmann, A., Toivonen, T., Slotow, R., Tenkanen,
from social media data on Panoramio and H., Moilanen, A., Heikinheimo, V. & Di Minin,
Flickr. Journal of Environmental Planning E. (2018) Social media data can be used
and Management, 60, 266-281. to understand tourists’ preferences for
Fisher, D.M., Wood, S.A., White, E.M., Blahna, D.J., nature-based experiences in protected areas.
Lange, S., Weinberg, A., Tomco, M. & Lia, E. Conservation Letters, 11, e12343.
(2018) Recreational use in dispersed public Heikinheimo, V., Di Minin, E., Tenkanen, H., Hausmann,
lands measured using social media data and A., Erkkonen, J. & Toivonen, T. (2017) User-
on-site counts. Journal of Environmental generated geographic information for visitor
Management, 222, 465-474. monitoring in a national park: a comparison
Ghermandi, A. & Sinclair, M. (2019) Passive of social media data and visitor survey. ISPRS
crowdsourcing of social media in environmental International Journal of Geo-Information, 6, 85.
research: a systematic map. Global Environmental Hijmans, R.J., Cameron, S.E., Parra, J.L., Jones, P.G.
Change, 55, 36-47. & Jarvis, A. (2005) Very high resolution
Girardin, F., Dal Fiore, F., Ratti, C. & Blat, J. (2008) interpolated climate surfaces for global land
Leveraging explicitly disclosed location areas. International Journal of Climatology,
information to understand tourist dynamics: a 25, 1965-1978.
case study. Journal of Location Based Services, Hirons, M., Comberti, C. & Dunford, R. (2016) Valuing
2, 41-56. cultural ecosystem services. Annual Review
Gliozzo, G., Pettorelli, N. & Haklay, M. (2016) Using of Environment and Resources, 41, 545-574.
crowdsourced imagery to detect cultural Husar, R.B., Husar, J.D. & Martin, L. (2000) Distribution
ecosystem services: a case study in South of continental surface aerosol extinction
Wales, UK. Ecology and Society, 21, http:// based on visual range data. Atmospheric
dx.doi.org/10.5751/ES-08436-210306. Environment, 34, 5067-5078.
Gosal, A.S., Geijzendorffer, I.R., Václavík, T., Poulin, B. Jeawak, S.S., Jones, C.B. & Schockaert, S. (2017) Using
& Ziv, G. (2019) Using social media, machine Flickr for characterizing the environment: an
learning and natural language processing exploratory analysis. In: 13th International
to map multiple recreational beneficiaries. Conference on Spatial Information Theory
Ecosystem Services, 38, 100958. (COSIT 2017) (ed. by E. Clementini, M. Donnelly,
Gouraguine, A., Moranta, J., Ruiz-Frau, A., Hinz, H., M. Yuan, C. Kray, P. Fogliaroni and A. Ballatore),
Renones, O., Ferse, S.C.A., Jompa, J. & Smith, D.J. pp. 21:1-21:13. Schloss Dagstuhl – Leibniz-
(2019) Citizen science in data and resource- Zentrum für Informatik, Dagstuhl.
limited areas: a tool to detect long-term Langemeyer, J., Calcagni, F. & Baró, F. (2018) Mapping
ecosystem changes. PLoS One, 14, e0210007. the intangible: using geolocated social media
Frontiers of Biogeography 2021, 13.1, e47737 © the authors, CC-BY 4.0 license 11Long et al. Modelling the aesthetic appeal of landscapes
data to examine landscape aesthetics. Land reporting standard. Journal of Outdoor
Use Policy, 77, 542-552. Recreation and Tourism, 18, 44-55.
Lo, A.Y. & Jim, C.Y. (2010) Willingness of residents Schirpke, U., Timmermann, F., Tappeiner, U. & Tasser,
to pay and motives for conservation of urban E. (2016) Cultural ecosystem services of
green spaces in the compact city of Hong Kong. mountain regions: modelling the aesthetic
Urban Forestry & Urban Greening, 9, 113-120. value. Ecological Indicators, 69, 78-90.
Mancini, F,. Coghill, G.M., & Lusseau, D. (2019) Seresinhe, C.I., Preis, T. & Moat, H.S. (2017) Using
Quantifying wildlife watchers’ preferences to deep learning to quantify the beauty of outdoor
investigate the overlap between recreational places. Royal Society Open Science, 4(7), 170170.
and conservation value of natural areas. Journal Sinclair, M., Mayer, M., Woltering, M. & Ghermandi,
of Applied Ecology, 56, 387-397. A. (2020) Using social media to estimate
Millennium Ecosystem Assessment (MA) (2003) visitor provenance and patterns of recreation
Ecosystems and human well-being: a framework in Germany’s national parks. Journal of
for assessment. Island Press, Washington, Environmental Management, 263, 110418.
DC. 245 pp. Song, W., Deng, X., Liu, B., Li, Z., Jin, G. & Wen, X.
Oteros-Rozas, E., Martin-Lopez, B., Fagerholm, N., (2015) Impact Assessments of Land-Use
Bieling, C. & Plieninger, T. (2018) Using social Change on Valued Ecosystem Services. In:
media photos to explore the relation between Impacts of land-use change on ecosystem
cultural ecosystem services and landscape services (ed. by Zhan, J.), pp. 79-108. Springer,
features across five European sites. Ecological Berlin, Heidelberg.
Indicators, 94, 74-86. Tenerelli, P., Demsar, U. & Luque, S. (2016) Crowdsourcing
Paracchini, M.L., Zulian, G., Kopperoinen, L., Maes, J., indicators for cultural ecosystem services:
Schagner, J.P., Termansen, M., Zandersen, M., a geographically weighted approach for
Perez-Soba, M., Scholefield, P.A. & Bidoglio, G. mountain landscapes. Ecological Indicators,
(2014) Mapping cultural ecosystem services: a 64, 237-248.
framework to assess the potential for outdoor Tenkanen, H., Di Minin, E., Heikinheimo, V., Hausmann,
recreation across the EU. Ecological Indicators, A., Herbst, M., Kajala, L. & Toivonen, T. (2017)
45, 371-385. Instagram, Flickr, or Twitter: assessing the
Perrin, S. (2019) Mapping species distribution with usability of social media data for visitor
citizen science. Ecology for the masses. https:// monitoring in protected areas. Scientific
ecologyforthemasses.com/2019/02/20/ Reports, 7, 17615.
mapping-species- distribution-with-citizen- Twohig-Bennett, C. & Jones, A. (2018) The health
science/. Accessed 29 April 2019. benefits of the great outdoors: a systematic
Phillips, S.J., Anderson, R.P. & Schapire, R.E. (2006) review and meta-analysis of greenspace
Maximum entropy modeling of species exposure and health outcomes. Environmental
geographic distributions. Ecological Modelling, Research, 166, 628-637.
190, 231-259. Van Berkel, D.B., Tabrizian, P., Dorning, M.A., Smart,
Pocock, M.J.O., Chapman, D., Sheppard, L.J. & Roy, L., Newcomb, D., Mehaffey, M., Neale, A. &
H.E. (2014) A strategic framework to support Meentemeyer, R.K. (2018) Quantifying the
the implementation of citizen science for visual-sensory landscape qualities that
environmental monitoring. Final report to contribute to cultural ecosystem services
SEPA, NERC/Centre for Ecology & Hydrology, using social media and LiDAR. Ecosystem
Wallingford. 65 pp. Services, 31, 326-335.
Ramm, F., Topf, J. & Chilton, S. (2011) Open street van Zanten, B.T., Zasada, I., Koetse, M.J., Ungaro, F.,
map: using and enhancing the free map of Häfner, K. & Verburg, P.H. (2016a) A comparative
the world. UIT Cambridge Ltd., Cambridge. approach to assess the contribution of landscape
Schägner, J.P., Maes, J., Brander, L., Paracchini, M.- features to aesthetic and recreational values in
L., Hartje, V. & Dubois, G. (2017) Monitoring agricultural landscapes. Ecosystem Services,
recreation across European nature areas: a 17, 87-98.
geo-database of visitor counts, a review of van Zanten, B.T., Van Berkel, D.B., Meentemeyer,
literature and a call for a visitor counting R.K., Smith, J.W., Tieskens, K.F. & Verburg, P.H.
Frontiers of Biogeography 2021, 13.1, e47737 © the authors, CC-BY 4.0 license 12Long et al. Modelling the aesthetic appeal of landscapes
(2016b) Continental-scale quantification of Kaye, J. & Juengst, E.T. (2016) Citizen science
landscape values using social media data. or scientific citizenship? Disentangling the
Proceedings of the National Academy of uses of public engagement rhetoric in national
Sciences USA, 113, 12974-12979. research initiatives. BMC Medical Ethics, 17, 33.
Walden-Schreiner, C., Leung. Y.-F. & Tateosian, L. (2018) Yoshimura, N. & Hiura, T. (2017) Demand and
Digital footprints: incorporating crowdsourced supply of cultural ecosystem services: use of
geographic information for protected area geotagged photographs to map the aesthetic
management. Applied Geography, 90, 44-54. value of landscapes in Hokkaido. Ecosystem
Wood, S.A., Guerry, A.D., Silver, J.M. & Lacayo, M. Services, 24, 68-78.
(2013) Using social media to quantify nature-
based tourism and recreation. Scientific Submitted: 16 April 2020
Reports, 3, 2976. First decision: 16 June 2020
Woolley, J.P., McGowan, M.L., Teare, H.J.A., Coathup, Accepted: 9 November 2020
V., Fishman, J.R., Settersten, R.A., Sterckx, S., Edited by Janet Franklin
Frontiers of Biogeography 2021, 13.1, e47737 © the authors, CC-BY 4.0 license 13You can also read