CaloriNet: From silhouettes to calorie estimation in private
←
→
Page content transcription
If your browser does not render page correctly, please read the page content below
CaloriNet: From silhouettes to calorie estimation in private
                                                               environments
                                              Alessandro Masullo∗    Tilo Burghardt                         Dima Damen                Sion Hannuna
                                                             Victor Ponce-López                             Majid Mirmehdi
                                                                                           June 22, 2018
arXiv:1806.08152v1 [cs.CV] 21 Jun 2018

                                                                                               Abstract
                                                    We propose a novel deep fusion architecture, CaloriNet, for the online estimation of energy
                                                expenditure for free living monitoring in private environments, where RGB data is discarded
                                                and replaced by silhouettes. Our fused convolutional neural network architecture is trainable
                                                end-to-end, to estimate calorie expenditure, using temporal foreground silhouettes alongside
                                                accelerometer data. The network is trained and cross-validated on a publicly available dataset,
                                                SPHERE_RGBD + Inertial_calorie. Results show state-of-the-art minimum error on the
                                                estimation of energy expenditure (calories per minute), outperforming alternative, standard
                                                and single-modal techniques.

                                         1      Introduction
                                         Physical activity has been linked to general health [22] and has shown positive psychological benefits
                                         [9] in clinical tests. Further, sedentary behaviour has consequences that may impose many health
                                         risks, for example on musculoskeletal health. This is especially important for older adults, for
                                         whom physical activity can counteract the detrimental effect on the cardiovascular system and
                                         skeletal muscles associated with age [13]. Monitoring the extent of physical activity via energy
                                         expenditure (EE) is therefore of valuable importance and different approaches have been proposed
                                         in the literature, from the use of questionnaires [14], to metabolic lookup tables (METs) [1], to
                                         peak oxygen uptake estimations [5].
                                             With the development of novel technologies, Internet of Things (IoT) is playing an important
                                         role in monitoring well being and health [28]. Accelerometers1 have often been adopted for the
                                         estimation of EE [38], although video monitoring systems have recently showed superior perfor-
                                         mances [33], especially when combined with inertial based measurements [32]. However, recent
                                         works, such as from Birchley et al.[7], Ziefle et al.[40] and Jancke et al.[19] have highlighted the
                                         important aspect of privacy concern in medical technologies for smart homes, showing a critical
                                         view of such systems from participants. Patients often fear misuse of their video recordings, data
                                         leakage or loss due to technical issues. These concerns have been addressed in the work from Hall
                                         et al.[17] by replacing the RGB video stream with bounding boxes, skeletons and silhouettes, which
                                         not only assess the privacy issue, but also allow to scale the amount of data recorded to a size
                                         which is more suitable for an IoT platform.
                                             In this paper, we present a fused convolutional architecture, named CaloriNet, for the online
                                         estimation of EE in private environments, where RGB images are discarded after the generation of
                                         silhouettes. Our method uses a data-fusion approach by extracting features from image silhouettes
                                         and accelerometer data using a convolutional neural net (CNN), and combining them using fully
                                         connected layers to estimate the calorie expenditure. Our approach is based on the evaluation of
                                         buffers of data collected over a variable interval of time, allowing an online estimation of calories,
                                         rendering the method suitable for energy expenditure monitoring applications. The method was
                                         trained and cross-validated on a publicly available dataset [33]. Our results are compared against
                                         the latest and most accurate accelerometer EE techniques and more traditional METs lookup
                                         tables, obtaining state-of-the-art results.
                                             ∗ a.masullo@bristol.ac.uk
                                             1 The   terms accelerometers, inertial and wearable sensors are used indiscriminately throughout this paper.

                                                                                                    1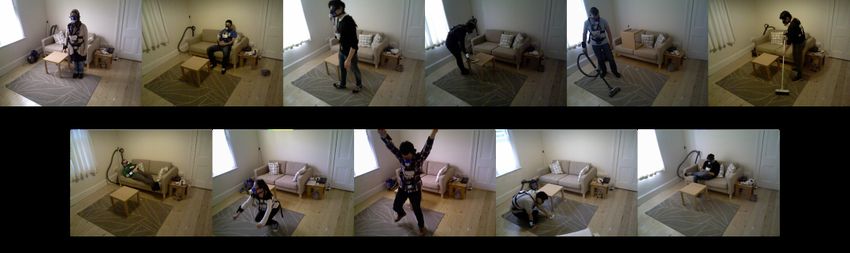
To stress the importance of our data-fusion approach, we also study the contribution of each
modality when used exclusively, by assessing the sub-architectures or branches of our CaloriNet.
We name these branches SiluCalNet and AccuCalNet, respectively for the video and the accelerom-
eter modalities alone. While the fusion approach allows a reduction of the overall error from the
previous state-of-the-art of 1.21 to 0.88 calories/min, these two modalities are independently able
to achieve comparable performances with overall error of 0.98 for AccuCalNet and 0.95 for Silu-
CalNet. These sub-architectures are available as standalone alternatives to the fusion approach,
making our framework suitable for a vision only or wearable only solution.

2    Background and Related Works
The estimation of EE is a very complex problem, as it is not only related to the physical movement
of the subject, but also their metabolism, level of fitness, physiology and environmental conditions,
e.g. temperature, humidity and barometric pressure [12]. Considerable effort has been invested
in the past for characterizing EE using different types of data, including biometric data (i.e.
heart rate monitoring), accelerometers, shoe sensors and cameras. In spite of this variability, EE
is strongly correlated with the type of activity which is performed. In 1993, the Compendium
of Physical Activities [1] presented a table with different physical activities connected to EE,
described as the ratio of working to resting metabolic rates, i.e. METs. These data include
detailed description of activities with their corresponding EE values. While METs tables allow a
very quick estimation of EE, the approach is based on averages and is only reliable in a statistical
sense. Precise measurements of EE are very individual dependent, as different subjects perform
activities in distinctive ways and therefore consume a different amount of energy.
    To allow an individual-dependent measurement, the work from Ceesay et al.[11] proposed a
heart rate monitoring method that models their EE. A large body of research has focussed instead
on the application of accelerometer data to estimate EE. Some works, such as [2] and [3], make use
of activity-dependent models to predict the EE of patients based on the knowledge of the activity
they are performing. For a complete review of accelerometer based EE estimation, the reader is
referred to Altini et al.[4], which investigates the methodologies, sensor numbers and locations
to obtain the best EE model. Their work concludes that one single accelerometer close to the
subject’s centre of mass, combined with an activity-specific estimation model allows for the most
accurate and unobtrusive accelerometer-based EE estimation.
    One of the most important steps in the use of accelerometer data is the selection of the features.
The accelerometer signals are split into contiguous windows, for which a number of frequency
and time domain statistics are evaluated, including average, standard deviation, max/min and
correlation coefficients, among others [15]. The selection of such hand-crafted features allows the
application of standard machine learning algorithms like artificial neural networks [30], random
forests [15] and other regression models [26] - with performances strongly dependent on those
selected features. Zhu et al.[39] proposed the application of CNNs where the raw accelerometer
signal was directly fed into a CNN which automatically learned the features that then allowed a
multilayer perceptron to produce EE estimates with errors up to 35% lower than methods previous
to it. For this reason, Zhu et al.[39]’s method was selected as the baseline for comparison with our
results.
    Computer vision has also been deployed to improve digital health monitoring systems. For
example, [20] and [24] attempted to estimate the calories in food by taking single images or short
videos of them, although they needed to interact with the user to allow continuous monitoring.
Closer to the topic of this paper, Tao et al.[32] proposed a vision-based system which estimated
calorie expenditure using features extracted from RGB-D image data of humans in action. They
showed that RGB-D data can be successfully adopted to estimate EE instead of accelerometers.
This work was later extended by replacing their hand-crafted features with CNN-generated features
[36], showing an overall reduction of the error. However, as already addressed earlier, it may be
critical for healthcare and ambient assisted living (AAL) systems to respect privacy conditions and
only provide video sequences in the form of silhouettes [37]. Under such conditions, methods such
as [32] are not suitable as they require full RGB-D data to estimate EE.
    CNN regression has been successfully applied in computer vision, for example for 3D pose [21],
age estimation [25] and viewpoint evaluation [23]. For medical data, CNNs were applied for the
segmentation of the cardiac left ventricle, parametrised in terms of location and radius [31]. More
recently, a general framework for the analysis of medical images was proposed by Gibson et al.[16],

                                                  2
Figure 1: Examples of silhouettes - Colour and depth images were only used to generate silhouettes
and discarded after the process.

to provide a pipeline that allows segmentation, regression (i.e. prediction of attenuation maps in
brain scans) and image generation using deep learning.
    In this paper, we propose a fused deep architecture which enables the online estimation of
EE in privacy-sensitive settings. The method is described in Section 3, including the estimation
of temporal silhouettes, the network architecture, and the data augmentation. The dataset, our
implementation, and our results are presented in Section 4.

3     Proposed method
We propose CaloriNet for online EE estimation, based on the fusion of image silhouettes and
accelerometers. The proposal builds on the strengths of two modalities for calorie estimation;
(1) visual input that can better recognise the action undertaken [34], yet is at times occluded
and associated with privacy concerns, and (2) wearable accelerometers that are light to carry and
increasingly popular for healthcare monitoring, but require subject cooperation in wearing and
charging the sensors. Thus, we propose an architecture that fuses both modalities, and importantly
only uses the silhouette (i.e. foreground segmentation) from the visual input, as this provides
improved privacy for monitoring in private environments [17].

3.1    Temporal Silhouettes for Calorie Estimation
To support private environments, we propose to limit the visual input to foreground silhouettes.
The method we propose here could use silhouettes extracted from RGB foreground segmentation, or
depth-based segmentation as used in our experiments. We process the RGB images using OpenPose
[10] to detect people and extract the skeletons of the subjects and then perform clustering on the
RGB-D values within each detected bounding box. Some generated silhouettes can be found in
Figure 1. The reader is reminded that RGB-D values are only used to generate the silhouettes and
are discarded after this process.
    The estimation of EE has a strong dependency on monitoring duration, and in particular on the
past activities performed. In order to take this into account, temporal modelling and dependency
must be included in the network architecture. A typical approach for this problem is to feed a
large buffer of images into the network as input, but this would demand a large amount of memory.
Since the silhouettes only contain binary information, we decided to pursue a different approach
and built an average silhouette using a variable number of images. The idea of transforming a
video sequence into a compact representation (to aid our analysis with CNNs) is not new, and
previous examples of similar propositions can be found in works such as [8] and [6].
    As calorie estimation can be better predicted at various temporal scales, we propose to use a
multi-scale temporal template for N time intervals ∆tN of decreasing length, so that:

                                     ∆t1 > ∆t2 > ... > ∆tN .                                   (1)

                                                3
Figure 2: CaloriNet - our architecture combines silhouette data (upper branch, SiluCalNet) and
accelerometer data (lower branch, AccuCalNet) to produce calorie estimation.
For each ∆tk , the silhouettes in the interval [t − ∆tk , t] were selected and averaged:
t
1 X
S̄k = S (i) . (2)
∆tk
i=t−∆tk
This process produces N multi-scale temporal silhouettes S̄k (one for each ∆t), which were then
stacked in a 3D tensor S ∗ , where the 3rd dimension is the stacked multi-scale temporal silhouette:
St∗ ≡ S̄1 , S̄2 , ..., S̄N .
(3)
St∗ is then used for the estimation of the calories at time t. This operation allows us to reduce any
dependency of the network on the choice of the ∆t, facilitating the learning process to pick the
correct channels for the best EE estimation for the various daily actions.
3.2 Network architecture
The CaloriNet architecture is composed of two branches, one for the silhouette data and one for
the accelerometer data, as depicted in Figure 2. The network uses two distinct inputs at time t
to produce the calorie estimation Ct : the multi-channel average silhouette St∗ from Eq. (3) and a
buffer of accelerometer data in the same time interval [t − maxk (∆tk ), t].
A shallow architecture composed of two stacks of layers was adopted. The features extracted
from the silhouettes and acceleration were concatenated and fed into one fully connected layer that
performs a regression over the calories output. The accelerometer branch was inspired by the work
from Zhu et al.[39], although several modifications were performed to achieve better performances
(see Section 4 for the implementation details). The silhouettes branch also uses two stacks of layers
only. In fact, due to the simplistic nature of the data, being originated from binary foreground
images and 6-dimensional accelerometer data, any deeper architecture is likely to overfit the input.
We empirically found this depth to suffice for the task of the EE estimation.
The network is trained end-to-end using the squared error loss function between the estimated
calories Cp and the ground truth CGT over all times t:
X 2
Loss = Cpt − CGT
t
(4)
t
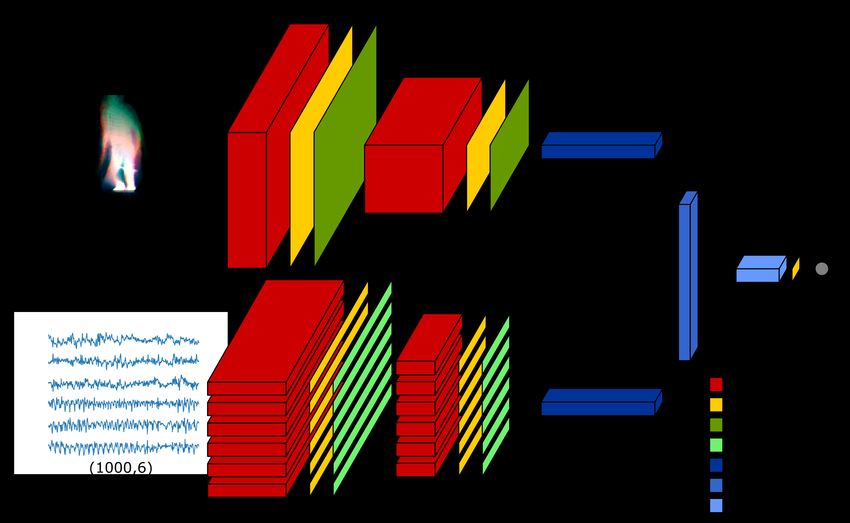
4Figure 3: Sample frames from different subjects and for various activities in the dataset.
3.3 Data augmentation
Due to the limited training data, as well as to remove any bias in the recording location, we applied
the following data augmentation techniques.
Silhouettes: The typical approach for dealing with subjects moving in a frame is to crop the
active area and resize it to a fixed size to use as input for the network [18]. However, this is
not suitable for temporal silhouettes as the size of the averaged image depends on the motion
of the person during the buffered time. To avoid learning specific positions where actions were
performed, data augmentation was implemented. During training, images were randomly flipped
(horizontally), tilted, and translated (horizontally/vertically).
The data augmentation parameters adopted were determined empirically (see next section). Al-
though the augmented data sometimes resulted in subjects being cropped, this matched situations
when subjects were only partially in view of the camera.
Accelerometers: For the accelerometer sensors, inspired by the work from Um et al.[35], we
randomly changed the magnitude of the sensors by multiplying it with a scalar drawn from a
Gaussian distribution with mean 1 and standard deviation 0.1. In addition, the x-y-z channels of
each accelerometer were swapped with random permutations.
4 Experiment Details
Dataset — We evaluate our method on the publicly available dataset from [33], namely SPHERE_RGBD
+ Inertial_calorie. This is the only dataset to include RGB-D and accelerometer input with ground
truth calorie measurements obtained from a clinical Calorimeter for daily activities. The dataset
includes 10 participants, 7 males and 3 females aged between 27.2 ± 3.8 years, with average weight
of 72.3 ± 15.0 kg and average height of 173.6 ± 9.8 cm, resulting in average BMI of 23.7 ± 2.8. Each
participant was recorded with an RGB-D sensor, two accelerometers (mounted on the waist and the
arm) and a COSMED K4b2 portable metabolic measurement system (i.e. a Calorimeter). Eleven
activities, as shown in Figure 3, were performed in a predefined sequence: stand still, sit still, walk-
ing, wiping the table, vacuuming, sweeping floor, lying down, exercising, upper body stretching,
cleaning stain, reading. The dataset presents gaps for some recorded sequences for which we could
not generate any silhouettes. Missing data in the training set was therefore replaced by randomly
sampling input with the same label from the sequences of the same individual.
Figure 4 presents a visual depiction of the calories recorded in the dataset. Each horizontal
bar corresponds to one subject performing the same set of activities. Note that while the calorie
measurements present a certain degree of correlation with the activity performed, each subject
has a different response in terms of EE when performing the same activity. This difference shows
the complexity of the EE problem and highlights the strong limitations of lookup tables when
attempting the predict EE for a specific individual.
Implementation details — The network was implemented and trained in Keras using Tensorflow
as backend2 .
Silhouettes: The input to the silhouette branch of the network is a 240×320×5 tensor, computed
2 Link to code will be available with the publication.
5Figure 4: Our visual depiction of the SPHERE_RGBD + Inertial_calorie dataset. The colour
represents the amount of calories/minute, with black areas indicating missing data.
over 5 time intervals ∆t, defined by,
T
∆tk = , with k = [0, ..., N ] , (5)
3k
where N = 4, and T is the maximum buffer size in the multi-scale silhouette image, set to 1000
frames. This choice of value for T is explored in Section 5. Data augmentation was performed
using a rotation range of θ = ±5◦ and a random shift of tx = ty = ±20% range. The silhouettes
branch of the network architecture, depicted in Figure 2, is formed by two stacks of sequential
convolution-activation-pooling layers, followed by a fully connected layer producing the EE. The
activation function adopted was a rectified linear unit (ReLu), the pooling size was 2 and the
stride length for each layer was also 2. Optimal parameters were found by training each network
for 1000 epochs and selecting the model with the minimum validation loss after at least 30 epochs
of training.
Accelerometers: Using the network proposed by Zhu et al.[39] as a baseline for the accelerometer
branch of CaloriNet, we adopted their architecture of a multi-channel CNN that processes each
component of the accelerometer independently, with two stacks of convolution-activation-pooling,
using respectively 8 and 4 filters, with a kernel size of 5 and a stride length of 2. We replaced the
tanh activation function with a ReLu, increased the input vector from 256 to 1000 elements and
used both the wrist and waist mounted accelerometers as input, combining them into a single 6-
channel input. This produced a tensor input of size 1000 × 6, which was fed into the accelerometer
branch of the network. In addition to that, we also estimated the gravity vector using a Wiener
filter [29] with a window size of 1 second, and subtracted its direction from the accelerometer data.
The baseline model Zhu et al.[39] was implemented without the anthropometric feature vector
(as we have no heart rate data available), and using both accelerometers as per AccuCalNet. We
show that each of these modifications allowed a better estimation of the EE in our tests. Our
implementation of Zhu et al.[39] has higher root mean square error (RMSE) than our proposed
modified version in AccuCalNet for 10 out of the 11 actions (excluding Wipe), as well as the overall
error.
5 Results
The proposed network CaloriNet was tested using leave-one-subject-out cross-validation. As base-
lines, we also show the results obtained from (a) METs lookup tables [1], (b) previous state-of-
the-art on the same dataset from Tao et al.[32] which combined hand-crafted visual (full RGB-D
images) and accelerometer features with an SVM classifier, and (c) the accelerometer network
proposed by Zhu et al.[39]. We also report results on single modalities: AccuCalNet and Silu-
CalNet. Comparative results are presented in Figure 5, showing the per-activity RMSE between
the calories estimated (per minute) and the ground truth, obtained by averaging the errors for
each activity class first, and then considering the mean across the subjects. The overall error was
instead evaluated by averaging all the RMSEs regardless of the activity performed, by considering
the mean across all the subjects.
6Figure 5: Results in terms of average per-activity RMSE for the calorie estimation.
The figure shows that the EE estimation of the lookup table (METs) produces the highest
error, with an overall RMSE of 1.50 cal/min when compared to the Calorimeter device. As already
stated, METs tables are based on statistical measurements and are not suitable for subject-specific
estimations. Tao et al.[32]’s method improves over the the METs table, providing an overall average
error of 1.30 cal/min. Zhu et al.[39], allows an overall improvement of the error for most of the
classes, using accelerometer data only. When compared with the rest of the methods, our proposed
CaloriNet achieves the best results, producing an error which is almost 30% lower than the result
from Zhu et al.[39], with a reduction of the RMSE from 1.21 to 0.88 cal/min.
It order to stress the importance of our results, we also provide a comparison of our proposed
method when accelerometers (AccuCalNet) or silhouettes (SiluCalNet) are used independently.
Results for AccuCalNet already show an overall reduction of the error from 1.21 to 0.98 cal/min
showing the advantage of our proposed modifications. The error reduction is particularly pro-
nounced for low-activity classes like Stand and Sit, which we believe to be due to the high pass
gravity filter that we apply to the raw accelerometer signals. A further reduction of the error is
achieved by SiluCalNet, when silhouettes only are used for the EE, with an overall error of 0.95
cal/min. The RMSE of SiluCalNet is particularly improved compared to AccuCalNet especially
for the Exercise and Stretch activity classes, as these activities are better characterized by the
video sensor.
During our experiments, we noticed that all the methodologies tested struggled to estimate the
calorie expenditure during the activities Exercise and Stretch. We believe this increased error is
due to the high inter- and intra-class variance of these activities, estimated to be respectively 7.3
and 2.3 calories/min for the Exercise class, and 4.0 and 1.0 calories/min for Stretch. These values
appear to be between 20 and 60 times higher than the variance shown by other classes like Sitting or
Walking, as a consequence of the rather small training dataset available. A richer dataset including
subjects with more different metabolisms and performing a wider range of activities would benefit
the reduction of this error.
Sample qualitative results are presented in Figure 6, which shows the continuous calorie pre-
diction for a single individual, evaluated with different algorithms and compared with the ground
truth. We observe very good agreement for CaloriNet and SiluCalNet with the ground truth, while
Zhu et al.[39]’s method shows quite erratic behaviour, missing the peak measurement of calories
during the Exercise activity (the red interval in the ground truth). The METs table only provides
a step-wise prediction, as it only takes into account the labels of the activities performed, with
data missing in those segments where no label was available.
We evaluated the sensitivity of CaloriNet when the buffer size parameter T is varied. For this
test, we adjusted T to 250, 500, 1000 and 2000 frames, and evaluated the overall error for each
buffer size. Results are presented in Figure 7, showing that lower T values produce inferior results
while the method is performing consistently for 1000 ≤ T ≤ 2000 frames.
6 Conclusions
The increasing adoption of healthcare monitoring devices in AAL environments demands the ne-
cessity of privacy-aware video systems. Here, we presented a novel, fused deep architecture for
online estimation of energy expenditure using a combination of image silhouettes and accelerome-
7Figure 6: Comparison of the calories measured for a single subject (Subject 2, Session 2) and the
prediction obtained with different methods. Black lines depict missing data.
Figure 7: Overall error of CaloriNet for different buffer sizes.
ter data. Systems recording such data are, for example, currently being deployed in one hundred
homes [27]. Silhouettes were first combined into a multi-channel average image, which provides
temporal information for different time lengths. We then fed average silhouettes with accelerom-
eter data in a CNN, that extracted features which were in turn fed into a fully connected layer
that estimated the calories expended. We obtained state-of-the-art results in comparison to other
existing approaches while protecting privacy.
References
[1] Barbara E. Ainsworth, William L. Haskell, Arthur S. Leon, David R. Jacobs, Henry J. Mon-
toye, James F. Sallis, and Ralph S. Paffenbarger. Compendium of Physical Activities: classifi-
cation of energy costs of human physical activities. Medicine & Science in Sports & Exercise,
25(1):71–80, 1993.
[2] Fahd Albinali, Stephen Intille, William Haskell, and Mary Rosenberger. Using wearable ac-
tivity type detection to improve physical activity energy expenditure estimation. Proceedings
of the 12th ACM international conference on Ubiquitous computing, page 311, 2010.
[3] Marco Altini, Julien Penders, and Oliver Amft. Energy expenditure estimation using wearable
sensors. In Proceedings of the conference on Wireless Health, pages 1–8, New York, New York,
USA, 2012. ACM Press.
[4] Marco Altini, Julien Penders, Ruud Vullers, and Oliver Amft. Estimating Energy Expen-
diture Using Body-Worn Accelerometers: A Comparison of Methods, Sensors Number and
Positioning. IEEE Journal of Biomedical and Health Informatics, 19(1):219–226, January
2015.
[5] Neil Armstrong, John Balding, Peter Gentle, Joanne Williams, and Brian Kirby. Peak Oxygen
Uptake and Physical Activity in I I to 16-Year-Olds. Pediatric Exercise Science, 2(20):349–358,
1990.
[6] Hakan Bilen, Basura Fernando, Efstratios Gavves, Andrea Vedaldi, and Stephen Gould. Dy-
namic Image Networks for Action Recognition. IEEE Conference on Computer Vision and
Pattern Recognition, pages 3034–3042, 2016.
[7] Giles Birchley, Richard Huxtable, Madeleine Murtagh, Ruud Ter Meulen, Peter Flach, and
Rachael Gooberman-Hill. Smart homes, private homes? An empirical study of technology
8researchers’ perceptions of ethical issues in developing smart-home health technologies. BMC
Medical Ethics, 18(1):1–13, 2017.
[8] A. F. Bobick and J. W. Davis. The recognition of human movement using temporal templates.
IEEE Transactions on Pattern Analysis and Machine Intelligence, 23(3):257–267, March 2001.
[9] A. Byrne and D. G. Byrne. The effect of exercise on depression, anxiety and other mood
states: A review. Journal of Psychosomatic Research, 37(6):565–574, 1993.
[10] Zhe Cao, Tomas Simon, Shih-En Wei, and Yaser Sheikh. Realtime Multi-Person 2D Pose
Estimation using Part Affinity Fields. 2016.
[11] Sana M. Ceesay, Andrew M. Prentice, Kenneth C. Day, Peter R. Murgatroyd, Gail R. Gold-
berg, Wendy Scott, and G. B. Spurr. The use of heart rate monitoring in the estimation of
energy expenditure: a validation study using indirect whole-body calorimetry. British Journal
of Nutrition, 61(02):175, March 1989.
[12] Francesco S Celi, Robert J Brychta, Joyce D Linderman, Peter W Butler, A. T. Alberobello,
Sheila Smith, Amber B Courville, Edwin W Lai, Rene Costello, M. C. Skarulis, G. Csako,
A. Remaley, K. Pacak, and K. Y. Chen. Minimal changes in environmental temperature result
in a significant increase in energy expenditure and changes in the hormonal homeostasis in
healthy adults. European Journal of Endocrinology, 163(6):863–872, December 2010.
[13] Wojtek J. Chodzko-Zajko, David N. Proctor, Maria A. Fiatarone Singh, Christopher T. Min-
son, Claudio R. Nigg, George J. Salem, and James S. Skinner. Exercise and physical activity
for older adults. Medicine and Science in Sports and Exercise, 41(7):1510–1530, 2009.
[14] Cora L. Craig, Alison L. Marshall, Michael Sjöström, Adrian E. Bauman, Michael L. Booth,
Barbara E. Ainsworth, Michael Pratt, Ulf Ekelund, Agneta Yngve, James F. Sallis, and
Pekka Oja. International physical activity questionnaire: 12-Country reliability and valid-
ity. Medicine and Science in Sports and Exercise, 35(8):1381–1395, 2003.
[15] Katherine Ellis, Jacqueline Kerr, Suneeta Godbole, Gert Lanckriet, David Wing, and Simon
Marshall. A random forest classifier for the prediction of energy expenditure and type of
physical activity from wrist and hip accelerometers. Physiological Measurement, 35(11):2191–
2203, December 2014.
[16] Eli Gibson, Wenqi Li, Carole Sudre, Lucas Fidon, Dzhoshkun I. Shakir, Guotai Wang, Zach
Eaton-Rosen, Robert Gray, Tom Doel, Yipeng Hu, Tom Whyntie, Parashkev Nachev, Marc
Modat, Dean C. Barratt, Sébastien Ourselin, M. Jorge Cardoso, and Tom Vercauteren.
NiftyNet: a deep-learning platform for medical imaging. Computer Methods and Programs in
Biomedicine, 158:113–122, May 2018.
[17] J. Hall, S. Hannuna, M. Camplani, M. Mirmehdi, D. Damen, T. Burghardt, L. Tao,
A. Paiement, and I. Craddock. Designing a video monitoring system for AAL applications:
The SPHERE case study. In IET Conference Publications, volume 2016, pages 126–126.
Institution of Engineering and Technology, 2016.
[18] Kaiming He, Xiangyu Zhang, Shaoqing Ren, and Jian Sun. Spatial Pyramid Pooling in Deep
Convolutional Networks for Visual Recognition. IEEE Transactions on Pattern Analysis and
Machine Intelligence, 37(9):1904–1916, September 2015.
[19] Gavin Jancke, Gina D. Venolia, Jonathan Grudin, Jonathan J. Cadiz, and Anoop Gupta.
Linking Public Spaces - Technical and Social Issues. Proceedings of the International Confer-
ence on Human Factors in Computing Systems, (3):530–537, 2001.
[20] Fanyu Kong and Jindong Tan. DietCam: Automatic dietary assessment with mobile camera
phones. Pervasive and Mobile Computing, 8(1):147–163, 2012.
[21] Siddharth Mahendran, Haider Ali, and Rene Vidal. 3D Pose Regression Using Convolutional
Neural Networks. In IEEE Conference on Computer Vision and Pattern Recognition Work-
shops, pages 494–495. IEEE, July 2017.
9[22] Simon J. Marshall and Ernesto Ramirez. Reducing Sedentary Behavior: A New Paradigm in
Physical Activity Promotion. American Journal of Lifestyle Medicine, 5(6):518–530, 2011.
[23] Francisco Massa, Renaud Marlet, and Mathieu Aubry. Crafting a multi-task CNN for view-
point estimation. pages 1–12, September 2016.
[24] Austin Myers, Nick Johnston, Vivek Rathod, Anoop Korattikara, Alex Gorban, Nathan
Silberman, Sergio Guadarrama, George Papandreou, Jonathan Huang, and Kevin Murphy.
Im2Calories: Towards an Automated Mobile Vision Food Diary. In IEEE International Con-
ference on Computer Vision, volume 2015 Inter, pages 1233–1241. IEEE, December 2015.
[25] Zhenxing Niu, Mo Zhou, Le Wang, Xinbo Gao, and Gang Hua. Ordinal Regression with
Multiple Output CNN for Age Estimation. In IEEE Conference on Computer Vision and
Pattern Recognition, pages 4920–4928. IEEE, June 2016.
[26] Amit Pande, Jindan Zhu, Aveek K. Das, Yunze Zeng, Prasant Mohapatra, and Jay J. Han.
Using Smartphone Sensors for Improving Energy Expenditure Estimation. IEEE Journal of
Translational Engineering in Health and Medicine, 3(September), 2015.
[27] SPHERE Project. SPHERE 100 Homes Study. http://irc-sphere.ac.uk/
100-homes-study, 2018.
[28] P. P. Ray. Internet of Things based Physical Activity Monitoring (PAMIoT): An Architectural
Framework to Monitor Human Physical Activity. IEEE Calcutta Conference, pages 32–34,
2014.
[29] Peter Rizun. Optimal Wiener Filter for a Body Mounted Inertial Attitude Sensor. Journal of
Navigation, 61(03):455–472, jul 2008.
[30] J Staudenmayer, D Pober, S E Crouter, D R Bassett, and P Freedson. An artificial neural
network to estimate physical activity energy expenditure and identify physical activity type
from an accelerometer. Journal of Applied Physiology, (17):1300–1307, 2009.
[31] Li Kuo Tan, Yih Miin Liew, Einly Lim, and Robert A. McLaughlin. Cardiac left ventricle seg-
mentation using convolutional neural network regression. In IEEE Conference on Biomedical
Engineering and Sciences, pages 490–493. IEEE, December 2016.
[32] Lili Tao, Tilo Burghardt, Majid Mirmehdi, Dima Damen, Ashley Cooper, Massimo Camplani,
Sion Hannuna, Adeline Paiement, and Ian Craddock. Energy expenditure estimation using
visual and inertial sensors. IET Computer Vision, 12(1):36–47, February 2018.
[33] Lili Tao, Tilo Burghardt, Majid Mirmehdi, Dima Damen, Ashley Cooper, Sion Hannuna,
Massimo Camplani, Adeline Paiement, and Ian Craddock. Calorie Counter: RGB-Depth
Visual Estimation of Energy Expenditure at Home. Lecture Notes in Computer Science,
10116 LNCS:239–251, July 2016.
[34] Lili Tao, Adeline Paiement, Dima Damen, Majid Mirmehdi, Sion Hannuna, Massimo Cam-
plani, Tilo Burghardt, and Ian Craddock. A comparative study of pose representation and
dynamics modelling for online motion quality assessment. Computer Vision and Image Un-
derstanding, 148:136–152, July 2016.
[35] Terry Taewoong Um, Franz Michael Josef Pfister, Daniel Pichler, Satoshi Endo, Muriel Lang,
Sandra Hirche, Urban Fietzek, and Dana Kulić. Data Augmentation of Wearable Sensor Data
for Parkinson’s Disease Monitoring using Convolutional Neural Networks. 2017.
[36] Baodong Wang, Lili Tao, Tilo Burghardt, and Majid Mirmehdi. Calorific Expenditure Esti-
mation Using Deep Convolutional Network Features. In 2018 IEEE Winter Applications of
Computer Vision Workshops (WACVW), pages 69–76. IEEE, mar 2018.
[37] Przemyslaw Woznowski, Xenofon Fafoutis, Terence Song, Sion Hannuna, Massimo Camplani,
Lili Tao, Adeline Paiement, Evangelos Mellios, Mo Haghighi, Ni Zhu, Geoffrey Hilton, Dima
Damen, Tilo Burghardt, Majid Mirmehdi, Robert Piechocki, Dritan Kaleshi, and Ian Crad-
dock. A multi-modal sensor infrastructure for healthcare in a residential environment. In IEEE
International Conference on Communication Workshop, pages 271–277. IEEE, June 2015.
10[38] Che Chang Yang and Yeh Liang Hsu. A review of accelerometry-based wearable motion
detectors for physical activity monitoring. Sensors, 10(8):7772–7788, 2010.
[39] Jindan Zhu, Amit Pande, Prasant Mohapatra, and Jay J Han. Using Deep Learning for Energy
Expenditure Estimation with Wearable Sensors. 17th International Conference on E-health
Networking, Application & Services, pages 501–506, 2015.
[40] Martina Ziefle, Carsten Röcker, and Andreas Holzinger. Medical technology in smart homes:
Exploring the user’s perspective on privacy, intimacy and trust. International Computer
Software and Applications Conference, pages 410–415, 2011.
11You can also read