Senseable City Lab : Massachusetts Institute of Technology
←
→
Page content transcription
If your browser does not render page correctly, please read the page content below
Senseable City Lab :.:: Massachusetts Institute of Technology
      This paper might be a pre-copy-editing or a post-print
  author-produced .pdf of an article accepted for publication. For
    the definitive publisher-authenticated version, please refer
           directly to publishing house’s archive system

                            SENSEABLE CITY LAB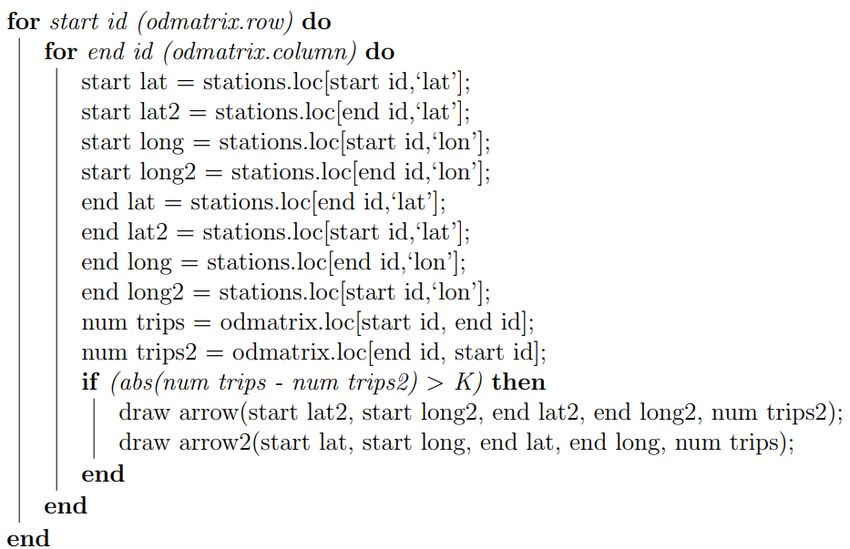
Optimizing Bike Sharing System Flows Using
 Graph Mining, Convolutional and Recurrent Neural
                    Networks
        Davor Ljubenkov                                             Fábio Kon                                               Carlo Ratti
       Senseable City Lab                                  Department of Computer Science                              Senseable City Lab
Massachusetts Institute of Technology                         University of São Paulo                           Massachusetts Institute of Technology
          Split, Croatia                                         São Paulo, Brazil                                      Cambridge, USA
      0000-0002-6587-7693                                      0000-0003-3888-7340                                        ratti@mit.edu

Abstract—A Bicycle-sharing system (BSS) is a popular service                        Boston area BSS is a medium-sized BSS with a different
scheme deployed in cities of different sizes around the world.                  amount of data and a distinct topology compared to other
Efficiently keeping bicycle-sharing system as balanced as                       larger bicycle-sharing systems. This specific size-wise
possible is the main problem and thus, predicting or minimizing                 property may incur a particular dynamics dissimilar from
the manual transportation of bikes across the city is the prime                 those investigated by other papers, which mostly focus on
objective in order to save logistic costs for operating companies.              New York City dataset. Such papers might favour methods
The purpose of this paper is two-fold: Identification of spatial                that perform well for large BSS, and overlook simplified
structures and their structural change using Convolutional                      methods that would work better for small and medium-sized
neural network (CNN) that takes adjacency matrix snapshots of
                                                                                BSS. A further challenge is to make sure that the proposed
unbalanced sub-graphs, and the Long short-term memory
                                                                                method is computationally efficient and can successfully use
artificial recurrent neural network (RNN LSTM) in order to
find and predict its dynamic patterns. As a result, we are
                                                                                more data than any other paper as no other previous study
predicting bike flows for each node in the possible future sub-                 analyzed more than two years worth of data.
graph configuration, which in turn informs bicycle-sharing                          As far as we know, only Ai Yi et al. [5] addressed using
system owners to plan accordingly. Benefits are identified both                 Convolutional Long short-term memory (Conv-LSTM), but
for urban city planning and for bike-sharing companies by                       their work was focusing only on dockless bikes, the weather
saving time and minimizing their cost.                                          was not taken into consideration and rebalancing was never
                                                                                discussed.
    Keywords—data science, data visualization, bike-sharing
systems, graph mining, time series prediction, machine learning,                   The main problem identified is a fleet management
deep learning, recurrent neural networks, convolutional neural                  problem of medium-sized docked bicycle-sharing systems.
networks, shareable cities, urban informatics
                                                                                    In order to keep docked BSS as balanced as possible,
                      I. INTRODUCTION                                           bikes are manually transported across the city at peak times.
    Currently, there are not many state-of-the-art methods that                 In priority areas, docking stations are continually replenished
use graph mining and machine learning in the area of BSS                        with bikes or the bikes being continuously removed from
optimization of bike relocation strategies.                                     docking stations.

   Recently published papers implemented Recurrent neural                           Research question investigates how it is possible to predict
network (RNN) to predict station level demand [1] of New                        both spatial configuration and flow dynamics of bike stations
York's Citi Bike dataset and used Root mean square error                        in order to match or approximate to the discrepancy of the
(RMSE) as a validation metric [2]. However, the global                          supply and demand within the network balance.
overview of the network is not considered, and the method has                      Preferred methods utilized would need to focus on analysis
never been used for small to medium-sized bike-sharing                          and prediction of both spatial and temporal attributes that bike
networks but exclusively on the New York City dataset.                          flows inherently have. This is something that graph mining
Moreover, NYC bike-sharing system Citi Bike has already                         and machine learning can successfully address. Directed
been optimized using a specially tailored operations research                   graph mining would provide a sufficient statistical analysis of
algorithm devised at Cornell University [3].                                    BSS, while different types of neural networks can predict bike
    To the best of our knowledge, there was only one attempt                    flow attributes and track configuration changes.
by Lei Lin et al. [4] that addressed the Convolutional neural                      The knowledge gap to be explored in this paper includes a
network (CNN) using Graph convolutional neural network                          combination of improvements based on the research papers
with data-driven graph filter (GCNN-DDGF) model for                             written during the last three years in the domain of bike-
station level hourly demand prediction in a large-scale bike-                   sharing and rebalancing optimization:
sharing network. Although this paper by Lei Lin et al.
proposes quite an efficient method, it does not consider using                        •     focus on the middle-sized docked BSS that have not
the method as a component in a comprehensive framework for                                  been explored in detail before
dynamic bike rebalancing. Bike rebalancing is defined as a
                                                                                      •     using secondary datasets such as the weather
strategy to restore the number of bikes in each station in order
                                                                                            information
to maximize possible mobility routes. Also, the proposed
model does not apply a directed graph, and it cannot learn a                          •     combine mobility flows for both spatial and temporal
sparse graph filter.                                                                        patterns

978-1-7281-0903-9/20/$31.00 ©2020 IEEE

  Authorized licensed use limited to: KTH Royal Institute of Technology. Downloaded on June 17,2020 at 13:56:37 UTC from IEEE Xplore. Restrictions apply.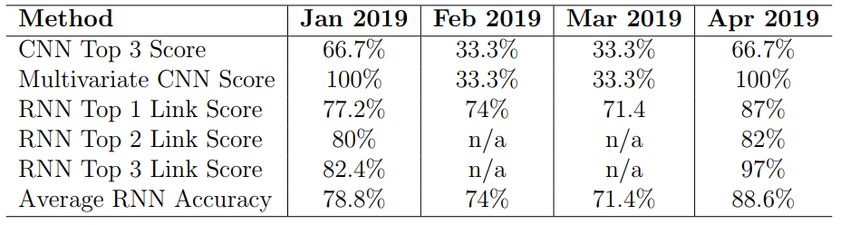
•     use a method that does not only predict, but also                         Finally, from the predicted adjacency matrix snapshot, it
          suggests how the bike rebalancing strategy should be                  is clear which station pairs we have. For those stations, LSTM
          utilized                                                              RNN will be utilized to predict two-way flows between station
                                                                                pairs and calculate the difference. The difference gained is an
    •     make a scalable rebalancing strategy so that it can be                indication of a unbalance, and we can use the ground truth to
          viewed not only from the entire system's point of                     rate the accuracy of prediction. The predicted differences are
          view but also from the municipality or                                precious to bike-sharing companies as they can plan how
          neighbourhood level                                                   many additional bike truck to dispatch and where during their
    •     computational complexity is low, and the utilized                     bike relocation process.
          method does not require hours to calculate the final                  B. Data Description
          result
                                                                                    To illustrate the methodology of this case study, seven
    •     prediction accuracy is still high enough and                          years worth of data from the Boston BlueBikes BSS was used.
          comparable to other approaches                                        Bike-sharing data was collected from the BlueBikes website,
                                                                                the largest Boston bike-sharing provider. Boston is a relatively
    •     research results provide a possible application for the               bike-friendly city, having received a silver medal award from
          Boston Bluebikes BSS, having a validated                              the League of American Bicyclists in 2017. From 2007 to
          approximation of how many bike truck will be                          2014, the bicycle lane mileage in Boston went from 0.03 miles
          needed and which areas will most likely require a                     (0.048 kilometres) to 92 miles (148.06 kilometres), with a
          rebalancing process                                                   decrease in bicycle accidents around 14% per year. Boston's
                 II. MATERIALS AND METHODS                                      original bike-sharing system, Hubway, was launched in 2011
                                                                                and it has been growing since then. In 2018, its name changed
A. Process                                                                      to BlueBikes, and it now has over 1800 bicycles and 308 dock
    Firstly, raw data is obtained, prepared and cleaned, with                   stations across Boston, Brookline, Cambridge, and
the secondary dataset (weather information) aggregated to it                    Somerville. In the proposed analysis, nearly 8 million bike
and made it suitable for performing time-series analysis. Our                   trips have investigated since the inception of the bike-sharing
benchmark is found in an Autoregressive moving average                          program.
(ARIMA) method that uses basic data properties, such as                             Initially obtained descriptive statistics for Boston Blue
mean and average, to set up the most rudimentary                                Bikes data helps us understand usage patterns extracted from
performance score defined as a lower bound to which we can                      the data between 2011 and 2018.
compare every new method introduced. Simple recurrent
neural network and deep recurrent neural network were                               We can observe the evolution of the total number of trips
investigated, but ultimately Long short-term memory (LSTM)                      per day for the entire bike-sharing system. One can see both
is found to be the one producing the best prediction scores.                    strong seasonal effects caused by the typical harsh winters in
                                                                                Boston, and the overall tendency for an increase in usage over
    Then, based upon the data exploration discovery, the most                   the six years, which is confirmed by the 12-month rolling
unbalanced links between station pairs are defined and                          average plotted. The men and women ratio shows not only that
transformed into adjacency matrices, also called, "snapshots.''                 men use bike sharing more frequently but also that the
Our total observation period must be split into strictly defined                difference increases during the wintertime. Finally, the figure
smaller time frames. Each time frame will be represented by a                   also shows a slight increase in the proportion of female users
matrix and a list of the most unbalanced links. Depending on                    in the past year. The cities of Boston, Cambridge, and
how many unique unbalanced stations we observe across all                       Somerville have been improving the quality and extension of
of our specified time frames, their total number will define our                their cycling infrastructure as women feel more comfortable
final size of every adjacency square matrix. The population of                  and secure in the cycling tracks, the gap in usage for men
matrices with non-zero values will depend upon the time                         decreases [6,7].
frame they capture and specific unbalanced station pairs we
observe within each time frame. In this paper, each adjacency                   C. Mobility Flows
matrix is designed to represent the top three most unbalanced                       Understanding where the significant flows of cyclists are
links in a monthly manner, with a total period of two years.                    located within a city is the first step in providing urban
For each month, the top three most unbalanced links represent                   planners with the knowledge required to draw a good mobility
those station pairs that have the highest flow difference.                      plan for urban cycling. Most previous work on BSS data
                                                                                analysis focuses on analyzing usage patterns of individual
    Afterwards, we once again use data exploration for only
                                                                                dock stations, without investigating the movements from one
the first few days of each month for which we seek to predict
                                                                                place to another, such as the origin-destination pairs of bike
an overall adjacency matrix of the most unbalanced links. First
                                                                                trips, which can provide interesting insights on the punctual
few days, which correspond to the 1/3 of overall monthly
                                                                                dynamics of the system [8,9,10,11].
flows, are transformed into an adjacency matrix that we use as
an input for Convolutional neural network (CNN). Here, an
assumption is made that first 1/3 of the monthly flows tend to
converge to a specific monthly shape that CNN will guess
based on all the previous monthly snapshots it is trying to learn
from. As an output, CNN gives as a guess label that best
describes the month (or instead of its unbalanced spatial
configuration) as a whole. Additionally, multivariate LSTM
method can be used to introduce some novelty links to the
labels predicted in order to score a higher prediction accuracy.

  Authorized licensed use limited to: KTH Royal Institute of Technology. Downloaded on June 17,2020 at 13:56:37 UTC from IEEE Xplore. Restrictions apply.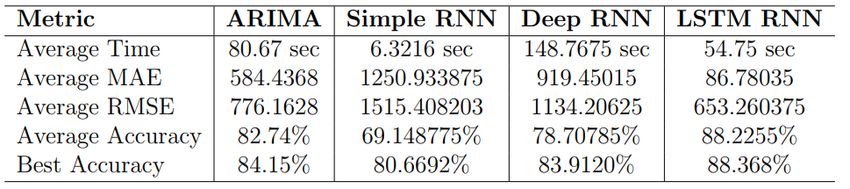
Fig.1. Heatmap and Mobility Flows visualization
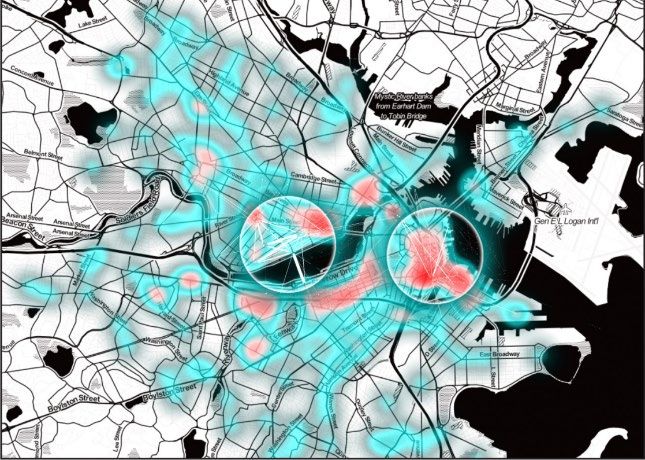
Fig. 2. Unbalanced Pairs algorithm
An important visualization method is the one where
mobility flows are represented as a directed graph. With the The best ratio between runtime, accuracy and low error
help of this method, it is possible to define most pairwise metrics is observed in LSTM RNN method (as observed in
asymmetric links between the nodes, which are of extreme Table 1), which was chosen as a candidate to be used for this
importance in this paper. Firstly, they contain the mobility research.
flows most responsible for the unbalanced network, which, in Pairwise most asymmetric edges between nodes
turn, causes a more frequent need for bike relocation. representing most unbalanced flows between stations are
Secondly, these nodes will be used as a subgraph input for the transformed into adjacency matrices and prepared as an input
Convolutional neural network (CNN) to gain an insight into for the convolutional neural network. Before running the
future patterns that are most likely to be expected. CNN model, a training set of matrices needs to be labelled
This intuition that pairwise asymmetric links could be because the goal of this method is to make sure that CNN
beneficial was confirmed by comparing the animated heatmap correctly classifies test matrices to a correct label. In case of
visualization of flow density (check-ins and check-outs, see a false classification, we still want to maintain those errors to
Fig. 1) progression through different days and months, to the be spatially close to the expected stations, thus making
appearance of the most unbalanced pairs corresponding to the mistakes as minimal as possible.
same time frame. E. CNN Spatial Structures Identification
Moreover, using the most unbalanced pairs (algorithm The first step is to take so-called data "snapshots" of the
shown in Fig. 2) as an indication of bike shortage or directed subgraph that is formed by the most unbalanced
abundance, it is possible to uncover some hidden problem stations and their links. These snapshots have a specific time
areas that are not so easily visible with the heatmap granularity so that we can observe different unbalanced
visualization. Also, having unbalanced pairs, we know where graphs for each year, month, week, or day. Suppose that the
we should add or take bikes from when applying the relocation granularity is monthly, which means that during one year
policy. This is something that would not be possible by just worth of time, we will have 12 unbalanced graphs. In the case
observing clusters during peak hours. Moreover, having discussed here, we will take years 2017 and 2018 into
subgraph of unbalanced pairs defined as an adjacency matrix consideration amounting to a total of 24 distinct unbalanced
data structure is an advantage when using it as an input for graphs when considering monthly granularity. In order to be
Convolutional neural network (CNN). able to use CNN, it is necessary to transform these
unbalanced graphs into 24 adjacency matrices consisting of
By plotting a representation of some 2018 unbalanced zeroes and ones, where each value “1” indicates that there is
edges for each month separately, it can already be seen that a directed edge from the station represented as matrix row
although the spatial configuration of these unbalanced with index “i” to the station denoted as a matrix column with
subgraphs changes, some clear pattern rules can be concluded. index “j”, for that specific tuple (i,j). Of course, because we
For example, most of the unbalanced edges are concentrated are dealing with bidirectional unbalanced graphs, adjacency
in the Cambridge city centre, but during warmer months, matrices will be symmetric, and also hollow meaning that we
subgraphs tend to expand to the very edges of the BSS can observe only zero values on the main diagonal, thus
network. avoiding nodes with self-loops. Now, these sparse matrices
D. RNN Dynamic Patterns Prediction can simply be imagined as pixelated images where “1”
indicates a pixel existence, and it is something that can be
A comparison between different predictive methods for sent as an input to CNN. However, when transforming graphs
time-series data was examined, using the aggregated number into matrices, we advise that relative coordinates between
of bike check-outs for each day, and the secondary dataset stations match the allocation of the row and column indexes
containing weather details. Best prediction method was used inside the matrix. This was done by observing a Greater
on individual stations identified as the most unbalanced and Boston area map and scanning from a top left corner to the
obtained separately as an output of CNN. The process of bottom right corner, numerating each larger neighbourhood
choosing the best RNN prediction method was dependent in the process. Then, for each neighbourhood area map, the
upon the validation metrics retrieved and the particular set of same scanning method was used to numerate bike stations. In
parameters defined within the prediction model itself. other words, created matrices resemble the spatial
representation of unbalanced stations in the real world.
Authorized licensed use limited to: KTH Royal Institute of Technology. Downloaded on June 17,2020 at 13:56:37 UTC from IEEE Xplore. Restrictions apply.TABLE I. COMPARATIVE ANALYSIS training dataset but using this method mitigates such
problem.
A model chosen for predicting such a candidate is called
convolutional multivariate LSTM model. Although this
model is capable of vector output, we will only consider the
first predicted item because multi-step prediction becomes
Although this particular approach will not create a very inaccurate as further into the future the model tries to
significant difference for neural networks as long as we keep extrapolate.
bike stations of the same neighbourhoods clustered together,
III. RESULTS
it is an attempt for pixelated matrices to still make some sense
to humans. Of course, these heuristics were used just to By applying a methodology described in this paper, it is
simplify manual translation of graphs into matrices for this possible to use a computationally lightweight combination of
paper. For larger matrices and bigger datasets, we advise to machine learning methods to grasp short-term approximation
completely automate numeration and translation of graphs and prediction of spatial structures in the form of subgraphs,
into matrices, as well as using only half of the created together with a more robust prediction of dynamic patterns
matrices because they are all square symmetric matrices and and flows through the identified most unbalanced links. As a
encoded data is duplicated above and below its main result, this method allows bike-sharing companies to make a
diagonal. This is due to the symmetric nature of the month-long prediction on how many trucks for bike relocation
unbalanced pairs definition. will they need and in which streets or areas will they be most
essential. The bottleneck of this paper is its CNN segment due
Prepared training data, which is being provided to CNN to the inability to predict something that had never been
as an input (see Fig. 3), consists of 24 pixelated images with observed before. Still, this paper offers an approach that has
size 20x20. Each image represents the top three most not yet been considered. Also, shortcomings of CNN are
unbalanced pairs of stations for one particular month. slightly alleviated using a subtle method of predicting
Coloured pixel is an indication of an edge between the station monotonic properties and workload trends of certain stations.
“i” and “j”, where “i” and “j” are identification numbers of This is done by observing their past bike flow values as an
those two stations. Not only is it an indication of an edge but integer array and predicting the most likely future array of
an unbalanced link between them. Training data will be used numbers. This enables adding possible novel links in case an
for CNN to observe and learn from all past configurations and emergence of high or low flow values would make a
try to guess which of the pre-existing shapes would match the detectable impact in relation to some other station. In such
best each of the test data sets we will additionally provide. cases, we would conclude that certain pairs have the potential
F. Candidate Novelty Links of becoming unbalanced and that we could add them as a
novel link in addition to the existing ones.
In order to strengthen the achieved CNN prediction, we
will carefully consider adding a possible surprise link to the As demonstrated in Table 2, we can predict most of the top
predicted configuration, which has the highest probability of unbalanced station tuples, and quantify the expected
emerging as a future most unbalanced link in addition to the unbalanced flow between them with high accuracy. Of course,
ones already contained within the predicted label. Only those during more unstable months such as February and March,
links that have been fairly recently emerging close, but not when a heavy snow season is expected in Boston, predicting
quite to the top three most unbalanced spots, can be spatial configuration can perform with lower accuracy than
considered as candidates for this analysis. Additionally, one usual. This is, however, something that can not be mitigated
of the top three unbalanced candidates can be considered as in case of small tor medium BSS. In order for this project to
well in case we observe that CNN completely skipped it be fully evaluated, the methodology presented in this paper
during label prediction. This happens because of the small should be implemented within the real-life Boston Blue Bike
relocation strategy and achieved results compared to the same
period in the past. In the evaluation of results, average RNN
accuracy is calculated as a mean value between RNN top link
scores.
TABLE II. EVALUATION OF RESULTS
Moreover, the proposed methodology can be easily scaled
up or scaled-down, depending on the spatial granularity we
would like to focus on (neighbourhood, town or municipality).
Of course, whenever we are expanding or shrinking our
spatio-temporal viewpoint, a new set of stations will be
inspected and thus, completely new matrices should be
prepared accordingly. This is also a shortcoming because as
Fig. 3. CNN Training Data the number of relevant stations is growing, matrices expand as
Authorized licensed use limited to: KTH Royal Institute of Technology. Downloaded on June 17,2020 at 13:56:37 UTC from IEEE Xplore. Restrictions apply.well. Not only that but even in a case when only one station new customers and users. Ultimately, the goal of this paper is
should be added, the whole matrix must be re-arranged to to work towards an overarching scope of creating more
mimic the station configuration in the real world. Luckily, any sustainable and smarter cities, and many of related positive
changes in the number of docks do not affect the model, and effects in the area of bike-sharing networks are following
that is why docks were not considered. This trade-off was "The 2030 Agenda for Sustainable Development Goals
necessary in order to ensure low memory and short model (SDG)”, adopted by United Nations (UN)
runtime requirements because short-term prediction should
benefit from fast results, satisfactory prediction accuracy and VI. FUTURE WORK
model adaptability to be utilized for any BSS. There are many areas in the domain of BSS optimization
and prediction that could be upgraded or further explored,
IV. LIMITATIONS including methods presented here. Building upon a proposed
The very first limitation is noticeable in the usage of CNN architecture could be one of such suggestions. Because
exclusively docked BSS data. It is important to mention that this paper heavily relies on graph theory, one of the advanced
dockless bike companies in the US and EU are not GCNN models could be utilized. Moreover, when one has to
comfortable with sharing their data due to, among others, user deal with data defined on non-Euclidean domains, the
privacy issues. In cases where companies agree to such definition of basic operations (such as convolution) becomes
collaboration, the process of obtaining any usable dockless rather elusive. In that aspect, the Geometric Deep Learning
BSS data involves a complicated legal procedure, signing (GDL) area deals with the extension of ML techniques to
non-disclosure agreements and generally takes a very long graph and manifold structured data.
time.
Another possibility could be to compare docked and
Dockless data policies differ in China, but such an dockless bike systems and explore how the ML approaches
approach was not taken into consideration due to a high inflow prediction to coincide or differ one from another. Still,
volume of papers already written and specifically based upon methods used would need to be adjusted to the fact that data
these areas. Also, dockless systems or fourth-generation bike available for both docked and dockless BSS is still very
systems are much more popular in China compared to the rest sparse, except for bigger systems in China. Taking a whole
of the world. Over 30 private companies are operating there, another perspective, data scarcity could be mitigated and
while dockless bikes are still in an experimental phase in both substituted with relevant secondary datasets. This additional
of the Americas and Europe. dataset could introduce other modes of transportation
(walking or vehicle based), or even socio-economic landscape
Regarding the second limitation, it is not possible to and real estate market prices, which could vary depending on
produce the model with a perfect prediction accuracy or their proximity to mobility hubs.
retrieve the highest precision of label assignment. This means
that there will always be an error present depending on the One sharing system research area that had never been
volume of our data, implementation details of the specific explored in depth before, and just started flourishing recently
model used, computation complexity and a variety of other is an electric vehicle sharing systems study domain. This is an
variables, some of which are stochastic and therefore, out of even greater challenge because, in addition to all the problems
our control. Still, establishing a performance baseline, tackled in regular sharing systems, we also have to add the
defining model setups, and knowing our lower and upper electric power requirement variable and think about
bound is supposed to help us define our limitations optimizing power distribution for such vehicles. Many new
empirically and mitigate any unwanted performances. sharing transportation options are taking advantage of this
power source beside just bikes: scooters, mopeds, and even
V. ETHICS AND SUSTAINABILITY skateboards which are planned to be added in China. Having
Due to the increasing pervasiveness of machine learning, a variety of new ride-sharing systems and many new
there must be a discussion about the safety, transparency and companies grow their businesses across countries, research
bias of machine learning systems. However, in the BSS, the required in exploring these networks through the lens of ML
focus is mainly on rebalancing, and even though information and AI will be in demand now more than ever.
such as bike ID number, gender and user type is available, it
is not used to identify individuals. The bike-sharing ACKNOWLEDGEMENT
companies, however, may be storing user's personal A big thank you goes to my supervisor Amir H. Payberah
information from the moment they register for the service, at KTH for his support I received throughout my research.
but the data is never publicly disclosed. From the company's Also, many thanks to my examiner Šarūnas Girdzijauskas at
perspective, in case they are using a more attribute-wise KTH as his reviews noticeably improved this research paper.
detailed data, they should be ensuring that a machine learning Special thanks to MIT SCL and my external supervisors Carlo
model does not leak its training data to an adversary that Ratti (Senseable City Lab Director), Fábio Duarte and Paolo
might be able to intercept a large number of queries, and in Santi (SCL Principal Research Scientists), as well as all the
turn, see the statistics of the output distribution and cross- amazing Senseable colleagues and friends I was privileged to
reference it to recover the original data. In addition to data- work alongside with. Additional gratitude goes to MIT
driven ethical considerations, it is possible to infer from the visiting professor and researcher Fábio Kon (paper
data in case a bike had been stolen and in that case, a company contributor), who helped me gain insight into the statistical
should have regulations to investigate how and when to act if analysis and data exploration segments based on his very own
such events occur. prior research.
Using bike-sharing services reduces carbon footprint and REFERENCES
promotes a healthy lifestyle [12,13,14,15,16]. Optimization
[1] P.-C. Chen, H.-Y. Hsieh, X. K. Sigalingging, Y.-R. Chen and J.-S. Leu,
of environment-friendly transportation will effectively attract "Prediction of station level demand in a bike-sharing system using
Authorized licensed use limited to: KTH Royal Institute of Technology. Downloaded on June 17,2020 at 13:56:37 UTC from IEEE Xplore. Restrictions apply.recurrent neural networks," IEEE 85th Vehicular Technology bicycle-sharing system (bixi) in Montreal,” Journal of Transport
Conference, 2017. Geography, December 2014.
[2] R. C. Zheng, “Predicting bike sharing demand using recurrent neural [10] A. Sarkar, N. Lathia, and C. Mascolo, “Comparing Cities Cycling
networks,” Procedia Computer Science 147:562-566, 2019. Patterns Using Online Shared Bicycle Maps,” Transportation, Volume
[3] D. Freund, S. G. Henderson, E. O’Mahony, and D. B. Shmoys, 42, Issue 4, pp 541559, April 2015.
“Analytics and Bikes: Riding Tandem with Motivate to Improve [11] X. Wang, G. Lindsey, J. E. Schoner, and A. Harrison, “Modeling bike
Mobility,” Interfaces, 2019. share station activity: Effects of nearby businesses and jobs on trips to
[4] L. Lin, Z. He, and S. Peeta, “Predicting station-level hourly demand in a and from stations,” Journal of Urban Planning and Development,
large-scale bike-sharing network: A graph convolutional neural March 2016.
network approach,” Transportation Research Part C: Emerging [12] T. L. Susan Shaheen, “Reducing greenhouse emissions and fuel
Technologies Volume 97, December 2018. consumption: Sustainable approaches for surface transportation,”
[5] A. Yi, Z. Li, M. Gan, Y. Zhang, D. Yu, W. Chen, and Y. Ju, “A deep IATSS Res. 31, 6-20, 2007.
learning approach on short-term spatiotemporal distribution [13] Y. Zhang and Z. Mi, "Environmental benefits of bike-sharing: A big
forecasting of dockless bike-sharing system,” Neural Computing and data-based analysis," Applied Energy, vol. 220, issue C, 296-301,
Applications, April 2018. 2018.
[6] A. C. Lusk, P. G. Furth, P. Morency, L. F. Miranda-Moreno, W. C. [14] K. Sælensminde, “Cost-benefit analyses of walking and cycling track
Willett, and J. T. Dennerlein, “Risk of injury for bicycling on cycle networks taking into account insecurity, health effects and external
tracks versus in the street,” BMJ Publishing Group Ltd, 2011. costs of motorized traffic,” Transportation Research Part A Policy and
[7] J. Garrard, S. Handy, and J. Dill, “Women and cycling,” MIT Press, 2012. Practice 38(8):593-606, October 2004.
[8] O. OBrien, J. Cheshire, and M. Batty, “Mining bicycle sharing data for [15] O. Pekka, S. Titze, A. Bauman, B. D. Geus, P. Krenn, B. Reger-Nash,
generating insights into sustainable transport systems,” Journal of and T. Kohlberger, “Health benefits of cycling: a systematic review.”
Transport Geography 34, 2014. Scand J Med Sci Sports., August 2011.
[9] A. F. Imani, N. Eluru, A. M. El-Geneidy, M. Rabbat, and U. Haq, “How [16] R. J. Shephard, “Is active commuting the answer to population health?”
land use and urban form impact bicycle flows: evidence from the Sports Med., 2008.
Authorized licensed use limited to: KTH Royal Institute of Technology. Downloaded on June 17,2020 at 13:56:37 UTC from IEEE Xplore. Restrictions apply.You can also read