Solid Domestic Waste classification using Image Processing and Machine Learning
←
→
Page content transcription
If your browser does not render page correctly, please read the page content below
Solid Domestic Waste classification using Image Processing and
                         Machine Learning

                                 Daniel Otero Gómez1

                                         Advisors:
                                 Mauricio Toro Bermúdez2
                                 William Hoyos Morales3

                                     Research practice I
                                     Research proposal
                                  Mathematical Engineering
                             Department of Mathematical Sciences
                                     School of Sciences
                                     Universidad EAFIT

                                         January 2021

1
  Mathematical Engineering Student at Universidad EAFIT (CvLAC: Daniel Otero Gómez)
2
  IT and Systems Department professor at Universidad EAFIT mtorobe@eafit.edu.co
3
  Doctoral Student at Universidad EAFIT whoyos@correo.unicordoba.edu.co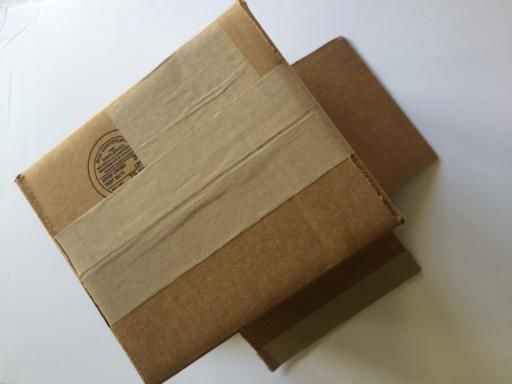
Abstract
          This research concentrates on a bounded version of the waste image classification problem.
     It focuses on determining the more useful approach when working with two kinds of feature
     vectors, one construed using pixel values and the second construed from a Bag of Features (BoF).
     Several image processing techniques such as object centering, pixel value re scaling and edge
     filtering are applied. Logistic Regression, K Nearest Neighbors, and Support Vector Machines
     are used as classification algorithms. Experiments demonstrate that object centering significantly
     improves models’ performance when working with pixel values. Moreover, it is determined that
     by generating sufficiently simple data relations the BoF approach achieves superior overall results.
     The Support Vector Machine achieved a 0.9 AUC Score and 0.84 accuracy score.

     Keywords: Machine Learning, Image Classification, Image Processing, Bag of Features, Support
     Vector Machine

1    Introduction
Waste treatment has become a heavily relevant topic due to the important social, environmental,
and economical consequences that carry such activity. Inappropriate debris management may
cause several natural damages such as soil, water, and air pollution, in addition to pubic health
deterioration (Aguilar-Virgen et al., 2010). Research indicates that since 1950 8.3 billion tons of
solely plastic were produced. Moreover, 6.3 billion tons were disposed as debris, from which 9%
were recycled, 12% were incinerated, and 73% were located in landfills (Geyer et al., 2017). This
is highly alarming due to the fact that the expected time of soil destruction of non-organic wastes
is quite long. For instance, glass lasts one million years to be completely destroyed, and plastic,
depending of the type, may vary from 58 to 1200 years (Chamas et al., 2020) (Mohajerani et al.,
2017). Appropriate waste management must not be underestimated.

    Solid Domestic Waste (SDW) corresponds to solid elements of day-to-day use that are discarded
by households and several commercial and community centers, such as malls, workplaces, universities,
etc. Plastic and glass bottles, food containers, soda cans, paper, or cardboard are just a few of the
garbage that can be labeled as a SDW. An inter-continental study performed in 22 different countries
determined that, in average, households contribute 55-88% of municipal solid wastes and that market
and comercial areas contribute a 10-30% (Abdel-Shafy & Mansour, 2018). Since SDW is produced
at such a high density and intensity it is crucial that a correct treatment is given to it.

    Waste classification plays a major role in the waste treatment cycle since it allows to segregate
wastes in order to prevent environmental damages and collect recyclable wastes. For example,
useful SDW treatment allows that local community rubbish is recycled or reused in other processes
(Aguilar-Virgen et al., 2010). Despite the importance of such practices there is plenty of things
to be done about waste management. Most recycling systems rely on human force for debris
decomposition, practices that are both expensive and time consuming. Furthermore, citizenship
has failed to acquire proper environmental practices. According to a study made in Colombia in
2020, 78% of households do not recycle their wastes (Semana, 2020) (Andesco, 2020).

   Such issues have motivated the scientific community to work on technological developments
that contribute to the solution of these problems. Some of the main efforts focus on automatizing
waste classification at different levels. Research scopes can vary from the development of mobile

                                                      1
apps, embedding classification models in cameras located in trash cans, to the automatization of
industrial and mass waste treatment (Toğaçar et al., 2019) (Mittal et al., 2016) (Ozkan et al.,
2014). Additionally, garbage bin level detection has also become popular topic among the scientific
community (Hannan et al., 2012) (Arebey et al., 2011).
This research is going to focus on the development of a classification model for solid domestic
waste images using processing techniques and classical machine learning algorithms. This article
compiles the results of an exploratory study on the implementation of two different methods of
feature extraction for the development a bounded version of the waste classification problem. The
present project will serve as a basis for the development of the problem at its full scope.
The motive of conducting this research is to gain understanding of classical techniques implemented
in Computer Vision and Machine Learning. Adopting modern and more advanced methods without
comprehending the basis from which this algorithms were developed generally conducts to committing
errors due to the lack of understanding of the area. The knowledge acquired is planned to be applied
in further stages of the project in order to properly to take advantage of state of art algorithms and
methodologies.
The remaining part of the article will be structured as it follows. Section 2 contains a literature
review of research papers related to the topic. The review is mainly focused on the two main
characteristics of pattern recognition problems, feature extraction and classification algorithms. The
implemented methods and algorithms along the data set are explained in Section 3. In Section 4,
a compilation of the experimentation and results can be found. Finally, Section 5 contains the
conclusions and future work.
2 Related Work
Automated systems for waste separation using image processing and artificial intelligence have been
a topic widely studied in recent years. A few articles describe the pipeline that the images go
through to make the classification. In Liu et al. (2018) and in Aslan et al. (2020) Speed Up Robust
Features (SURF) is used in order to perform the feature extraction. Liu et al. (2018) stated that "...
SURF has an excellent effect on image recognition and classification with fast processing speed".
SURF extracts unique large dimension descriptors of the image, which makes the method suitable
for image matching. Feeding this amount of information to classification algorithms often decreases
the models’ accuracy, which is why is recommended to apply a technique for dimension reduction
to the descriptor. The Bag-of-Words (BoW) method is implemented after SURF has generated the
descriptors. The operations performed by BoW are based on the idea that relying on the existence
of a dictionary of words, each element of the vector corresponds to a word in the dictionary, thus,
each image can be described by an N-dimensional vector of words where the order of the words is
negligible. Word mapping is accomplished through a K-Means clustering that maps N objects into K
clusters. Finally, a Multi-Class Support Vector Machine (SVM) is used to perform the classification,
achieving an average of 83.38% within five categories (Liu et al., 2018).
In Geyer et al. (2017) a different approach is taken. Geyer et al. (2017) research focuses on
the classification of three different types of plastic bottles using a manually construed data set
2of 90 images properly balanced by class. The feature vector is build by flattening the image
matrix and performing classification with a majority voting scheme using a Support Vector Machine.
Principal Components Analysis, Kernel PCA, Fishers Linear Discriminant Analysis, Singular Value
Decomposition, and Laplacian Eigmaps are applied separately to the feature space. Afterwards,
the algorithm is separately fed with each input and the most voted option is the one chosen. The
research achieved an 88% of overall accuracy. Furthermore, Kumar & Bhatia (2014) make a review
of the different methods that are currently used for feature extraction.
Both Deep Learning (DL) and Machine Learning (ML) approaches have been implemented by
several authors, some of them achieving promising results regarding image classification. In Sakr
et al. (2016) DL and ML approaches are compared. A Convolutional Neural Network (CNN) and
an SVM are utilized to perform the comparison. Neural Networks architecture allows the model to
automatically learn most features of the image. This makes these algorithms particularly powerful
for image recognition. The SVM algorithm has gained a lot of attention recently, demonstrating to
be useful in multiple application fields such as medicine, remote sensing, and environmental sciences
(Camlica et al., 2015) (Liu et al., 2017) (Liu et al., 2018). The SVM was implemented along a
Bag-of-Features (BoF) techniques. Such methods are similar to BoW, however, it differs from it by
the fact that the features are described after running a kernel over the image matrix. The data set
originally contained 2000 images, however, it was widened using label-preserving transformations,
ending up with 6000 images. To conclude, the CNN achieved an 83% accuracy, while the SVM
achieved 94.8%.
On the contrary, Satvilkar (2018) performed a comparative review of the SVM, Random Forest, K
Nearest Neighbors, eXtreme Gradient Boost, and a CNN for the classification of 2390 image data set
of five different waste classes. Validation of sampling adequacy techniques such as the Kaisen Meyer
Olkin Test were performed in order to withdrew non-adequate images. PCA was applied to the
feature vector as well. The classifiers performance was evaluated using the accuracy. CNN labeled
correctly 89% of the data, whilst, the other algorithms accuracy ranged between 50 and 70 percent
of accuracy. Despite the results, classical algorithms performance must not be underestimated. The
results merely indicate that more powerful preprocessing techniques must be considered.
To conclude, it is clear that the SVM receives particular attention in image classification problems.
It is common to approach the problem from a multi-class classification perspective, thus, it is
important to address the models performance in such situations. In Tomar & Agarwal (2015)
comparison of multi-class classification methods is performed in order to determine which method
induces a better performance for SVM multi-class problems, finding that the DAG MLSTSVM
classifier provides a better performance.
3 Methodology
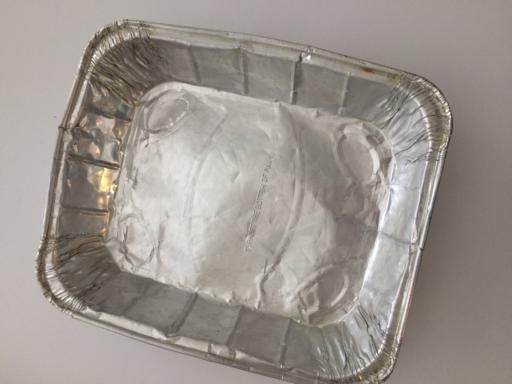
3.1 The data set
The data set was extracted from a public repository that can be found in here. It contains 2532
images of six different classes: cardboard, glass, metal , paper, plastic and trash. The long-term
goal of the research is to develop a model capable of classifying multiple types of waste into several
categories, however, successfully attaining such an objective requires a more extended period time.
3Hence, the scope of the first phase of the project, an exploratory one, was bounded to consider
performing binary classification using cardboard an metal classes. Each label is composed of 403
and 410 RGB images, respectively, of 384x512 in .jpg format. A sample of the images is shown
below.
Figure 1: Cardboard image sample. Figure 2: Metal image sample.
3.2 Feature extraction
Feature extraction is a crucial part of every image classification problem. It’s main objective is to
represent the image through a feature vector that best summarizes the main characteristics of an
image. This paper considers two different approaches, working with the image pixels and a Bag of
Features (BoF).
3.2.1 Image pixels
Images are represented as matrices, thus, the traditional approach when considering pixel values as
a feature vector is to reshape the matrix into a single vector. This process is called flattening and it
can be performed across any of the axes of the matrix. The main idea is to desegregate the matrix
by each row or column, depending on the chosen axis, and concatenate the vectors until the matrix
is expressed as a single vector. This process is illustrated in the figure shown below.
Figure 3: Flattening process. Image taken from Chakrabarty (2019)
The length of the feature vector depends on the dimensions of the image, hence, it is necessary
4to work with images of the same dimensions so the feature vectors have the same size. Since
the dimensions of an image must be sufficiently large to represent a distinguishable object, high
dimensional feature spaces are generated. Feeding the algorithms with long feature vectors is
computationally expensive and affects the model’s performance. Therefore, it is appropriate to
implement dimension reduction techniques in order to work with fewer and more representative
characteristics. Principal Components Analysis and Non-Negative Matrix Function were considered
to perform such task.
Principal Components Analysis (PCA)
PCA uses linear combinations of the variables in order to summarize them into a smaller set
of variables that maximizes the variance between observations. Since multiplying a weight with
an arbitrary large number will make the resulting variance arbitrarily large the weights must be
normalized. The data matrix is assumed to be mean-centered. This is a regular linear algebra
problem where the weight that maximizes the variance corresponds to the first eigenvalue (the
largest) of the correlation matrix.
Non-Negative Matrix Factorization (NMF)
This method is based on the idea that given a non-negative matrix of n x m dimensions M, two
matrices W and H of dimensions n x r and r x m, respectively, can be found such that H = WH.
In order to view WH as a compressed form of the data in V the r is typically chosen such that (n
+ m)r < nm (Tsuge et al., 2001). Then, the problem can be redefined as v ≈ Wh where v and h
are column of V and H. Since v vectors are expressed as a linear combination of W with h, W can
be regarded as the basis of the optimized linear approximation of the columns in V. W has to allow
that the basis vectors discover structure latent in data in order to generate proper aproximations
(Tsuge et al., 2001). The fact that the NMF does not accept negative entries leads to a parts-based
representation of a structure, since it can be regarded as combining parts to form a whole. Finally,
it is important to highlight that the NMF is a widely used technique within image processing. Since
images are all represented by non-negative matrices this method generates highly competent outputs
for the field problems.
To conclude, it is important to highlight the drawbacks of this approach. When working with
pattern recognition problems it is desirable to work with techniques that are invariant to scale,
shift, and rotation. That a feature extraction method posses these properties guaranties that the
feature vector accurately represents the main characteristics of the image despite of how the object
in question appears. In other words, it is not important how the picture of the waste is taken, the
position, the angle, and the size of the trash in the image can be neglected, and consequently, the
feature vectors of different images of the same type of waste will be quite similar.
Feature vectors composed of a flattened image does not possess these properties, therefore, the
classification algorithms will encounter complication when facing with these situations. Applying
certain dimension reduction techniques may lessen the magnitude of the problem, depending on the
properties of the chosen method, however, it does not eliminates the defect of the approach.
53.2.2 Bag of Features (BoF)
The main idea of this technique is to work with an order less collection of image characteristics. The
bag is formed extracting the features of every image and afterwards construing a "visual dictionary"
with the use of a clustering method. Each cluster represents a "term". Then, the features of each
image can be mapped to the closest terms in the vocabulary. Finally, the count of how many times a
term appears in the picture is extracted and a histogram is generated and is used as feature vector.
The process is clearly described in the figure below:
Figure 4: Bag of Features (BoF) representation process. Image taken from Loussaief & Abdelkrim
(2018)
Ultimately, the method attempts to collect local features in order to accurately represent the
image from a global perspective. Feature extraction techniques play an important role in this
method, and naturally, a wide set of techniques has been developed. A simple but accurate feature
extraction method is to run a kernel through the matrix and store the flattened pixel values of
the mask in order to construct the dictionary. This method is commonly linked with the Bag
of Feature technique. Shift Invariant Feature Transform (SIFT) and Speed Up Robust Features
(SURF) algorithms correspond to the current state of art methods and are commonly linked with
the Bag of Visual Words technique.
3.3 Classification Algorithms
3.3.1 Logistic Regression
It uses maximum likelihood estimation after transforming the explained variable into a logit variable.
The Logistic Regression not only has the ability to predict the probability of belonging to a class but
also to perform classification through the logistic function. The latter is related to the probability
of the outcome of the event. The objective function is defined in terms of the maximum likelihood
estimation and it can be noted as it follows:
6X
l(β, Y, X) = (yi xi β − ln (1 + exp xi β))
The X and Y correspond to the descriptor matrix and the label vector respectively. The β
corresponds to a vector of weights assigned to each descriptor. The weights are chosen in order
to satisfy the maximum likelihood estimation problem and will the value of each weight will indicate
the significance of each descriptor.
3.3.2 K Nearest Neighbors
K Nearest Neighbors is a non-parametric method that calculates distances between observations in
order to perform a prediction. The main idea behind the method is that the feature space of the
unlabeled image is taken and then the k nearest feature vectors are found. Afterwards, the label
will be assigned by the majority vote scheme. It is important to note that in binary classification
the k must be odd in order to avoid ties. One of the main drawbacks of the method is that it treats
every feature equally, which may end contributing to image mismatches, specially when it exist a
small subset of significant features. The output of the algorithm may vary depending on the type of
distance that is decided to use. Some of the most used distances are the Manhattan distance, the
Euclidean distance and the Minkowski distance.
3.3.3 Support Vector Machine
The SVM was initially proposed for binary classification. The main idea behind the method is to
find the optimal hyper plane that maximizes the separation between the two classes. The nearest
data samples to the optimal hyper plane are called the support vectors. Let (xi , Li ) with i = 1, ..., N
the data sample were xi is the feature space and Li is the label of the image such that Li {−1, 1}.
Then a new image feature vector is classified according to the following formula:
X
f (xtest ) = (αi Li (x| xtest ) + b)
The αi correspond to the non-zero coefficients that solve the quadratic programming problem. The
sign of the output determines the class to which the image belongs and is assumed that it is a linearly
separable. The algorithm is often used in high complexity problems and has the ability of providing
useful information to perform analysis. The SVM uses complex kernels such as the Radial Bias
Function (RBF), the polynomial classifier or the sigmoid function and still is easier to analyze in a
high dimensional space than other methods. All the calculations take place in a high dimensional
space. Support Vector Machines are quite popular due to the variety of kernels that are available
for different types of data.
3.4 Model Evaluation
The algorithms’ performance is going to be evaluated using the accuracy and AUC score as main
metrics, accompanied by the corresponding ROC curves. Learning curves are going to be plotted in
each test in order to diagnose problems with the generalization ability of the models. The later are
going to be computed using the accuracy as reference metric, since AUC cannot be fully analyzed
without the ROC curves.
73.4.1 AUC and ROC Curves
The Receiver Operating Characteristic (ROC) Curve contrast two different classification metrics and
summarizes them into one plot. The first metric is the sensitivity or true positive rate (TPR), and it
is located at the y axis of the ROC curve. The TPR measures the proportion of the postive class that
were correctly classified. The second metric is the False Positive Rate (FPR), the complement of the
specificity. The FPR measures the proportion of incorrectly classified observations of the negative
class. Sensitivity and specificity are two very important metrics in classification problems, thus, the
summary of both metrics into one single plot contains a lot of information about the classification
performance.
Classification algorithms often generate an output based on an observation’s belonging probability
to one category. The label is chosen according a threshold, hence, the models performance will vary
as the threshold varies. The ROC curve is built upon the variation of this threshold by calculating
the corresponding sensitivity and specificity values for each iteration. This allows to represent the
overall algorithm performance in a single graph.
What it is expected to see is that the model is capable of obtaining a high sensitivity score while
maintaining a high specificity. This is shown when the curve maintains a high TPR for low FPR
values. In other words, the closer that the curve gets to the top left corner of the plot, the best that
the classifier performs. The Area Under the Curve (AUC) is a summary of the ROC curve, as it
name states it indicates the area under the ROC curve. This allows compare models’ performance
without directly looking at the ROC curve. These are the reasons why the ROC curve and the AUC
are considered in this research.
3.4.2 Learning Curve
Is a widely used diagnostic tool in machine learning that evaluates the algorithms learning rate.
Learning curves are used to determine problems with the learning, such as under fitting or over
fitting, as well as whether the models performance can be improved with more data or if the learning
process stationed. Moreover, determining if the learning process stationed is quite useful since it
reveals that further transformations need to be applied to the data or that a more complex model
needs to be implemented.
4 Results
The experiments were divided in the two feature extraction techniques mentioned in the previous
section. Some image processing techniques were applied in order to enhance the models performance.
PCA and NMF were applied to the feature space and the results were contrasted in order to
determine which method generates better results. Tests were conducted using Logistic Regression,
K Nearest Neighbors, and Support Vector Machine as classification algorithms. The performance
of the algorithms was evaluated using 5-fold cross validation using the AUC and accuracy scores
as reference metrics. Furthermore, ROC and learning curves where used as a guideline to evaluate
the algorithms capability of classification and generalization. A hyper parameter tuning routine was
implemented in order to further enhance model performance over the different data setes, however,
8they are not going to be listed in the project due to the length of it.
Experimentation was conducted in a Jupyter Notebook environment using python. Google Colab
was used as main platform to perform the operations, image repositories and experiment results
were stored in Google Drive. Everything was backed up in a public GitHub repository, for further
understanding of the code and experimentation it can be accessed from here. The remaining part
of this section will describe the architecture that was adopted in order to perform the experiments
and will expose a compilation of the obtained results.
The first stage of the experimentation focused on determining which combination of techniques
and algorithms generated the better results when using image pixels as feature vectors. The
experimentation contrasted the performance of the methods when the images possessed four different
dimensions (10x10, 30x30, 50x50, and 100x100) and were applied a different set of basic processing
techniques: converting the image into gray scale, re scaling pixel values, and extracting the borders
using the Canny algorithm. Moreover, the feature space dimensions were reduced by applying PCA
and NMF. The implemented algorithms for this stage of the experimentation were the Logistic
Regression and K Nearest Neighbors. The models were tested with four different data sets: the
non-modified feature space (Regular), a PCA feature space (PCA), the principal components that
sum the 80% of the variance of the feature space (PCA80), and a NMF feature space (NMF). The
hyper parameters of the algorithms were tuned for each data set and generalization capabilities were
evaluated using their learning curve.
The experimentation showed that the two data sets that generated the best results across the
experiments were the PCA80 and the NMF. Moreover, this data sets provided the algorithms
with a superior generalization ability. The algorithms learning curve showed that whenever the
dimensions of an image were increased from 10x10 and they were fed by the Regular or PCA
data set the algorithm did not comprehend the relationships of the data, producing that the
algorithm under-fitted the data. On the contrary, PCA80 and NMF data sets allowed to generalize
appropriately in every case but one. It was observed that the Logistic Regression algorithm lacked
the ability of interpreting the relationships among the variables when the edge filters were applied
to the data. Whilst, the KNN not only was able of properly fitting the data, but it generated the
highest scores of the stage as well. Finally, it was determined that image dimensions are negligible
when they are 30x30 or larger since working with the widest feature spaces did not generated good
results and that the PCA80 and NMF scores stationed after 30x30 dimensions. The best results
achieved in this stage are listed bellow:
Models PCA80 Accuracy Score PCA80 AUC Score NMF Accuracy Score NMF AUC Score
LR 0.71 0.76 0.72 0.76
KNN 0.71 0.85 0.70 0.77
Table 1: Algorithms best results of stage one experimentation.
In the second stage of the experimentation the Bag of Features approach was taken into account
using an 8x8 kernel with a step of three pixels. In addition, the images were segmented in order
to reduce the noise of the picture and that the waste occupies a larger space of the image. The
9experiments were conducted with the same methodology of the previous stage with the exception
that image dimensions are no longer tested. After the segmentation it was decided to reshape
the images so they all possess 75x75 dimensions. This values were chosen in order to benefit the
computational efficiency without compromising the models’ performance. The Logistic Regression,
K Nearest Neighbors, and the Support Vector Machines where chosen to perform the classification.
The results are going to be contrasted by mixing the different image processing techniques listed
before and using different types of data sets. PCA80 and NMF image pixel feature vector are still
considered for the experimentation. Similarly, four data sets are built from the BoF approach, they
are going label them as it follows: BoF-Regular, BoF-PCA, BoF-PCA80, and BoF-NMF. Hyper
parameters are tuned for each data set and generalization ability is evaluated.
The BoF approach demonstrated to generate better overall results than working with image
pixels. The Logistic Regression accuracy and AUC scores incremented considerably in comparison
with the ones generated in the first stage of the experimentation. The learning curves showed that
the considered feature space contained sufficiently simple relationships in order for the algorithm
to comprehend the data, hence, produce better results. In addition, eliminating the noise in the
picture enabled the latter to comprehend images with their edged filtered when working with pixel
based feature vectors that are passed through the NMF method, whilst working with PCA80 learning
ability remained the same. Moreover, re scaling pixel values of gray scale images generated the worst
results of the stage. Performing this transformation to the pixel values affected the BoF ability of
creating the vocabulary dictionary.
Furthermore, the K Nearest Neighbors algorithm showed a significant improvement in the accuracy
scores generated. Such increment is attributed to the object centering applied since the algorithm
performed better even when it worked with PCA80 and NMF data sets. On the other hand, AUC
scores did not increment in comparison to the ones obtained in the first stage of experimentation.
Finally, the Support Vector Machine achieved the highest scores in every test, demonstrating a better
performance when it is fed with the BoF-Regular when the images are just centered and converted
to gray scale and with the PCA80 and the image is centered and the edges are filtered. The results
of the three classification algorithms over the two data sets mentioned before are listed in the table
bellow:
Models BoF-Regular Accuracy Score BoF-Regular AUC Score PCA80 Accuracy Score PCA80 AUC Score
LR 0.78 0.85 0.67 0.65
KNN 0.77 0.85 0.72 0.82
SVM 0.81 0.90 0.84 0.90
Table 2: Algorithms best results of stage two experimentation.
5 Conclusions and future research
The research composes of two main stages of experimentation in which the objective is to determine
what are the best approaches to the waste classification problem. The first set of experiments
illustrated the importance of dimension reduction techniques when the feature vector is composed
of image pixels. Not only it guarantees to increment the algorithms performance but it prevents the
model from under fitting the data. In addition, the Logistic Regression is not able of working with
10overly complex sets of data, such as the feature vector generated from edged filtered images. Thus,
the necessity of implementing algorithms with a higher capacity of abstraction or to perform image
processing techniques that reduces noise is contemplated.
Moreover, second stage experiments demonstrated the superiority of the BoF approach for feature
extraction. Describing images local features from a global perspective allowed the algorithms to
achieve higher overall performance and it provided sufficiently simple data relations in order to
guarantee proper generalization abilities, regardless of the complexity of the data. Nonetheless,
object centering provided models with higher abstraction capacity with the ability of achieving
outstanding results, as it happened with the Support Vector Machine with the PCA80 data set of
edged filtered images.
Future phases of the research will focus on the implementation of modern classification algorithms
such as Neural Networks and transfer learning in order to develop a research around the full scope
of the waste classification problem. It is expected to work with significantly larger data sets and to
perform multi-class classification, hence, building computationally efficient programs is within the
objectives of future projects.
References
Abdel-Shafy, Hussein, & Mansour, Mona. 2018. Solid waste issue: Sources, composition, disposal,
recycling, and valorization. Egyptian Journal of Petroleum, 27(12), 1275–1290.
Aguilar-Virgen, Quetzalli, Vega, Carolina, Taboada-González, Paul, & Aguilar, Xochitl. 2010.
Potential Recovery of Domestic Solid Waste Disposed of in A Landfill. Revista de Ingeniería,
11, 16–27.
Andesco. 2020. El 78% de los hogares colombianos no recicla. Andesco. Accessed: 2021-02-05.
Arebey, Maher, Hannan, M. A., Begum, Rawshan, & Basri, Hassan. 2011 (11). CBIR for an
Automated Solid Waste Bin Level Detection System Using GLCM.
Aslan, Muhammet, Durdu, Akif, & Sabanci, Kadir. 2020. Human action recognition with bag of
visual words using different machine learning methods and hyperparameter optimization. Neural
Computing and Applications, 32(06), 8585–8597.
Camlica, Zehra, Tizhoosh, Hamid, & Khalvati, Farzad. 2015 (12). Medical Image Classification via
SVM using LBP Features from Saliency-Based Folded Data.
Chakrabarty, Navoneel. 2019 (03). A Novel Strategy for Gender Identification from Hand Dorsal
Images using Computer Vision.
Chamas, Ali, Moon, Hyunjin, Zheng, Jiajia, Qiu, Yang, Tabassum, Tarnuma, Jang, Jun Hee,
Abu-Omar, Mahdi, Scott, Susannah, & Suh, Sangwon. 2020. Degradation Rates of Plastics in the
Environment. ACS Sustainable Chemistry Engineering, XXXX(02).
Geyer, Roland, Jambeck, Jenna, & Law, Kara. 2017. Production, use, and fate of all plastics ever
made. Science Advances, 3(07), e1700782.
11Hannan, M. A., Arebey, Maher, Begum, Rawshan, & Basri, Hassan. 2012. An automated solid waste
bin level detection system using a gray level aura matrix. Waste management (New York, N.Y.),
32(06).
Kumar, Gaurav, & Bhatia, Pradeep. 2014 (02). A Detailed Review of Feature Extraction in Image
Processing Systems.
Liu, Peng, Choo, Kim-Kwang Raymond, Wang, Lizhe, & Huang, Fang. 2017. SVM or deep learning?
A comparative study on remote sensing image classification. Soft Computing, 21(12).
Liu, Yijian, Fung, King-Chi, Ding, Wenqian, Guo, Hongfei, Qu, Ting, & Xiao, Cong. 2018. Novel
Smart Wgaste Sorting System based on Image Processing Algorithms: SURF-BoW and Multi-class
SVM. Computer and Information Science, 11(06), 35.
Loussaief, Sehla, & Abdelkrim, Afef. 2018 (03). Deep learning vs. bag of features in machine learning
for image classification.
Mittal, Gaurav, Yagnik, Kaushal, Garg, Mohit, & Krishnan, Narayanan. 2016 (09). SpotGarbage:
smartphone app to detect garbage using deep learning.
Mohajerani, Abbas, Vajna, John, Cheung, Tsz, Kurmus, Halenur, & Arulrajah, Arul. 2017. Practical
recycling applications of crushed waste glass in construction materials: A review. Construction
and Building Materials, 156(12), 443–467.
Ozkan, Kemal, Ergin, Semih, Işık, Şahin, & Işıklı, Idil. 2014. A new classification scheme of plastic
wastes based upon recycling labels. Waste management (New York, N.Y.), 35(10).
Sakr, George, Mokbel, Maria, Darwich, Ahmad, Khneisser, Mia, & Hadi, Ali. 2016 (11). Comparing
Deep Learning And Support Vector Machines for Autonomous Waste Sorting.
Satvilkar, Mandar. 2018. Image Based Trash Classification using Machine Learning Algorithms for
Recyclability Status.
Semana, Revista. 2020. Así cambiará el reciclaje en Colombia tras entrada en vigencia de una norma.
Revista Semana. Accessed: 2021-02-05.
Tomar, Divya, & Agarwal, Sonali. 2015. A comparison on Multi-class Classification methods based
on Least Squares Twin Support Vector Machine. Knowledge-Based Systems, 81(02).
Toğaçar, Mesut, Ergen, Burhan, & Cömert, Zafer. 2019. Waste Classification using AutoEncoder
Network with Integrated Feature Selection Method in Convolutional Neural Network Models.
Measurement, 153(12), 107459.
Tsuge, S., Shishibori, M., Kuroiwa, Shingo, & Kita, K. 2001 (02). Dimensionality reduction using
non-negative matrix factorization for information retrieval. vol. 2.
12You can also read