A Benchmark of Ocular Disease Intelligent Recognition: One Shot for Multi-disease Detection
←
→
Page content transcription
If your browser does not render page correctly, please read the page content below
A Benchmark of Ocular Disease Intelligent
                                               Recognition: One Shot for Multi-disease
                                                             Detection

                                                  Ning Li1 , Tao Li1,2 , Chunyu Hu1 , Kai Wang1 , and Hong Kang1,3
arXiv:2102.07978v1 [cs.CV] 16 Feb 2021

                                              1
                                                 College of Computer Science, Nankai university, Tianjin, 300350, China
                                             2
                                                State Key Laboratory of Computer Architecture, Institute of Computing
                                                   Technology, Chinese Academy of Science, Beijing, 100190, China
                                              3
                                                 Beijing Shanggong Medical Technology Co. Ltd, Beijing, 100176, China
                                                                     kanghong@nankai.edu.cn

                                                  Abstract. In ophthalmology, early fundus screening is an economic and
                                                  effective way to prevent blindness caused by ophthalmic diseases. Clin-
                                                  ically, due to the lack of medical resources, manual diagnosis is time-
                                                  consuming and may delay the condition. With the development of deep
                                                  learning, some researches on ophthalmic diseases have achieved good re-
                                                  sults, however, most of them are just based on one disease. During fundus
                                                  screening, ophthalmologists usually give diagnoses of multi-disease on
                                                  binocular fundus image, so we release a dataset with 8 diseases to meet
                                                  the real medical scene, which contains 10,000 fundus images from both
                                                  eyes of 5,000 patients. We did some benchmark experiments on it through
                                                  some state-of-the-art deep neural networks. We found simply increasing
                                                  the scale of network cannot bring good results for multi-disease classifi-
                                                  cation, and a well-structured feature fusion method combines character-
                                                  istics of multi-disease is needed. Through this work, we hope to advance
                                                  the research of related fields.

                                                  Keywords: fundus images · multi-disease · image classification · neural
                                                  network · computer-aided diagnosis.

                                         1   Introduction
                                         Fundus diseases are the leading causes of blindness among human beings world-
                                         wide [22]. Among them, diabetic retinopathy (DR), glaucoma, cataract and age-
                                         related macular degeneration (AMD) are the most popular ophthalmic diseases.
                                         According to related surveys, there will be over 400 million people with DR
                                         by 2030, and the glaucoma patients will reach 80 million people worldwide by
                                         2020 [8]. These ophthalmic diseases have become a serious public health problem
                                         in the world. Most importantly, the ophthalmic disease has irreversible proper-
                                         ties, which could cause unrecoverable blindness. In clinical scenarios, early de-
                                         tection of these diseases can prevent visual impairment. However, the number
                                         of ophthalmologists are out of balance compared with that of patients seriously.
                                         Moreover, fundus screening manually is time-consuming and relies heavily on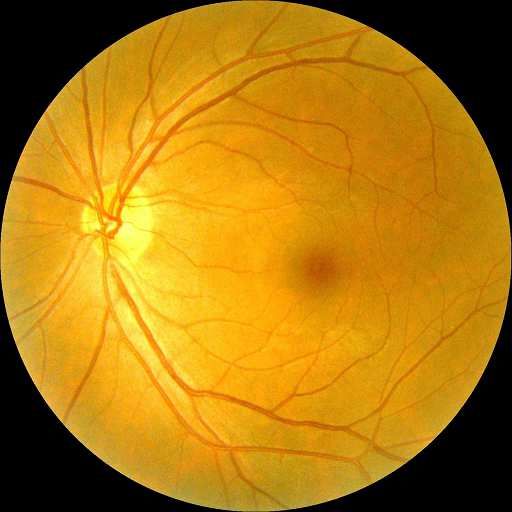
2      N Li et al.

ophthalmologists’ experience. These reasons make it difficult to perform large-
scale fundus screening. Therefore, an automatic computer-aided diagnosis algo-
rithm for ophthalmic diseases screening is important particularly.
    However, designing such an effective computer-aided diagnosis algorithm
is challenging. For example, microaneurysm is an important reference for DR
screening [18]. However, the size of microaneurysm is very small, so that it is
hard to be detected and it is easy to be confused with other lesions. Meantime,
the low contrast between the lesion pixels and the background pixels, the ir-
regular shape of the lesions and the large differences between the same lesion
points caused by different cameras also make it difficult to accurately identify
ophthalmic diseases.
    Although there have already been some deep learning models for ophthalmic
disease screening, and they achieve remarkable performance. We found there are
some limitations. 1) Single disease. Most of the identification models only con-
centrate on one ophthalmic disease [26] [31], and most of the dataset they use
provide annotations for only one kind of ophthalmic disease. However, consider-
ing the actual needs of patients with fundus disease in daily life, we believe that
establishing a more effective and comprehensive fundus screening system that
can detect multiple diseases is necessary. 2) Single eye. Existing datasets are
based on a fundus image [7] [6], but in real clinical scenarios, ophthalmologists
usually diagnose patients with information from both eyes.
    To solve the problem above-mentationed, in this paper, we release a publicly
available dataset for multiple ophthalmic diseases detection. Different from the
current published international monocular dataset, our dataset contains 5,000
pairs of binocular images, i.e. 10,000 images in total. Moreover, we provide an-
notations for 8 diseases on binocular images, which means that there may be
multiple diseases for one patient. In addition, multi-disease screening is more
complicated than the current single disease screening, and there are few rele-
vant studies to learn from. Hence, we performed experiments on several popular
deep learning based classification networks for multi-disease classification. Ex-
tensive experiments show simply increasing the scale of network cannot lead to
performance improvement, and a well-structured feature fusion method which
combines characteristics of multiple diseases is needed.
    In summary, the main contributions of our work are as follows. First, we col-
lected, annotated and release a multi-disease fundus image dataset named Oph-
thalmic Image Analysis-Ocular Disease Intelligent Recognition (OIA-ODIR).
Second, we performed experiments on nine popular deep neural network models
on this dataset, thereby establishing a benchmark. At last, by presenting this
dataset, we hope that it can promote the further development of the clinical
multi-disease classification research.

2   Related Work

At present, the works of ocular disease screening are mainly performed on optical
coherence tomography (OCT) images and fundus images. With the development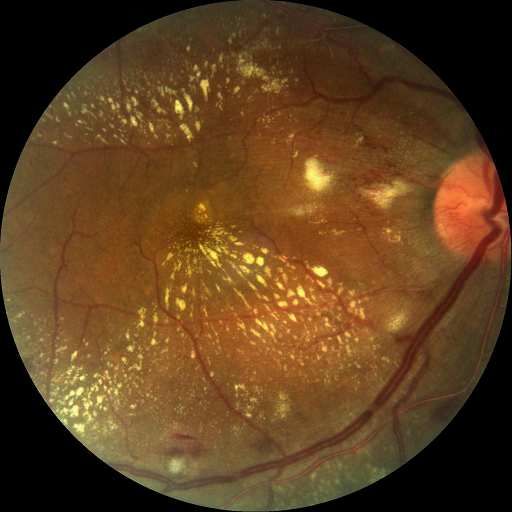
A Benchmark of Ocular Disease Intelligent Recognition        3

of artificial intelligence in the field of medical image processing, some related
methods have achieved pleasing results.

2.1   OCT Images Recognition
OCT is one of the commonly used methods for fundus disease examination. Af-
ter investigation, about 5.35 million OCTs were used in the United States in
2014 [2]. OCT has been widely used in clinical because of the advantages of low-
loss, high-resolution, noninvasive medical imaging, compared to other methods.
Ophthalmologists can observe the patient’s retina layers through OCT images,
measure these layers, and find minor early fundus lesions, then provide the cor-
responding treatment [27].
    At present, the focus of some works is done through OCT image recogni-
tion, including segmentation [17], detection [24] and classification [23], etc. He
et al. [14] proposed a new way for retina OCT layer surface and lesion seg-
mentation without handcrafted graph. A novel method for multiclass drusen
segmentation in retinal OCT images was proposed by Asgari et al. [3]. Their
method consistently outperforms several benchmarks in some ways by using a
decoder for each target category and an additional decoder for the areas among
the target layers. Marzieh Mokhtari et al. [20] calculate local cup to disc ratio by
fusing fundus images and OCT B-scans to get the symmetry of two eyes, which
can detect early ocular diseases better. Mehta et al. [19] proposed a OCT images
system for multi-class, multi-label classification, which augments data by using
patient information, such as age, gender and visual acuity data.
    Although the work of OCT images for ocular diseases screening has been quite
mature, the existing public datasets of OCT images are quite few. In addition,
comparing with color fundus images, OCT images have higher requirements on
acquisition equipment and are more difficult to obtain. In this paper, we provide
a new large-scale color fundus image dataset to encourage further research which
could be applied in real clinical scenes.

2.2   Fundus Images Recognition
Some related results have been published on fundus image classification. In order
not to delay the treatment of patients and to solve the quality classification of
fundus images, Zhang et al. proposed an improved residual dense block convolu-
tional neural network to effectively divide fundus images into ”good quality” and
”poor quality” [30]. Zhang et al. described a six-level cataract grading method
focusing on multi-feature fusion, which extracted features from residual network
(ResNet-18) and gray level co-occurrence matrix (GLCM), the results show ad-
vanced performance [31]. Hong et al. developed a 14-layers deep CNN model
that can accurately diagnose diseases in the early stages of AMD and help oph-
thalmologists perform ocular screening [26].
    For multiple diseases recognition. Choi et al. used neural networks and ran-
dom forest to study classification of 10 fundus diseases on STructured Analysis
of the REtina (STARE) database [7]. Chelaramani at al. conducted three tasks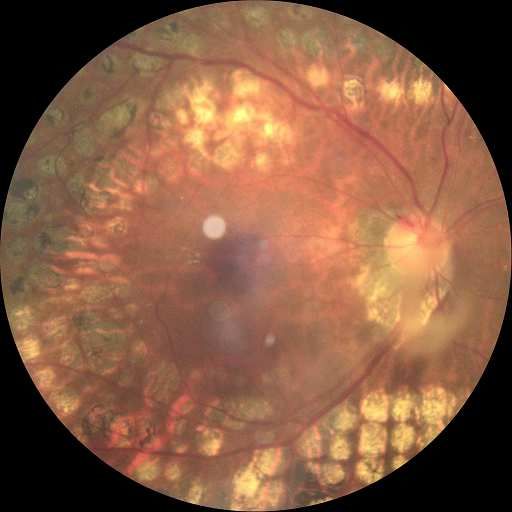
4      N Li et al.

on a private dataset, including four common diseases classification, 320 fine-
grained classification and generated text diagnosis [5]. On a public database
named Singapore Malay Eye Study (SiMES) [11], Chen et al. performed multi-
label classification of three common fundus diseases on an image, with Entropic
Graph regularized Probabilistic Multi-label learning [6].
    With the rapid development of artificial intelligence, computer-assisted fun-
dus disease diagnosis have gradually developed. Although the above works have
obtained quite good results, they still have limitations to a certain extent. Many
of their works are based on a single disease solely, when other fundus diseases
need to be detected, the structure need to be redesigned, which undoubtedly
makes research cumbersome and inefficient. At the same time, in the process of
image processing, some works requires artificial designed features, which makes
the operation cumbersome and requires a lot of human prior knowledge.
    Currently, many existing datasets for the research on fundus diseases are ei-
ther too small or the types of diseases are too single, which makes them extremely
difficult to apply their work to practical clinical scenarios. Although there are
already some fundus datasets for multi-disease research, they are relatively few
in number of images and types of diseases. In clinical diagnosis, patients usually
have more than one ocular disease, so it is necessary to publish a large-scale
fundus image dataset containing multiple diseases.

3     Our Dataset

As the best of our knowledge, there are few publicly available fundus image
datasets with multi-disease annotations on one image. However, in clinical ap-
plication, more than one prediction could be given when observing binocular
fundus image. At the same time, ophthalmologists make a diagnosis based on
the patient’s fundus image, age and other information. This has prompted us to
collect and release a multi-modal fundus dataset containing multiple diseases.
In this section, we will introduce some details of our dataset.

3.1   Image Collection and Annotation

Collection The images of OIA-ODIR are derived from our private clinical fun-
dus databases. The database contains more than 1.6 million images totally, and
the fundus images are collected from 487 clinical hospitals in 26 provinces across
China. Each image contains abnormalities in different areas of the fundus caused
by various diseases, these areas include macula, optic cup, optic disc, blood ves-
sels, and the entire fundus background. We conducted statistics and analysis on
these fundus disease categories, and unified a more detailed classification of a
certain disease category into a category to label each image, i.e., the DR of stage
1,2,3,4 are unified as DR et al.
    In order to ensure the high-quality of fundus images, we cleaned the images
of our private database by filtering out duplicate images and low-quality images.
Then, we selected some samples from the remaining fundus images at a suitable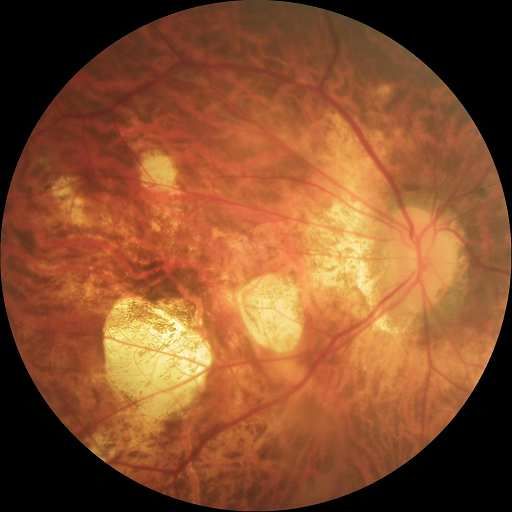
A Benchmark of Ocular Disease Intelligent Recognition 5
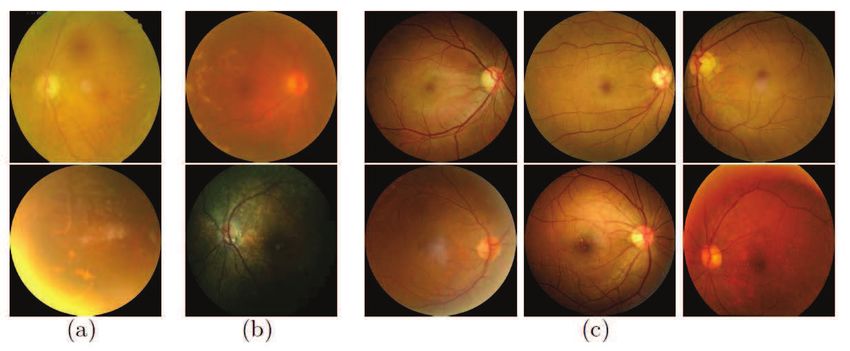
(a) (b) (c) (d) (e) (f)
Fig. 1. Examples of images in left(top) and right(bottom) eyes. The diagnostic key-
words of each column are provided as [left; right]. (a) normal; normal (b) normal;
pathological myopia (c) DR; pathological myopia (d) laser spot, vitreous denaturation,
DR; laser spot, DR (e) normal; AMD, DR (f) DR, pathological myopia; pathological
myopia
ratio for training and testing. Finally, we obtained 10,000 fundus images with 8
types of annotations from the left and right eyes of 5,000 patients. The labeled
categories include normal, diabetic retinopathy (DR), glaucoma, cataract, age-
related macular degeneration (AMD), hypertension, myopia, and other diseases.
Annotation The annotation work of our dataset is done by the professional
annotation staff and arbitration team, which took about 10 months to complete.
The annotation staff and arbitration team are composed of three ophthalmolo-
gists with more than 2 years of clinical experience and three ophthalmologists
with more than 10 years of clinical experience in ophthalmology. We strictly
follow the corresponding standards and procedures in the process of data anno-
tation. First, three annotators respectively annotate the same batch of fundus
images and record the results. If there is any disagreement among the three
annotators, the arbitration team will arbitrate the results, the final annotation
result shall be based on the consensus of two or more experts. All of these guar-
antee the persuasiveness of our dataset. At last, some images from our dataset
can be seen in Fig. 1.
3.2 Features of Dataset
Currently, there are already some datasets for ophthalmic disease research. For
example, in [18], Gao et al. exposed a fundus image dataset called DDR, which
can perform three tasks of image classification, semantic segmentation and object
detection. Kaggle DR [1] is the largest fundus image dataset currently used for
the classification of DR. Kora [4] is widely used in AMD detection, which contains
fundus images of 2840 patients. STARE [15] has 397 images and can be used for
14 diseases’ classification. The Messidor-2 dataset contains 1,200 fundus images
for classification of DR and macular degeneration [10]. A dataset related to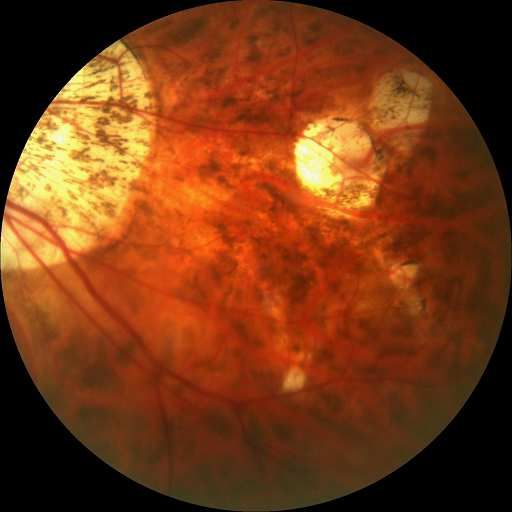
6      N Li et al.

glaucoma detection research, named ORIGA, contains 650 fundus images, but
the dataset is not available [32]. In addition, there is an unpublished dataset
RIM-ONE about optic nerve head segmentation [12]. While e-optha is public, it
can only be used for lesion detection [9]. SiMES [11] contains 3150 images of 6
kinds of fundus abnormalities, which can be used for multi-label classification.
All these datasets have greatly promoted the development of medical image
processing and are of innovative significance. Table 1 shows some statistics for
these datasets.

          Table 1. Statistics of the existing ophthalmic disease datasets

    Dataset         Annotations    Images Multi-disease Multi-label Available
   DDR [18]          DR staging    13,673      N            N          Y
Kaggle DR [1]        DR staging    88,702      N            N          Y
  KORA [4]              AMD           -        N            N          Y
Messidor-2 [10] DR staging, AMD     1,200      N            N          Y
 ORIGA [32]     glaucoma detection   650       N            N          N
RIM-ONE [12] ONH segementation       783       N            N          N
  e-optha [9]     lesion detection   463       N            N          Y
 STARE [15]          14-disease      397       N            N          Y
      [28]           36-disease       -        Y            Y          N
 SiMES [11]           6-disease     3,150      Y            Y          Y
    ODIR              8-disease    10,000      Y            Y          Y

    Although many datasets as above have been proposed for ophthalmic disease
research, few of them are used for the detection of multiple ophthalmic diseases
on one eye, which undoubtedly causes obstacles to the related work for clinical
application. As far as we know, our dataset, named OIA-ODIR, is the first
internationally launched large-scale multi-type diseases detection dataset based
on binocular fundus image. Compared with other fundus image datasets in the
same field, our dataset has significant features described as follows.
1. Multi-disease: Unlike most existing fundus image datasets, which only focus
   on one ophthalmic disease, our dataset contains multiple ophthalmic dis-
   eases. As shown in Fig. 2, these diseases include abnormalities with lesions
   in different areas of the fundus. According to the International Classification
   Standard ICO [29], DR is divided into four stages. The early stage of DR is
   characterized by various abnormalities on the retina. For example, there are
   lesions such as hard exudate, soft exudate, bleeding and neovascularization
   on the fundus image. Compared with advanced DR, the early stage is not
   serious and the clinical treatment is significant [25]. For glaucoma, the oph-
   thalmologist usually calculates the ratio of the optic cup to the optic disc.
   When the ratio is greater than 0.5, the patient is judged to have glaucoma.
   In recent years, ophthalmologists have also diagnosed by the neuroretinal
   rim loss, the visual field and the defect of the retinal nerve fiber layer. Clini-
   cally, protocols such as the American Cooperative Cataract Research Group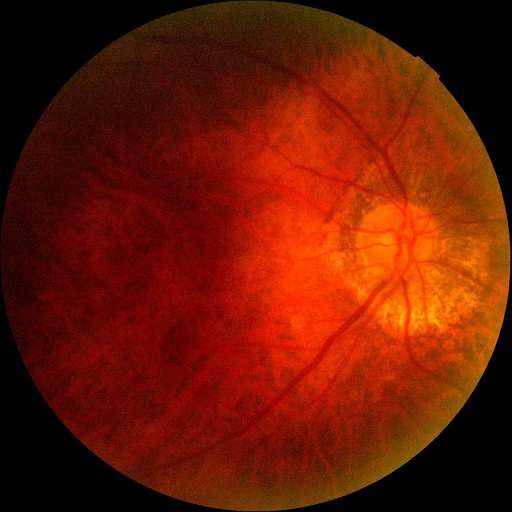
A Benchmark of Ocular Disease Intelligent Recognition       7

       (a) N    (b) D    (c) G    (d) C    (e) A    (f) H    (g) M    (h) O

Fig. 2. Images from each categories. Each column of images comes from the same cat-
egory, i.e. Normal (N), DR (D), Glaucoma (G), Cataract (C), AMD (A), Hypertension
(H), Myopia (M), and Others (O)

    (CCRG) method are generally used to classify cataracts. Experienced oph-
    thalmologists compare the fundus images of patients with standard cataract
    photos to determine the severity of cataract patients [33]. Nowadays, AMD
    is also a common cause of blindness in people of an advanced age, and it is
    closely related to drusen in the macular area [13]. Ophthalmologists diagnose
    the severity of AMD by the size and number of drusen. In the fundus image
    of a patient with hypertension, we can see that the arteriovenous diameter
    has a larger ratio. For pathological myopia, there are clear leopard print
    shapes in the patient’s fundus area.
    In the field of ophthalmology research, most of the existing datasets are based
    on a fundus disease, which makes it difficult to apply related work based on
    them to the detection of other diseases. Clinically, ophthalmologists may
    give diagnosis results of various diseases by observing one fundus images.
    Therefore, as a dataset containing multiple fundus diseases, our dataset is
    closer to clinical application scenarios.
 2. Binocular-based: Most of the existing ophthalmic disease detection works
    are based on a fundus image, but in real clinical scenarios, ophthalmologists
    usually diagnose patients with information from both eyes. In order that
    the related work performed on our dataset can be better applied to realis-
    tic scenes, our dataset contains fundus images of the left and right eyes of
    patients. Compared with detection on one eye merely, screening for patients
    with both eyes is both comprehensive and complicated, because in the pro-
    cess of feature extraction of the image, we have to balance the correlation
    between the two eyes and their respective characteristics. This makes the
    classification task on this dataset full of challenges. The ultimate goal of
    our dataset is to perform multi-label classification of patients using fundus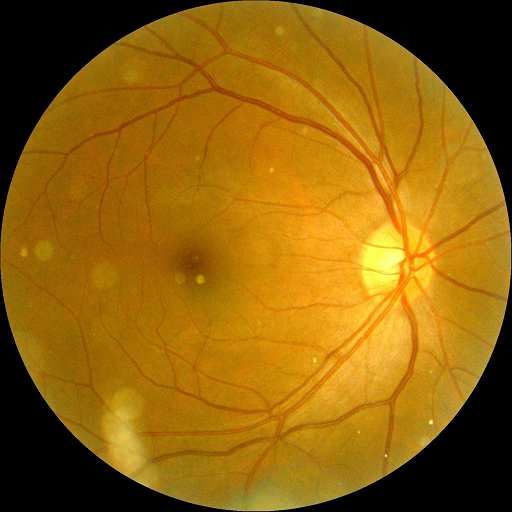
8        N Li et al.

    images of both eyes. Fig. 1 shows some images of the patient’s left and right
    eyes.
 3. Multi-modal data: Our dataset integrates multiple information of patients.
    In addition to providing researchers with fundus images of the left and right
    eyes of patients, we also provide age and gender of each patient and the
    diagnostic keywords of ophthalmologists for each fundus image, as shown in
    Fig. 1. These information can help researchers better perform multi-disease
    classification tasks, and can also help them perform some more detailed
    research based on the dataset, such as generating textual diagnosis [5] and
    age predicting [21] based on fundus images.
 4. Scale: In today’s data-driven deep learning research, large-scale datasets are
    the cornerstone of ensuring that a research effort is truly applied to real-
    world scenarios. Our dataset contains 10,000 fundus images from the left
    and right eyes of 5,000 clinical patients. These images were acquired by
    different cameras at multiple ophthalmic centers in various regions of China.
    With a variety of resolutions and covering large scenes, we hope that it can
    promote further development in this field.

3.3    Split of Dataset

The OIA-ODIR dataset consists of 10,000 fundus images from 5,000 clinical pa-
tients. To evaluate the computer-aided algorithms of ocular diseases recognition,
we split the dataset into three parts, i.e. the training set, the off-site test set and
the on-site test set, which contains 3,500, 500 and 1,000 patients, respectively.
The proportion of the training set and the test set is 7:3. The training set is
used for training deep networks, and the off-site test set could be used as the
validation set for model selection. The generalization ability of the deep network
is evaluated on the on-site test set.

      Table 2. Proportion of images per category in training and testing datasets

                  Labels          N    D    G   C   A   H   M   O
              Training case      1138 1130 215 212 164 103 174 982
          Off-site Testing cases 162 163 32 31 25 16 23 136
          On-site Testing cases 324 327 58 65 49 30 46 275
                 All Cases       1624 1620 305 308 238 149 243 1393

    In detail, the proportion of images per category in the training set and test
set is summarized in Table 2. We can observe that there exists serious class
imbalance in OIA-ODIR. Specially, the number of fundus images with hyper-
tension (H) is less than one tenth of normal images (N), which is challenging for
multi-label diseases recognition.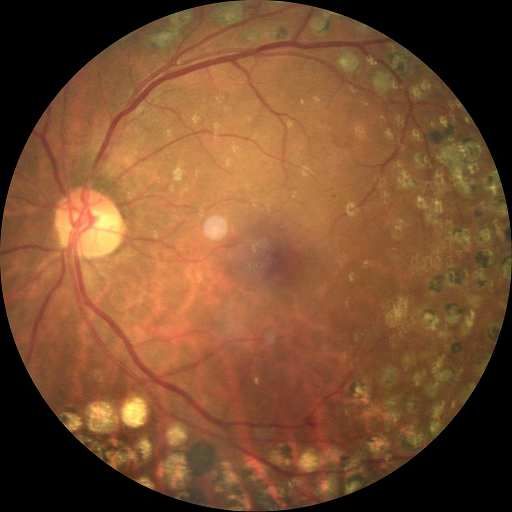
A Benchmark of Ocular Disease Intelligent Recognition                9

4     Multi-Disease Classification
In order to establish benchmark performance on our proposed OIA-ODIR dataset
and evaluate the performance of some popular deep classification networks. In
this section, we select nine currently popular deep convolutional neural net-
works, including Vgg-16, ResNet-18, ResNet-50, ResNeXt-50, SE-ResNet-50,
SE-ResNeXt-50, Inception-v4, Densenet and CaffeNet. Their performance will
be described below.

4.1    Network Structure
In order to adapt to the characteristics of our OIA-ODIR, we made two modi-
fications on the network structure. Firstly, the input of the network is two im-
ages, rather than one. Different from traditional image datasets used for diseases
screening, the status of patients take into account both left eyes and right eyes
at the same time. Therefore, the inputs of the network are two fundus images
and the corresponding ground-truth. Furthermore, in order to better fuse the
deep information of two fundus images and find a better baseline feature fusion
method, we evaluated three feature fusion methods, including element-wise mul-
tiplication, element-wise sum and concat. Secondly, it is multi-label classification
task rather than single-label. We added eight classifiers for two-class classifica-
tion behind the last fully-connected layer of each network to achieve the purpose
of multi-label classification. Fig. 3 shows some details of our modified network.

                                  left
                                                                     N(2)

                                                                     D(2)
                                                   left_feat
                                                                     G(2)

                                                                     C(2)

            left_eye
                                                                     A(2)   Prediction(8)

                                                                     H(2)
                                                   right_feat
                                                                     M(2)

                                                                     O(2)

                                                 Feature fusion   Softmax
           right_eye               right

                            Backbone network
                             (weight shared)

Fig. 3. The structure of multi-label classification network, the input of the network
is two fundus images, and the backbone network is used for extracting their features.
The feature fusion module fuses two features of left eye and right eye into one, and it
is further fed into eight classifiers

4.2    Experimental Settings
Running Environment All the deep networks, pre-trained on ImageNet, were
trained and tested based on a publicly available convolutional network framework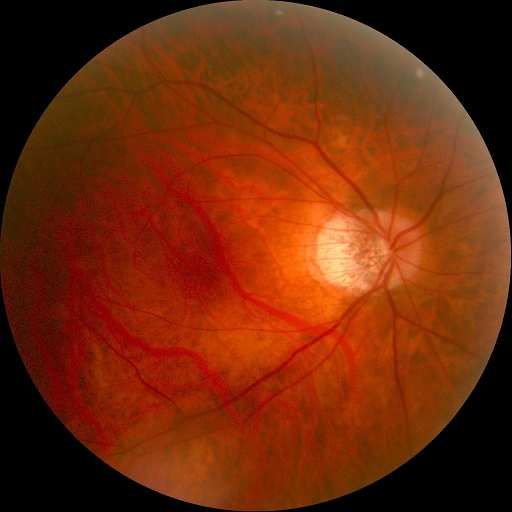
10       N Li et al.

Caffe [16]. And, Caffe was compiled with CUDA 8.0 and CUDNN 5.1. The
experiments ran on a workstation equipped with three NVIDIA GTX 1080ti
GPUs, Intel E5 CPUs and 128GB memory, and the running operating system is
Ubuntu 16.04.

Table 3. The experimental results of nine deep networks on the Off-site and On-site
testsets (Final denotes Final-score)

                                    Off-site                          On-site
Fusion        Model
                        Kappa      F1    AUC      Final   Kappa      F1    AUC     Final
           Vgg-16       0.4494   0.8730 0.8681   0.7302   0.4397   0.8718 0.8705   0.7273
         ResNet-18      0.4325   0.8635 0.8422   0.7128   0.4137   0.8616 0.8365   0.7039
         ResNet-50      0.3799   0.8452 0.7988   0.6746   0.3827   0.8461 0.7885   0.6724
        ResNeXt-50      0.4588   0.8660 0.8390   0.7213   0.4654   0.8673 0.8386   0.7238
 SUM SE-ResNet-50       0.4140   0.8605 0.8693   0.7146   0.4265   0.8641 0.8689   0.7198
       SE-ResNeXt-50    0.4270   0.8660 0.8785   0.7238   0.4220   0.8666 0.8775   0.7220
        Inception-v4    0.4507   0.8593 0.8800   0.7300   0.4487   0.8583 0.8669   0.7246
          Densenet      0.3914   0.8383 0.8472   0.6923   0.3971   0.8394 0.8460   0.6942
          CaffeNet      0.3885   0.8563 0.8322   0.6923   0.3493   0.8460 0.8293   0.6749
           Vgg-16       0.4359   0.8665 0.8545   0.7190   0.4527   0.8700 0.8628   0.7284
         ResNet-18      0.3593   0.8520 0.8493   0.6869   0.3798   0.8571 0.8583   0.6984
         ResNet-50      0.3545   0.8483 0.8372   0.6800   0.3697   0.8535 0.8408   0.6880
        ResNeXt-50      0.4604   0.8660 0.8578   0.7280   0.4626   0.8674 0.8499   0.7266
PROD SE-ResNet-50       0.4321   0.8640 0.8613   0.7191   0.4096   0.8601 0.8571   0.7090
       SE-ResNeXt-50    0.4224   0.8663 0.8711   0.7199   0.4033   0.8630 0.8635   0.7099
        Inception-v4    0.5063   0.8793 0.8691   0.7516   0.4505   0.8668 0.8363   0.7178
          Densenet      0.4187   0.8415 0.8142   0.6915   0.3977   0.8338 0.7972   0.6762
          CaffeNet      0.3678   0.8535 0.8495   0.6903   0.3531   0.8525 0.8466   0.6841
           Vgg-16       0.3914   0.8658 0.8806   0.7126   0.3808   0.8641 0.8719   0.7056
         ResNet-18      0.3299   0.8400 0.8480   0.6727   0.3674   0.8485 0.8488   0.6882
         ResNet-50      0.3421   0.8350 0.7853   0.6541   0.3292   0.8320 0.7928   0.6513
        ResNeXt-50      0.3568   0.8605 0.8523   0.6899   0.3383   0.8574 0.8477   0.6811
Concat SE-ResNet-50     0.3940   0.8660 0.8702   0.7101   0.3707   0.8618 0.8600   0.6975
       SE-ResNeXt-50    0.4179   0.8593 0.8593   0.7121   0.4091   0.8581 0.8606   0.7093
        Inception-v4    0.3737   0.8500 0.8475   0.6904   0.3868   0.8518 0.8499   0.6961
          Densenet      0.3072   0.8495 0.8306   0.6624   0.2772   0.8438 0.8211   0.6473
          CaffeNet      0.3412   0.8485 0.8388   0.6762   0.3467   0.8500 0.8399   0.6789

Evaluation Metrics We use four evaluation metrics, including Kappa, F1-
score (F1), AUC and their mean value, denoted as Final-score, to evaluate the
performance of multi-label classification networks. Kappa coefficient is used for
consistency check, and it ranges from -1 to 1. F1 is the harmonic mean of pre-
cision and recall, which is high only when precision and recall are both high.
Since Kappa and F1 only consider a single threshold, while the output of classi-
fication networks is probabilistic, so that we use the area under the ROC curve
A Benchmark of Ocular Disease Intelligent Recognition 11
(AUC) to comprehensively consider multiple thresholds. All these four metrics
are calculated by sklearn package.
4.3 Experiment Analysis
Nine deep networks were evaluated separately on two test sets, i.e. Off-site and
On-site. Meanwhile, we experimentally verified three common feature fusion
methods. Table 3 shows the results of our experiments using three different fea-
ture fusion methods. In the table we mark the top three results of each feature
fusion method with red, green, and blue respectively. We find that compared
with the other two feature fusion methods, the experiments using element-wise
sum (SUM) feature fusion method gets better comprehensive performance.
Experimental Results We have performed experiments on our dataset for
convolutional neural network structures of different depths and widths. To verify
our conjecture, we analyzed the results of each group of experiments on the Off-
site and On-site testsets, as shown in Table 3.
0.76
0.74
0.72
0.7
Final-score
0.68 sum
prod
0.66 concat
0.64
0.62
0.6
vgg-16 resnet-18 resnet-50 resnext-50 se-resnet-50 se-resnext-50 inception-v4 densenet caffenet
Model
Fig. 4. Comparison of experimental performance among different models (sum denotes
element-wise sum, prod denotes element-wise multiplication, Final-score is the mean
value on the Off-site and On-site testsets)
In terms of network depth, Vgg-16 shows better performance than other
deeper convolutional networks, so we think that simply increasing the depth of
the neural network will not bring better results for our task. Correspondingly,
in terms of network width, such as ResNeXt-50 and Inception-v4, both have
some similar characteristics, they increase the width of the neural network to
combine the features of different dimensions to obtain a better result, which
is similar with the characteristics of multiple diseases on one eye. At the same
time, by introducing the attention mechanism, the SE module can achieve certain12 N Li et al.
effects under certain conditions, such as resnet-50, resnext-50 compared to se-
resnet-50, se-resnext-50 in Concat feature fusion mode. In addition, through the
distribution of each category on the test set, we found that our samples are
imbalance seriously, as shown in Table 2, which also poses a huge challenge to
our task. For this issue, we may need more labeled data and sampling methods
to support our mission.
On the other hand, through the experimental verification of the three fea-
ture fusion methods, as shown in Fig. 4, we find that the results of the two
feature fusion methods of element-wise sum and element-wise multiplication are
similar on each network model, which further illustrates the correctness of our
conclusion above. Meanwhile, for concat feature fusion method, we find that
the distribution of evaluation indicators is different from the other two sets of
experiments. However, because the evaluation results are not as good as other
feature fusion methods, we think that concatenating the features of the left and
right eyes simply can’t bring a good improvement to our task, and its reference
meaning is not significant. In view of the above problems, we believe that a more
structured feature fusion method is needed.
900
850
800
750
700
650
Number of Samples
600 N
550 D
500
G
450
C
400
350 A
300 H
250 M
200
O
150
100
50
0
0 1 2 3 4 5 6 7 8 9
Number of Misclassified Models
Fig. 5. Statistics on the number of samples with single label misclassified by n (0-9)
models
Bad Case Analysis In order to learn the classification of image samples, on
the On-site testset with SUM feature fusion method, we performed statistics on
the number of samples that were misclassified by the number of models on each
label. Fig. 5 shows the details of our statistics. We can find that the analysis of
single label is more helpful for our classification task, and most of the samples
of each label can be correctly classified by at least 5 models. If the results ofA Benchmark of Ocular Disease Intelligent Recognition 13
multiple models can be effectively integrated in the process of classifier design,
we believe that better multi-label classification results will be achieved.
We show some typical samples which are misclassified by most models in
Fig. 6. These images reflect some challenges and deficiencies of our dataset.
We summarize three key points. 1) Image quality. The images in (a) belong
to diabetic retinopathy, in which hard exudate can be seen clearly. However,
because of some lens stains and lighting problems, these images are misclassified.
2) Intra-class confusion. The classification of images in (b) are affected and
confused by various fundus abnormalities. For example, cataract prevents the
model from identifying hard exudate, hard exudation and drusen are difficult to
be distinguish from each other. Which makes most of our misclassified samples
are difficult to be extracted valid regional features by models. 3) Local features
are not obvious. As shown in the images of the first line in (c), the determination
of glaucoma requires accurate ratio of optic cup and disc. In the second line of
(c), AMD requires more detailed features of the macular area. For these, we need
to extract relevant local features to improve the performance of classification.
Fig. 6. Examples of misclassified images owing to different reasons. (a) camera lighting
and lens stains, (b) multiple diseases interfere with each other, (c) local features are
not obvious
5 Discussion
As one publicly available multi-disease recognition dataset, we have discussed
the characteristics of our dataset. In this section, we will discuss its challenges,
deficiencies and potential applications.
Challenge: First of all, unlike previous studies of medical image processing based
on a single fundus image, feature learning using left and right eye fundus images
as input requires more considerations, such as the spatial and structural corre-
lation of the two eyes. Second, for the classification of multiple disease labels,14 N Li et al. different fundus diseases have different local or global characteristics. For ex- ample, glaucoma is characterized by the relative size of the optic cup and optic disc, and cataracts are reflected in the clarity of various structures of the fundus. How to make suitable feature extraction schemes for different diseases in model design is a challenging task. And when multiple diseases interact in one fundus image, as shown in Fig. 6 (b), it is very difficult to identify them all correctly. Third, for the image itself, as shown in Fig. 2, due to the wide source of our im- ages, there is a wealth of intra-class diversity. In Fig. 2 (a), although they are all labeled as normal fundus, there are large differences in color, lighting, and lens shooting conditions, and the same situation also exists in other categories. At the same time, because the images in Other category are composed of a variety of uncommon fundus diseases, the differences within the class are more serious. Potential Application: On one hand, our dataset can be used as a multi-disease screening dataset. On the other hand, there are several potential applications of our dataset. 1) We can explore the correlation between fundus images and patient’s age or gender [21]. Specifically, we can train a deep neural network for age predicting, and use a heat map to visualize the decision basis of the network. 2) In clinical scenarios, it is not enough to provide only classification results, the textual description of the fundus images will be more helpful [5]. Our dataset facilitates the development of image caption algorithms since diagnostic keywords of ophthalmologists for each fundus image are provided. 3) Multi-model data makes it possible to develop more accurate disease identification models. For example, graph neural network can be used to integrate un-structured data to further improve diagnostic accuracy. Deficiency: As a work to make a bold attempt to detect multiple fundus diseases in a single fundus, our dataset also has some limitations. As a fundus image dataset with real clinical applications as the background, we believe that just 10,000 images can not really meet our application needs. In order to make related work safer and more accurate for clinical diagnosis, we need more fundus images. This can make our trained model have good generalization ability. At the same time, it can be found from Table 2 that there are serious data imbalances in different categories of our dataset. This is because some fundus diseases rarely occur clinically, and because multiple labels need to be labeled on a single image, it is difficult to ensure a balanced ratio between each category. In addition, although our dataset already provided detailed diagnostic keywords for each fundus image, they were finally divided into 8 categories. In future work, we need to perform some more fine-grained classification of fundus diseases. Finally, as an international fundus dataset, the source of images is only limited to some regions in China. In order to have a better geographical diversity of the dataset, we need fundus data from different races around the world.
A Benchmark of Ocular Disease Intelligent Recognition         15

6   Conclusions

Due to the lack of benchmark dataset hindering further development in auto-
matic classification of clinical fundus images, in this paper, we release a fundus
image dataset with multi-disease annotations. The dataset contains 10,000 im-
ages from the left and right eyes of 5,000 clinical patients, with rich diversity.
At the same time, we evaluate the performance of some existing deep learning
models on our dataset, in order to provide a valuable reference for future re-
lated work. Experimental results show that simply increasing the depth of the
neural network alone cannot improve performance, however increasing the width
of the network can bring certain improvement. Moreover, integrating multiple
deep networks will be helpful to improve classification performance. At last, the
dataset is available at https://github.com/nkicsl/OIA-ODIR.

Acknowledgements

This work is partially supported by the National Natural Science Foundation
(61872200), the Open Project Fund of State Key Laboratory of Computer Ar-
chitecture, Institute of Computing Technology, Chinese Academy of Sciences No.
CARCH201905, the Natural Science Foundation of Tianjin (19JCZDJC31600,
18YFYZCG00060).

References

 1. Kaggle           diabetic          retinopathy         detection       competition.
    https://www.kaggle.com/c/diabetic-retinopathy-detection, accessed 18-
    February-2020
 2. Alqudah, A.M.: Aoct-net: a convolutional network automated classification of mul-
    ticlass retinal diseases using spectral-domain optical coherence tomography images.
    Medical & biological engineering & computing 58(1), 41–53 (2020)
 3. Asgari, R., Orlando, J.I., Waldstein, S., Schlanitz, F., Baratsits, M., Schmidt-
    Erfurth, U., Bogunović, H.: Multiclass segmentation as multitask learning for
    drusen segmentation in retinal optical coherence tomography. In: International
    Conference on Medical Image Computing and Computer-Assisted Intervention.
    pp. 192–200. Springer (2019)
 4. Brandl, C., Breinlich, V., Stark, K.J., Enzinger, S., Aßenmacher, M., Olden, M.,
    Grassmann, F., Graw, J., Heier, M., Peters, A., et al.: Features of age-related
    macular degeneration in the general adults and their dependency on age, sex, and
    smoking: results from the german kora study. PloS one 11(11) (2016)
 5. Chelaramani, S., Gupta, M., Agarwal, V., Gupta, P., Habash, R.: Multi-task learn-
    ing for fine-grained eye disease prediction. In: Asian Conference on Pattern Recog-
    nition. pp. 734–749. Springer (2019)
 6. Chen, X., Xu, Y., Duan, L., Yan, S., Zhang, Z., Wong, D.W.K., Liu, J.: Multi-
    ple ocular diseases classification with graph regularized probabilistic multi-label
    learning. In: Asian Conference on Computer Vision. pp. 127–142. Springer (2014)
16 N Li et al.
7. Choi, J.Y., Yoo, T.K., Seo, J.G., Kwak, J., Um, T.T., Rim, T.H.: Multi-categorical
deep learning neural network to classify retinal images: a pilot study employing
small database. PloS one 12(11) (2017)
8. Costagliola, C., Dell’Omo, R., Romano, M.R., Rinaldi, M., Zeppa, L., Parmeggiani,
F.: Pharmacotherapy of intraocular pressure: part i. parasympathomimetic, sym-
pathomimetic and sympatholytics. Expert opinion on Pharmacotherapy 10(16),
2663–2677 (2009)
9. Decencière, E., Cazuguel, G., Zhang, X., Thibault, G., Klein, J.C., Meyer, F.,
Marcotegui, B., Quellec, G., Lamard, M., Danno, R., et al.: Teleophta: Machine
learning and image processing methods for teleophthalmology. Irbm 34(2), 196–203
(2013)
10. Decencière, E., Zhang, X., Cazuguel, G., Lay, B., Cochener, B., Trone, C., Gain,
P., Ordonez, R., Massin, P., Erginay, A., et al.: Feedback on a publicly distributed
image database: the messidor database. Image Analysis & Stereology 33(3), 231–
234 (2014)
11. Foong, A.W., Saw, S.M., Loo, J.L., Shen, S., Loon, S.C., Rosman, M., Aung, T.,
Tan, D.T., Tai, E.S., Wong, T.Y.: Rationale and methodology for a population-
based study of eye diseases in malay people: The singapore malay eye study (simes).
Ophthalmic epidemiology 14(1), 25–35 (2007)
12. Fumero, F., Alayón, S., Sanchez, J.L., Sigut, J., Gonzalez-Hernandez, M.: Rim-
one: An open retinal image database for optic nerve evaluation. In: 2011 24th
international symposium on computer-based medical systems (CBMS). pp. 1–6.
IEEE (2011)
13. Garcı́a-Floriano, A., Ferreira-Santiago, Á., Camacho-Nieto, O., Yáñez-Márquez,
C.: A machine learning approach to medical image classification: Detecting age-
related macular degeneration in fundus images. Computers & Electrical Engineer-
ing 75, 218–229 (2019)
14. He, Y., Carass, A., Liu, Y., Jedynak, B.M., Solomon, S.D., Saidha, S., Calabresi,
P.A., Prince, J.L.: Fully convolutional boundary regression for retina oct segmen-
tation. In: International Conference on Medical Image Computing and Computer-
Assisted Intervention. pp. 120–128. Springer (2019)
15. Hoover, A., Kouznetsova, V., Goldbaum, M.: Locating blood vessels in retinal
images by piecewise threshold probing of a matched filter response. IEEE Trans-
actions on Medical Imaging 19(3), 203–210 (2000)
16. Jia, Y., Shelhamer, E., Donahue, J., Karayev, S., Long, J., Girshick, R., Guadar-
rama, S., Darrell, T.: Caffe: Convolutional architecture for fast feature embedding.
In: Proceedings of the 22nd ACM international conference on Multimedia. pp.
675–678 (2014)
17. Lee, K., Niemeijer, M., Garvin, M.K., Kwon, Y.H., Sonka, M., Abramoff, M.D.:
Segmentation of the optic disc in 3-d oct scans of the optic nerve head. IEEE
Transactions on Medical Imaging 29(1), 159–168 (2009)
18. Li, T., Gao, Y., Wang, K., Guo, S., Liu, H., Kang, H.: Diagnostic assessment of
deep learning algorithms for diabetic retinopathy screening. Information Sciences
501, 511–522 (2019)
19. Mehta, P., Lee, A.Y., Lee, C., Balazinska, M., Rokem, A.: Multilabel multiclass
classification of oct images augmented with age, gender and visual acuity data.
bioRxiv p. 316349 (2018)
20. Mokhtari, M., Rabbani, H., Mehri-Dehnavi, A., Kafieh, R., Akhlaghi, M.R.,
Pourazizi, M., Fang, L.: Local comparison of cup to disc ratio in right and left
eyes based on fusion of color fundus images and oct b-scans. Information Fusion
51, 30–41 (2019)A Benchmark of Ocular Disease Intelligent Recognition 17
21. Poplin, R., Varadarajan, A.V., Blumer, K., Liu, Y., McConnell, M.V., Corrado,
G.S., Peng, L., Webster, D.R.: Prediction of cardiovascular risk factors from retinal
fundus photographs via deep learning. Nature Biomedical Engineering 2(3), 158
(2018)
22. Quigley, H.A., Broman, A.T.: The number of people with glaucoma worldwide in
2010 and 2020. British journal of ophthalmology 90(3), 262–267 (2006)
23. Rasti, R., Rabbani, H., Mehridehnavi, A., Hajizadeh, F.: Macular oct classification
using a multi-scale convolutional neural network ensemble. IEEE Transactions on
Medical Imaging 37(4), 1024–1034 (2017)
24. Schlegl, T., Waldstein, S.M., Bogunovic, H., Endstraßer, F., Sadeghipour, A.,
Philip, A.M., Podkowinski, D., Gerendas, B.S., Langs, G., Schmidt-Erfurth, U.:
Fully automated detection and quantification of macular fluid in oct using deep
learning. Ophthalmology 125(4), 549–558 (2018)
25. Sengupta, S., Singh, A., Leopold, H.A., Gulati, T., Lakshminarayanan, V.: Oph-
thalmic diagnosis using deep learning with fundus images-a critical review. Artifi-
cial Intelligence in Medicine p. 101758 (2019)
26. Tan, J.H., Bhandary, S.V., Sivaprasad, S., Hagiwara, Y., Bagchi, A., Raghavendra,
U., Rao, A.K., Raju, B., Shetty, N.S., Gertych, A., et al.: Age-related macular
degeneration detection using deep convolutional neural network. Future Generation
Computer Systems 87, 127–135 (2018)
27. Ting, D.S.W., Wu, W.C., Toth, C.: Deep learning for retinopathy of prematurity
screening. British Journal of Ophthalmology 103(5), 577–579 (2019)
28. Wang, X., Ju, L., Zhao, X., Ge, Z.: Retinal abnormalities recognition using regional
multitask learning. In: International Conference on Medical Image Computing and
Computer-Assisted Intervention. pp. 30–38. Springer (2019)
29. Wong, T., Aiello, L., Ferris, F., Gupta, N., Kawasaki, R., Lansingh, V., et al.:
Updated 2017 ico guidelines for diabetic eye care. International Journal of Oph-
thalmology pp. 1–33 (2017)
30. Zhang, F., Xu, X., Xiao, Z., Wu, J., Geng, L., Wang, W., Liu, Y.: Automated
quality classification of colour fundus images based on a modified residual dense
block network. Signal, Image and Video Processing 14(1), 215–223 (2020)
31. Zhang, H., Niu, K., Xiong, Y., Yang, W., He, Z., Song, H.: Automatic cataract
grading methods based on deep learning. Computer methods and programs in
biomedicine 182, 104978 (2019)
32. Zhang, Z., Yin, F.S., Liu, J., Wong, W.K., Tan, N.M., Lee, B.H., Cheng, J., Wong,
T.Y.: Origa-light: An online retinal fundus image database for glaucoma analysis
and research. In: 2010 Annual International Conference of the IEEE Engineering
in Medicine and Biology. pp. 3065–3068. IEEE (2010)
33. Zhou, Y., Li, G., Li, H.: Automatic cataract classification using deep neural network
with discrete state transition. IEEE Transactions on Medical Imaging 39(2), 436–
446 (2020)You can also read