Regional-level risk factors for severe hand- foot-and-mouth disease: an ecological study from mainland China
←
→
Page content transcription
If your browser does not render page correctly, please read the page content below
Pan et al. Environmental Health and Preventive Medicine               (2021) 26:4
https://doi.org/10.1186/s12199-020-00927-9
                                                                                                               Environmental Health and
                                                                                                                     Preventive Medicine

 RESEARCH ARTICLE                                                                                                                                  Open Access

Regional-level risk factors for severe hand-
foot-and-mouth disease: an ecological
study from mainland China
Qing Pan1, Fengfeng Liu2, Juying Zhang1, Xing Zhao1, Yifan Hu1, Chaonan Fan1, Fan Yang1, Zhaorui Chang2* and
Xiong Xiao1*

  Abstract
  Background: Severe hand-foot-and-mouth disease (HFMD) is a life-threatening contagious disease among young
  children and infants. Although enterovirus A71 has been well acknowledged to be the dominant cause of severe
  HFMD, there still remain other unidentified risk factors for severe HFMD. Previous studies mainly focused on
  identifying the individual-level risk factors from a clinical perspective, while rare studies aimed to clarify the
  association between regional-level risk factors and severe HFMD, which may be more important from a public
  health perspective.
  Methods: We retrieved the clinical HFMD counts between 2008 and 2014 from the Chinese Center for Disease
  Control and Prevention, which were used to calculated the case-severity rate in 143 prefectural-level cities in
  mainland China. For each of those 143 cities, we further obtained city-specific characteristics from the China City
  Statistical Yearbook (social and economic variables) and the national meteorological monitoring system
  (meteorological variables). A Poisson regression model was then used to estimate the associations between city-
  specific characteristics (reduced by the principal component analysis to avoid multicollinearity) and the case-severity
  rate of HFMD. The above analysis was further stratified by age and gender to examine potential modifying effects
  and vulnerable sub-populations.
  Results: We found that the case-severity rate of HFMD varied dramatically between cities, ranging from 0 to 8.09%.
  Cities with high case-severity rates were mainly clustered in Central China. By relating the case-severity rate to city-
  specific characteristics, we found that both the principal component characterized by a high level of social and
  economic development (RR = 0.823, 95%CI 0.739, 0.916) and another that characterized by warm and humid
  climate (RR = 0.771, 95%CI 0.619, 0.960) were negatively associated with the case-severity rate of HFMD. These
  estimations were consistent across age and gender sub-populations.
  (Continued on next page)

* Correspondence: changzr@chinacdc.cn; xiaoxiong.scu@scu.edu.cn
2
 Division of Infectious Disease & Key Laboratory of Surveillance and Early
Warning on Infectious Disease, Chinese Center for Disease Control and
Prevention, Beijing 102206, PR China
1
 Department of Epidemiology and Biostatistics, West China School of Public
Health and West China Fourth Hospital, Sichuan University, Chengdu,
Sichuan 610041, PR China

                                       © The Author(s). 2021 Open Access This article is licensed under a Creative Commons Attribution 4.0 International License,
                                       which permits use, sharing, adaptation, distribution and reproduction in any medium or format, as long as you give
                                       appropriate credit to the original author(s) and the source, provide a link to the Creative Commons licence, and indicate if
                                       changes were made. The images or other third party material in this article are included in the article's Creative Commons
                                       licence, unless indicated otherwise in a credit line to the material. If material is not included in the article's Creative Commons
                                       licence and your intended use is not permitted by statutory regulation or exceeds the permitted use, you will need to obtain
                                       permission directly from the copyright holder. To view a copy of this licence, visit http://creativecommons.org/licenses/by/4.0/.
                                       The Creative Commons Public Domain Dedication waiver (http://creativecommons.org/publicdomain/zero/1.0/) applies to the
                                       data made available in this article, unless otherwise stated in a credit line to the data.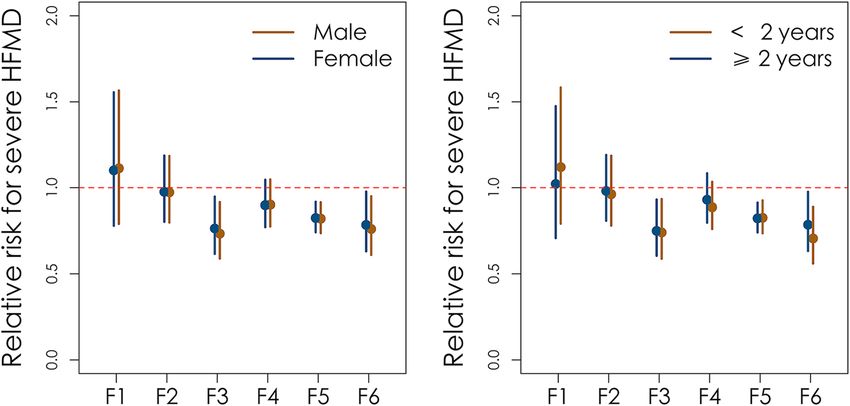
Pan et al. Environmental Health and Preventive Medicine   (2021) 26:4                                                     Page 2 of 9

 (Continued from previous page)
 Conclusion: Except for the type of infected pathogen, the case-severity rate of HFMD was closely related to city
 development and meteorological factor. These findings suggest that social and environmental factors may also play
 an important role in the progress of severe HFMD.
 Keywords: Hand, foot and mouth disease, Case-severity rate, City-specific characteristics, Ecological study

Introduction                                                            estimating their impact on epidemic of severe HFMD,
Hand-foot-and-mouth disease (HFMD) is a contagious                      such as medical resource allocation, meteorological fea-
disease caused by the enterovirus. Most cases of HFMD                   tures, GDP, and population scale. Notably, previous
are mild and self-limited, but a small proportion could                 studies were mainly limited in a specific province, and a
further develop to severe complications affecting the                   nationwide study covering multidimensional factors is
central nervous systems [1, 2]. Due to its rapid progres-               still in lack.
sion and the lack of effective antiviral medications [3–5],               Therefore, to address the above research gap, we con-
the prognosis of severe HFMD cases is usually poor [6,                  ducted this nationwide study including 143 prefectural-
7]. Patients often suffer due to high medical expenses [8]              level cities and abundant city-level characteristics to
and poor quality of life [9]. Enterovirus A71 (EV-A71)                  identify regional-level risk factors for the severe HFMD.
has been shown to be the dominant pathogen causing
severe HFMD [1, 10]. Approximately 80% and 95% of se-                   Methods
vere and fatal cases test positive for EV-A71, respectively             City selection
[1, 11]. However, among the EV-A71 infected cases, only                 In the current study, the observational units were cities
23.88% and 1.89% develop into severe and fatal cases                    in mainland China. For each city, the city-specific char-
[12], implying that there still remain other unidentified               acteristics and case-severity rate were used as the covari-
risk factors for severe HFMD.                                           ates and outcome, respectively. City selection was based
  The overwhelming majority of prior studies mainly fo-                 on the availability of meteorological covariates and the
cused on examining the associations between severe                      case-severity rate. The case-severity rate was calculated
HFMD and individual-level risk factors, such as individual              for 293 cities in mainland China based on daily counts
demographic characteristics, early clinical manifestations,             of HFMD clinical cases [22]. Meteorological covariates
and genetic susceptibility. It has been found that younger              were collected from 646 national ground meteorological
[13] and male sex [14] were more vulnerable to severe                   stations through the China Meteorological Data Sharing
HFMD, while breastfeeding and hand washing after playing                Service System. After matching meteorological stations
[15] were found to be protective. Clinical manifestations in-           with their corresponding cities, 143 cities were included
cluding high fever, vomiting, myoclonic twitching, and ele-             in the current study [22, 23]. Each of those 143 cities
vated serum interleukins and interferon-γ levels were found             was further defined as the main central urban area in
to be early indicators of severe cases [16]. The presence of            each prefecture (i.e., the prefectural-level city) [22]. This
the rs4290270 SNP in the TPH2 gene was associated with                  is because prefecture-level cities usually have a larger
increased susceptibility to severe HFMD [17].                           population which is more important for infectious dis-
  Although those above individual-level studies have                    ease control. Additionally, when compared with small
provided important insights for identifying high-risk                   cities, the prefecture-level cities have better surveillance
individuals from a clinical perspective, there is still an              systems that can guarantee data quality.
urgent need to clarify the associations between regional-
level risk factors and severe HFMD. This would provide
a deeper understanding of why severe HFMD cases are                     City-specific case-severity rate of HFMD
more likely to occur in specific regions, and then provide              The city-specific case-severity rate was chosen as the
evidences on how to better control severe HFMD from a                   outcome variable due to its representation of the re-
public health perspectives. To the best of our knowledge,               gional disease burden of severe HFMD [1]. It was de-
rare studies have paid special attention to the associa-                fined as the total number of severe cases divided by the
tions between regional-level risk factors and severe                    total number of probable cases from 1 January 2008 to
HFMD [18–21]. Only a few studies sporadically reported                  30 December 2014. Severe cases were defined as clinical
higher population density [21], rural living [18], and                  cases with any CNS complications, cardiopulmonary
lower socioeconomic status [18] would raise the epi-                    dysfunction, or both. Probable cases were defined as pa-
demic of severe HFMD. In fact, there were remaining                     tients with a papular or vesicular rash on the hands, feet,
other regional-level factors should be considered when                  mouth, or buttocks, with or without fever [1]. All cases
                                                                        were collected from the daily counts of clinical HFDM
Pan et al. Environmental Health and Preventive Medicine (2021) 26:4 Page 3 of 9
cases through the China Information System for Disease Dimensionality reduction of city-specific characteristics
Control and Prevention. Using this system, other To reduce multicollinearity, city-specific covariates with
variables, including patient age, gender, enterovirus sero- a variance inflation factor (VIF) ≥ 5 [26] were com-
types, time from symptom onset to diagnosis, and sever- pressed by principal component analysis (PCA) [27] (see
ity (mild or severe), were also extracted. In addition, as Additional file 1: Table S2 for the variance inflation fac-
over 99% of HFMD cases occurred among children tor (VIF) of each city-specific variable). New variables
under the age of 12 years (i.e., children in elementary (principal components, PCs) and city-specific covariates
school and below) according to our preliminary analysis with a VIF < 5 were used as regressors in the subse-
[22]. Therefore, in the current study, we mainly focused quently generated core model.
on the incidence of HFMD among children aged 0–12
years. Estimating associations between case-severity rate and city-
The starting point of the observation period was 1 specific characteristics
January 2008, as all probable and laboratory-confirmed A Poisson regression was applied to examine the associ-
HFMD cases were required to be reported to the Chinese ations between the case-severity rate and city-specific
Centre for Disease Control and Prevention (China CDC) characteristics. The principal components and city-
since 1 January 2008 [1], before when relevant data were specific variables (VIF < 5) were the regressors, the cu-
not available. The endpoint was set at 30 December 2014 mulative number of severe cases during the observation
because the EV71 vaccine was approved for marketing on period was the outcome, and the natural logarithm of
3 December 2015 [24], after when the epidemiology of the corresponding probable cases was the offset.
HFMD might has become altered.
Stratification analysis
City-specific characteristics Stratification analysis on gender and age-group were fur-
The city-specific characteristics mainly included socio- ther carried out based on the core model. Gender and
economic and meteorological variables. The socioeco- age were the most important demographic characteris-
nomic variables were collected from the China City tics [1, 28] [29–34]; therefore, stratification analyses on
Statistical Yearbook [25] including demographic vari- gender and age were used to identify potential vulner-
ables (population density and rate of population in- able sub-populations. The cutoff value of age group was
crease), economic variables (GDP per person and rate of 2 years old (age ≥ 2 years vs. age < 2 years), as 2 years
GDP increase), health resources (number of licensed has been observed to be the peak age of both incidence
physicians, hospital beds, and hospitals per 1000 per- and severity-case rate [1, 28].
sons), traffic (total travel passengers per year), number All statistical analyses were performed using R soft-
of elementary school students per 1000 persons, and per ware (Version 3.6.1; R Core Team, 2019), mainly using
capita public green areas. Meteorological variables, in- the packages “GLM” and “principal.” Spatial distribution
cluding relative humidity, temperature, rainfall, and sun- maps of HFMD incidence and case-severity rate were
shine hours, were extracted from daily meteorological made using ArcGIS Pro (version 2.4, authorization num-
monitoring data. Arithmetic means for meteorological ber: EFL734321752).
variables were calculated for each 143 cities to exhibit
the city level meteorological differences. Results
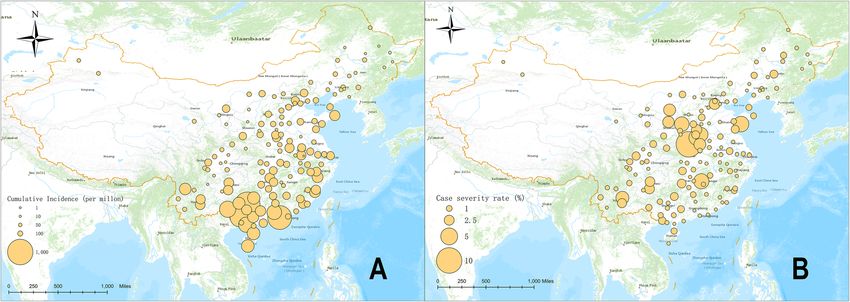
Spatial distribution of case-severity rate and incidence of
HFMD
Statistical analysis In the current analysis, 143 cities were included, cover-
Comparisons of city-specific characteristics between city ing the majority of the medium and large size cites cities
groups in mainland China. A total of 3,656,006 probable cases,
To answer why severe HFMD cases prone to occur at including 27,690 severe cases (cases-severity risk 0.76%)
specific regions, two city groups were defined. Cities were observed in the period from 2008 to 2014. The 7-
with a high case-severity and a low incidence were clas- year cumulative incidence of HFMD ranged from 11.70
sified as severe HFMD burdened areas (ranked 51–100% per million to 744.97 per million, and the case-severity
in case-severity rate, and 1–50% in incidence). Cities rate ranged from 0 to 8.09%. Discrepant spatial distribu-
with a low case-severity rate and a high incidence were tions of the case-severity rate and HFMD incidence were
classified as less burdened areas (ranked 1–50% in case- observed. High HFMD incidence was observed in the
severity rate, and 51–100% in incidence). Then compari- Pearl River Delta and the South Area (Fig. 1a), while high
sons of city-specific characteristics between these two case-severity rates were observed was in Central China, in-
groups were conducted. cluding Henan, Shandong, and Shanxi provinces (Fig. 1b).Pan et al. Environmental Health and Preventive Medicine (2021) 26:4 Page 4 of 9
Fig. 1 The spatial distribution of case-severity rate and HFMD incidence (circle diameter at each coordinate is proportional to the corresponding
value). a Cumulative incidence of HFMD (per million). b Case-severity rate of severe HFMD (%)
Comparison of city-specific characteristics between severe Associations between case-severity rate and city-specific
HFMD burdened and less burdened areas characteristics
There were 30 cities classified into severe HFDM bur- City development and meteorological indicators were
dened areas, and 30 cities into the less burdened areas two principal components generated by PCA. The city
(see Additional file 1: Table S1 for classification of severe development indicator was characterized by high levels
HFMD burdened and less burdened areas). Comparisons of social and economic development level and accounted
between those two areas revealed that severe HFMD for 66% of the total variance. The meteorological indica-
burdened areas had lower GDP and GDP per person, tor was characterized by warm and humid climate and
lower population density, fewer licensed doctors, fewer accounted for 34% of the total variance. The case-
per capita public green areas, lower average temperature, severity rate of HFMD was negatively associated with
and less average rainfall (Table 1). GDP increase rate (RR = 0.745, P = 0.009), city
Table 1 Comparison of social demographic, economic, and meteorological qualities between subgroups
Variables Less burdened areas Burdened areas t/Z P value
(N = 30) (N = 30)
Average population (millions) 93.11(56.07, 230.74) 96.94(66.34, 142.34) − 0.296 0.767
Population increase rate (%) 5.70(2.93, 7.75) 6.08(1.14, 13.32) − 0.451 0.652
Population density (people/km2) 1184.40(444.56, 1629.07) 500.31(287.98, 893.66) − 2.632 0.008
Number of elementary school students (10,000) 6.65(4.67, 16.96) 7.60(5.26, 11.71) − 0.444 0.657
GDP (CNY) 4608857.00 2659869.50 − 2.750 0.006
(2483430.00, 21241202.80) (1176241.00, 4537211.50)
GDP per person (CNY) 55099.00 30374.00 − 3.947 < 0.001
(36597.25, 66345.25) (17131.75, 47843.25)
GDP increase rate (%) 14.39 ± 2.10 14.46 ± 3.38 − 0.092 0.927
Traffic passengers (10,000) 9904.45 6844.86 − 1.124 0.261
(4101.32, 20577.51) (4567.86, 11211.64)
Number of hospitals (per thousand) 48.00(28.50, 110.50) 58.50(33.00, 94.25) − 0.569 0.569
Number of hospital beds (per thousand) 7261.50(3342.00, 20019.00) 4756.00(3237.50, 7554.25) − 1.434 0.152
Number of licensed doctors (per thousand) 3623.00(1684.75, 9729.25) 2198.50(1355.00, 3528.00) − 1.959 0.050
Per capita public green area (m2) 36.00(28.25, 54.75) 25.00(14.75, 33.00) − 3.491 < 0.001
Average temperature (°F) 176.96 ± 38.93 138.05 ± 51.39 3.306 0.002
Average relative humidity (%) 70.04 ± 8.63 65.85 ± 9.03 1.837 0.071
Average rainfall (mm) 35.89 ± 15.50 23.42 ± 11.72 3.514 0.001
Average sunshine (min) 50.81 ± 8.18 54.22 ± 15.08 − 1.089 0.282Pan et al. Environmental Health and Preventive Medicine (2021) 26:4 Page 5 of 9
development indicator (RR = 0.823 P < 0.001), and me- developed areas. Poor personal hygiene, insufficient
teorological indicator (RR = 0.771, P = 0.022) (Table 2). knowledge of disease, and delayed therapy increase
the number of severe HFMD cases, thus resulting in
Stratification analysis by gender and age group a higher case-severity rate. Therefore, we suggest in-
In the stratification analysis by gender, the results of the creasing the allocation of local medical resources and
core model were consistent. Both in the male and female improving accessibility, as this might reduce the re-
sub-populations, the GDP increase rate, city develop- gional disease burden of severe HFMD.
ment indicator, and meteorological feature were all sig- We found that the meteorological feature indicator
nificantly negatively correlated with the case-severity representing a warm and humid climate was nega-
rate (Table 3, Fig. 2a). When stratified by age, the results tively associated with the case-severity rate. One pos-
of the core model were also consistent. In the two age sible explanation might be that in a warm and humid
groups, the GDP increase rate, city development indica- climate, an increase of probable cases will be more
tor, and meteorological feature were all significantly pronounced than the increase of severe cases. At
negatively correlated to the case-severity rate (Table 4, present, most of the researches support the idea that
Fig. 2b). the number of probable cases would increase in a
warm and humid climate [22, 38–40]. This is because
Discussion higher temperatures may increase host activity, result-
Using nationwide data on severe HFMD, we observed ing in more frequent contact between infected and
the city-specific characteristics were related to regional susceptible individuals. On humid days, enteroviruses
differences in the case-severity rate. Our main findings can be easily attached to the small articles in the air,
suggest that beyond the type of infected pathogen, atten- resulting in easier transmission of enteroviruses [40].
tion to social and environmental factors is necessary for In addition, on sunny days, ultraviolet radiation could
controlling epidemics of severe HFMD. In addition, lead to inactivation of enteroviruses [39, 41]. How-
based on the spatial distribution of the case-severity rate ever, the increase in severe cases would be less obvi-
and incidence, we found that areas of high HMFD inci- ous than the increase in probable cases. This is
dence were mainly in the Pearl River Delta and South because progression to severe HFMD not is only de-
China, while areas of high case-severity rates were termined by enteroviral infection, but also depends on
mainly located in Central China. individual immunity [42] and medical treatment [33].
The city development indicator was negatively asso- Therefore, in a warm and humid climate, a faster in-
ciated with the case-severity rate, indicating case- crease of total HFMD cases would accompanied by a
severity rate was higher in areas with lower economic decreased case-severity rate.
development and insufficient medical resources. This Previous studies have shown that both HFMD inci-
phenomenon might be due to that the rural living dence [1] and case-severity rate [21] were positively cor-
[35, 36], lower socioeconomic status [21], and insuffi- related with the population density, while this
cient medical capacity [37] are more common in less relationship is non-significant in severe HFMD incidence
Table 2 The Poisson regression model for associations between case-severity rate and city-specific characteristics
Variables Estimate SE t P value RR (95%CI) b RR (95%CI) a
Population increase rate 0.104 0.175 0.595 0.553 1.109 1.024
(0.788, 1.562) (0.718, 1.459)
Population density − 0.026 0.100 − 0.261 0.795 0.974 1.041
(0.801, 1.186) (0.820, 1.323)
GDP increase rate − 0.294 0.112 − 2.635 0.009 0.745 0.921
(0.599, 0.927) (0.777, 1.092)
Per capita public green areas − 0.105 0.077 − 1.362 0.175 0.901 0.868
(0.775, 1.047) (0.751, 1.003)
City development − 0.195 0.055 − 3.561 < 0.001 0.823 0.893
(0.739, 0.916) (0.821, 0.970)
Meteorological feature − 0.261 0.112 − 2.321 0.022 0.771 0.723
(0.619, 0.960) (0.592, 0.882)
Intercept − 4.666 0.137 − 33.952 < 0.001 0.009 –
(0.007, 0.012)
a
The crude RR for case-severity rate
b
The adjusted RR in multivariate Poisson regressionPan et al. Environmental Health and Preventive Medicine (2021) 26:4 Page 6 of 9
Table 3 Stratified analysis of the Poisson regression model in male and female subgroups
Variables Male Female
b
RR RR a RR b
RR a
Population increase rate 1.113 1.012 1.101 1.041
(0.791, 1.566) (0.719, 1.441) (0.780, 1.556) (0.729, 1.487)
Population density 0.973 1.040 0.976 1.041
(0.799, 1.185) (0.819, 1.323) (0.803, 1.187) (0.820, 1.323)
GDP increase rate 0.734 0.912 0.764 0.937
(0.589, 0.916) (0.769, 1.083) (0.616, 0.948) (0.792, 1.108)
Per capita public green areas 0.902 0.867 0.899 0.869
(0.776, 1.048) (0.751, 1.000) (0.772, 1.046) (0.750, 1.006)
City development 0.821 0.897 0.825 0.886
(0.737, 0.915) (0.824, 0.975) (0.742, 0.918) (0.816, 0.963)
Meteorological feature 0.761 0.715 0.785 0.734
(0.610, 0.950) (0.587, 0.872) (0.631, 0.977) (0.601, 0.897)
Intercept 0.010 – 0.009 –
(0.007, 0.013) (0.007, 0.012)
a
The crude RR for case-severity rate
b
The adjusted RR in multivariate Poisson regression
[21]. In the current study, we found that the relationship trends, the relationship between population density
between population density and the case-severity rate and case-severity rate might be non-significant. More-
was non-significant. This might for the following rea- over, based on the interpretation of statistical model-
sons: first, we hypothesized that two opposing forces ing, the non-significance of the population density
might drive the relationship between population dens- indicates its impact on the case-severity rate was
ity and case-severity rate. On the one hand, more weaker than the impact from the city development
densely populated areas typically have better socioeco- and meteorological indicators. Therefore, we suggest
nomic status and sufficient medical resources. Chil- that in addition to physical isolation measures, ad-
dren in those areas are often better cared by more equate health resources and timely treatment are cru-
educated caregivers (resulting in lower case-severity cial for controlling severe HFMD.
rate). On the other hand, more densely populated This study had two major strengths. First, this is a
areas have a higher severe HFMD detection rate with city-level study. Unlike the individual-level studies focus-
more sufficient medical facilities (resulting in a higher ing on the diagnosis and treatment of clinical cases, re-
case-severity rate). Therefore, given both of these sults from the current study are crucial for public health
Fig. 2 Stratified analysis by gender and age group. a Coefficients from the core model stratified by gender. b Coefficients from the core model
stratified by age; F1, F2, F3, F4, F5, and F6 corresponded to the covariates (F1: population increase rate, F2: population density, F3: GDP increase
rate, F4: per capita public green areas, F5: city development, F6: meteorological feature)Pan et al. Environmental Health and Preventive Medicine (2021) 26:4 Page 7 of 9
Table 4 Stratified analysis of the Poisson regression model in different age groups
Variables Greater than or equal to 2 years old Less than 2 years old
b
RR RR a RR b
RR a
Population increase rate 1.022 0.953 1.120 0.982
(0.708,1.475) (0.659, 1.378) (0.792, 1.584) (0.681, 1.425)
Population density 0.981 1.045 0.962 1.041
(0.809,1.191) (0.843, 1.305) (0.781, 1.186) (0.799, 1.357)
GDP increase rate 0.750 0.914 0.741 0.897
(0.605,0.931) (0.779,1.073) (0.588, 0.934) (0.744, 1.080)
Per capita public green areas 0.930 0.894 0.887 0.839
(0.798,1.084) (0.779, 1.027) (0.761, 1.034) (0.723, 0.973)
City development 0.823 0.906 0.826 0.894
(0.741,0.913) (0.836, 0.981) (0.736, 0.926) (0.815, 0.981)
Meteorological feature 0.786 0.738 0.706 0.659
(0.633,0.976) (0.612, 0.889) (0.560, 0.890) (0.534, 0.813)
Intercept 0.007 – 0.013 –
(0.005,0.009) (0.01, 0.017)
a
The crude RR for case-severity rate
b
The adjusted RR in multivariate Poisson regression
decision-making. Second, this is a nationwide study with allocation and the level of city development. Enhancing
multiple covariates, which can provide a stable estima- the medical resource allocation and improving it accessi-
tion on the associations between case-severity rate and bility among rural population might result in improved
city-specific characteristics. disease prevention and control.
This study has four main limitations. The first one
is the intrinsic nature of ecological study. Conclusions Supplementary Information
from the current study were based on the population The online version contains supplementary material available at https://doi.
org/10.1186/s12199-020-00927-9.
scale, inference on other situations should be careful.
The second limitation is related to the data quality.
Additional file 1: Table S1 Classification of severe HFMD burdened
Since our data was collected from surveillance data, and less burdened groups for the 143 cities. Table S2 Variance inflation
under-reporting from surveillance data might intro- factor for city-specific characteristics. Table S3 Principal component load-
ings on part of city-specific characteristics. Figure S1 Visualization of the
duce extra basis. However, the cumulative numbers
principal component analysis. A. The principal component loadings of
from 2008 to 2014 were used as outcome, which are the first three principal components. B. The map of variable-categorizing
more reliable than single observations under mild based on the first two principal components (PC_1, PC_2 correspond to
the City development and Meteorological features, respectively.). Table
under-reporting conditions. The third limitation is
S4 The Poisson regression model for associations between city character-
that the city-specific EV-A71 infection rate was not istics and case-severity rate in male cases. Table S5 The Poisson regres-
included in the core model. This is because that sion model for associations between city characteristics and case-severity
rate in female cases. Table S6 The Poisson regression model for associa-
laboratory-based diagnosis of HFMD was only avail-
tions between city characteristics and case-severity rate in patients under
able in a small fraction of the total HFMD cases. two years. Table S7 The Poisson regression model for associations be-
Therefore, city-specific EV-A71 infection rate were tween city characteristics and case-severity rate in patients above and
equal to two years
not available. The final limitation is the study period,
which did not extend into most recent years. As the
Abbreviations
EV71 vaccine was approved for marketing on 3 De- CA-V16: Coxsackievirus A16; CDC: Center for Disease Control; EV-
cember 2015 [24], the epidemiology of HFMD has A71: Enterovirus 71; HFMD: Hand-foot-and-mouth disease; GDP: Gross
since changed. Further studies comparing those asso- domestic product
ciations before and after the introduction of the vac-
Acknowledgements
cine are necessary. The authors thank the Chinese Center for Disease Control and Prevention for
providing data.
Conclusion
Authors’ contributions
In conclusion, the case-severity rate is an indicator of se- X Xiao and Z Chang conceived and designed the study. Q Pan and F Liu
vere HFMD disease burden, unlike the incidence of implemented the data analysis. Q Pan, F Liu, Z Chang, and X Xiao drafted
HFMD, which is mainly affected by enterovirus, me- the manuscript. J Zhang, X Zhao, Y Hu, C Nan, and F Yang participated in
data collection, preliminary data analysis, and manuscript revision. X Xiao
teorological factors, and population density. The case- and R Chang interpreted the results and revised the manuscript. All authors
severity rate was closely related to medical resource read and approved the final manuscript.Pan et al. Environmental Health and Preventive Medicine (2021) 26:4 Page 8 of 9
Funding 16. Cai K, Wang Y, Guo Z, Yu H, Li H, Zhang L, et al. Clinical characteristics and
This study was primarily sponsored by the National Natural Science managements of severe hand, foot and mouth disease caused by
Foundation of China (grant number 81903415) and the Key R&D Project of enterovirus A71 and coxsackievirus A16 in Shanghai, China. BMC Infect Dis.
Sichuan Province Science and Technology Support Program (grant number 2019;19:285.
2020YFS0215). Xing Zhao was supported by the National Natural Science 17. Meng Y, Xiong T, Zhao R, Liu J, Yu G, Xiao J, et al. Genome-wide association
Foundation of China (grant number U1903123, and 81773548). study identifies TPH2 variant as a novel locus for severe CV-A6-associated
hand, foot, and mouth disease in Han Chinese. Int J Infect Dis. 2020;98:268–
Availability of data and materials 74.
The meteorological data used in the study are available from the China 18. Wang Y, Zhao H, Ou R, Zhu H, Gan L, Zeng Z, et al. Epidemiological and
Meteorological Data Network (http://data.cma.cn/en). The Socioeconomic clinical characteristics of severe hand-foot-and-mouth disease (HFMD)
data used in the study are available from the statistical yearbook (http:// among children: a 6-year population-based study. BMC Public Health. 2020;
www.stats-sd.gov.cn/). Other data is available from the corresponding author 20:801.
on reasonable request. 19. Ji H, Fan H, Lu PX, Zhang XF, Ai J, Shi C, et al. Surveillance for severe hand,
foot, and mouth disease from 2009 to 2015 in Jiangsu province:
Ethics approval and consent to participate epidemiology, etiology, and disease burden. BMC Infect Dis. 2019;19:18.
Not applicable. 20. Yu S, Zhou Z, Yang F, Xiao G, Ma J. Temporal and spatial clustering
characteristics and changes of severe hand, foot, and mouth disease in
Consent for publication mainland of China, from 2008 to 2013. Zhonghua Liu Xing Bing Xue Za Zhi.
Not applicable. 2014;35:271–5.
21. Chen SM, Qin L, Du ZH, Jin YM, Du JW, Chen Y, et al. Spatial clustering of
Competing interests severe hand-foot-mouth disease cases on Hainan Island, China. Jpn J Infect
The authors declare no conflicts of interest. Dis. 2017;70:604–8.
22. Xiao X, Gasparrini A, Huang J, Liao Q, Liu F, Yin F, et al. The exposure-
Received: 4 October 2020 Accepted: 21 December 2020 response relationship between temperature and childhood hand, foot and
mouth disease: A multicity study from mainland China. Environ Int. 2017;
100:102–9.
23. Bo Z, Ma Y, Chang Z, Zhang T, Liu F, Zhao X, et al. The spatial heterogeneity
References
of the associations between relative humidity and pediatric hand, foot and
1. Xing WJ, Liao QH, Viboud C, Zhang J, Sun JL, Wu JT, et al. Hand, foot, and
mouth disease: Evidence from a nation-wide multicity study from mainland
mouth disease in China, 2008-12: an epidemiological study. Lancet Infect
China. Sci Total Environ. 2020;707:136103.
Dis. 2014;14:308–18.
2. Huang J, Liao Q, Ooi MH, Cowling BJ, Chang Z, Wu P, et al. Epidemiology of 24. Mao QY, Wang Y, Bian L, Xu M, Liang Z. EV71 vaccine, a new tool to control
recurrent hand, foot and mouth disease, China, 2008-2015. Emerg Infect Dis. outbreaks of hand, foot and mouth disease (HFMD). Expert Rev Vaccines.
2018;24:432–42. 2016;15:599–606.
3. Pan J, Chen M, Zhang X, Chen Y, Liu H, Shen W. High risk factors for severe 25. National Bureau of Statistics of China. National census in China, 2010. http://
hand, foot and mouth disease: a multicenter retrospective survey in Anhui www.stats.gov.cn/tjsj/ndsj/2011/indexch.htm (Accessed on 23 Sep 2012).).
Province China, 2008-2009. Indian J Dermatol. 2012;57:316–21. 26. Akinwande MO, Dikko HG, Samson A. Variance inflation factor: as a
4. Cox B, Levent F. Hand, Foot, and Mouth Disease. Jama. 2018;320:2492. condition for the inclusion of suppressor variable(s) in regression analysis.
5. Liu G, Xu Y, Wang X, Zhuang X, Liang H, Xi Y, et al. Developing a machine Open Journal of Statistics. 2015;05(07):14.
learning system for identification of severe hand, foot, and mouth disease 27. Ivosev G, Burton L, Bonner R. Dimensionality reduction and visualization in
from electronic medical record data. Scientific Reports. 2017;7. principal component analysis. Anal Chem. 2008;80:4933–44.
6. Huang MC, Wang SM, Hsu YW, Lin HC, Chi CY, Liu CC. Long-term cognitive 28. Liu XF, Sun XM, Sun XW, Yang YQ, Huang CH, Wen H. Epidemiological
and motor deficits after enterovirus 71 brainstem encephalitis in children. study on hand, foot and mouth disease in Tongzhou District, Beijing, 2013-
Pediatrics. 2006;118:e1785–8. 2017. J Int Med Res. 2019;47:2615–25.
7. Chang LY, Huang LM, Gau SS, Wu YY, Hsia SH, Fan TY, et al. 29. Wang YR, Sun LL, Xiao WL, Chen LY, Wang XF, Pan DM. Epidemiology and
Neurodevelopment and cognition in children after enterovirus 71 infection. clinical characteristics of hand foot, and mouth disease in a Shenzhen
N Engl J Med. 2007;356:1226–34. sentinel hospital from 2009 to 2011. BMC Infect Dis. 2013;13:5.
8. Zheng YM, Yang J, Liao QH. Direct medical costs and influencing factors in 30. Samphutthanon R, Tripathi NK, Ninsawat S, Duboz R. Spatio-temporal
severe hand, foot and mouth disease in children aged between six months distribution and hotspots of hand, foot and mouth disease (HFMD) in
and five years old. Zhonghua Yu Fang Yi Xue Za Zhi. 2017;51:87–92. Northern Thailand. Int J Environ Res Public Health. 2014;11:312–36.
9. Zheng YM, Yang J, Liao QH. Health related quality of life on severe hand, 31. Chan KP, Goh KT, Chong CY, Teo ES, Lau G, Ling AE. Epidemic hand, foot
foot and mouth disease patients. Zhonghua Liu Xing Bing Xue Za Zhi. 2017; and mouth disease caused by human enterovirus 71, Singapore. Emerg
38:462–6. Infect Dis. 2003;9:78–85.
10. Chen SC, Chang HL, Yan TR, Cheng YT, Chen KT. An eight-year study of 32. Wang J, Cao Z, Zeng DD, Wang Q, Wang X, Qian H. Epidemiological
epidemiologic features of enterovirus 71 infection in Taiwan. Am J Trop analysis, detection, and comparison of space-time patterns of Beijing hand-
Med Hyg. 2007;77:188–91. foot-mouth disease (2008-2012). PLoS One. 2014;e92745:9.
11. Nhan LNT, Hong NTT, Nhu LNT, Nguyet LA, Ny NTH, Thanh TT, et al. Severe 33. Puenpa J, Mauleekoonphairoj J, Linsuwanon P, Suwannakarn K,
enterovirus A71 associated hand, foot and mouth disease, Vietnam, 2018: Chieochansin T, Korkong S, et al. Prevalence and characterization of
preliminary report of an impending outbreak. Euro Surveill. 2018;23. enterovirus infections among pediatric patients with hand foot mouth
12. Qiu J, Yan H, Cheng N, Lu X, Hu X, Liang L, et al. The clinical and disease, herpangina and influenza like illness in Thailand, 2012. PLoS One.
epidemiological study of children with hand, foot, and mouth disease in 2014;9:e98888.
Hunan, China from 2013 to 2017. Sci Rep. 2019;9:11662. 34. Wang Y, Feng Z, Yang Y, Self S, Gao Y, Longini IM, et al. Hand, foot, and
13. Yang X, Li Y, Zhang C, Zhan W, Xie J, Hu S, et al. Clinical features and mouth disease in China: patterns of spread and transmissibility.
phylogenetic analysis of severe hand-foot-and-mouth disease caused by Epidemiology. 2011;22:781–92.
Coxsackievirus A6. Infect Genet Evol. 2020;77:104054. 35. Qin L, Dang D, Wang X, Zhang R, Feng H, Ren J, et al. Identification of
14. Crabol Y, Pean P, Mey C, Duong V, Richner B, Laurent D, et al. A prospective, immune and metabolic predictors of severe hand-foot-mouth disease. Plos
comparative study of severe neurological and uncomplicated hand, foot One. 2019;14.
and mouth forms of paediatric enterovirus 71 infections. Int J Infect Dis. 36. Zhang D, Li R, Zhang W, Li G, Ma Z, Chen X, et al. A case-control study on
2017;59:69–76. risk factors for severe hand, foot and mouth disease. Scientific Reports.
15. Li Y, Xiong T, Meng Y, Zhao R, Yu G, Liu J, et al. Risk factors for severe hand, 2017;7.
foot, and mouth disease infected with Coxsackievirus A6: A hospital-based 37. Liu S-L, Pan H, Liu P, Amer S, Chan T-C, Zhan J, et al. Comparative
case-control study. J Med Virol. 2020. https://doi.org/10.1002/jmv.26343. epidemiology and virology of fatal and nonfatal cases of hand, foot andPan et al. Environmental Health and Preventive Medicine (2021) 26:4 Page 9 of 9
mouth disease in mainland China from 2008 to 2014. Reviews in Medical
Virology. 2015;25:115–28.
38. Cheng Q, Bai L, Zhang Y, Zhang H, Wang S, Xie M, et al. Ambient
temperature, humidity and hand, foot, and mouth disease: a systematic
review and meta-analysis. Science of the Total Environment. 2018;625:828–
36.
39. Coates SJ, Davis MDP, Andersen LK. Temperature and humidity affect the
incidence of hand, foot, and mouth disease: a systematic review of the
literature - a report from the International Society of Dermatology Climate
Change Committee. Int J Dermatol. 2019;58:388–99.
40. Phung D, Nguyen HX, Nguyen HLT, Do CM, Tran QD, Chu C. Spatiotemporal
variation of hand-foot-mouth disease in relation to socioecological factors: a
multiple-province analysis in Vietnam. Sci Total Environ. 2018;610-611:983–
91.
41. Bertrand I, Schijven JF, Sánchez G, Wyn-Jones P, Ottoson J, Morin T, et al.
The impact of temperature on the inactivation of enteric viruses in food
and water: a review. J Appl Microbiol. 2012;112:1059–74.
42. Chen S, Yang Y, Yan X, Chen J, Yu H, Wang W. Influence of vitamin A status
on the antiviral immunity of children with hand, foot and mouth disease.
Clin Nutr. 2012;31:543–8.
Publisher’s Note
Springer Nature remains neutral with regard to jurisdictional claims in
published maps and institutional affiliations.You can also read