Is Demography Still Destiny?
←
→
Page content transcription
If your browser does not render page correctly, please read the page content below
BRONX

 M A N H AT TA N
                                 Is Demography

                        QUEENS
                                 Still Destiny?
                                 Neighborhood Demographics and

    B R O O K LY N               Public High School Students’ Readiness

                                 for College in New York City

                                                      BRONX

A RESEARCH AND POLICY BRIEF            M A N H AT TA N

                                                                QUEENS

                                          B R O O K LY N
IS DEMOGRAPHY ST ILL DEST INY?
ABOUT THE ANNENBERG INSTITUTE FOR SCHOOL REFORM
The Annenberg Institute for School Reform (AISR) is a national policy-research and reform-support organiza-
tion, affiliated with Brown University, that focuses on improving conditions and outcomes for all students in
urban public schools, especially those attended by traditionally underserved children. AISR’s vision is the
transformation of traditional school systems into “smart education systems” that develop and integrate high-
quality learning opportunities in all areas of students’ lives – at school, at home, and in the community.
AISR conducts research; works with a variety of partners committed to educational improvement to build
capacity in school districts and communities; and shares its work through print and Web publications. Rather
than providing a specific reform design or model to be implemented, AISR’s approach is to offer an array of
tools and strategies to help districts and communities strengthen their local capacity to provide and sustain
high-quality education for all students.
Written by
Norm Fruchter
Megan Hester
Christina Mokhtar
Zach Shahn
b
Editing
Margaret Balch-Gonzalez
Graphic Design
Haewon Kim
The authors would like to acknowledge Leonard Rodberg for access to the Infoshare Community Information
System – a computerized database that allows community groups, nonprofit organizations, and others to
access demographic, health, and economic information about New York City at different geographic levels –
and for assistance in identifying the overlap between New York City zip codes and neighborhoods.
Suggested Citation: Fruchter, N. M, M. Hester, C. Mokhtar, and Z. Shahn. 2012. Is Demography Still Destiny?
Neighborhood Demographics and Public High School Students’ Readiness for College in New York City.
Providence, RI: Annenberg Institute for School Reform, Brown University.
This publication is available online at: http://annenberginstitute.org/product/IsDemographyStillDestiny
© 2012 Brown University, Annenberg Institute for School Reform
■ Box 1985
Providence, Rhode Island 02912
■ 233 Broadway, Suite 720
New York, New York 10279
www.annenberginstitute.org
Twitter: @AnnenbergInst
Facebook: www.facebook.com/AnnenbergInstituteForSchoolReformIs Demography Still Destiny?
Neighborhood Demographics and
Public High School Students’ Readiness
for College in New York City
Summary college, while nearly 80 percent of Other policies that would begin to
students from Tribeca do. address these gaps are:
D uring the past decade, the
Bloomberg administration has
explicitly prioritized narrowing the
• In the city’s neighborhoods with
100 percent Black and Latino res-
idents, no more than 10 percent
• Create a more equitable distribu-
tion of in-school guidance and
counseling resources to help fami-
racial achievement gap. Former of high school students graduate lies successfully navigate the
Chancellor Joel Klein has often ready for college. school choice maze.
argued, “neither resources nor • In the Manhattan neighborhoods • Significantly increase the number
demography is destiny in the class- with the highest college-readiness of educational-option seats to
room,” and the New York City rates, fewer than 10 percent of the ensure that students of all aca-
Department of Education has residents are Black or Latino. demic levels and all neighbor-
invested heavily in school choice to • Eighteen of the twenty-one hoods have a fair shot at seats in
neighborhoods with the lowest the high schools that are most
achieve this goal, remaking the high
college-readiness rates are in the likely to prepare them for college.
school choice system to increase the
Bronx (the other two are in • Invest heavily in school improve-
scope and equity of student assign-
Brooklyn). ment strategies, rather than just
ment to high school. Yet a new
• Thirteen of the fifteen neighbor- school creation and choice, to
study by the Annenberg Institute for hoods with the highest college- increase the capacity of existing
School Reform at Brown University readiness rates are in Manhattan schools to prepare students for
indicates that the college readiness (the other two are in Queens). college.
of New York City high school gradu-
In spite of the city’s efforts to Without such comprehensive efforts,
ates is still very highly correlated
increase equity by expanding high the vast disparity in opportunity that
with the neighborhood they come
school choice and creating five hun- separates the city’s neighborhoods
from. In particular, the racial compo-
dred new small schools and one will persist.
sition and average income of a stu-
hundred charter schools, college
dent’s home neighborhood are very
readiness rates are still largely pre-
strong predictors of a student’s
dicted by the demographics of a stu-
chance of graduating high school
dent’s home neighborhood. This
ready for college. The gaps between
suggests that the strategies of school
neighborhoods are enormous:
choice and school creation are not
• Only 8 percent of students from
Mott Haven graduate ready for sufficient to create the equity that
the administration has envisioned.
Annenberg Institute for School Reform at Brown University 1Introduction the nation’s most comprehensive sys- each of the three groups, while the
IS DEMOGRAPHY STIL L DESTINY?
tem of high school choice on equity other half were randomly assigned
O ver the past decade, Mayor
Michael Bloomberg has reor-
ganized the New York City school
of opportunity for the system’s high
school students. Our findings sug-
gest that while high school choice
by computer. Edward R. Murrow,
Murray Bergtraum, and Norman
Thomas High Schools were subse-
system using principles and strategies may have improved educational quently opened as educational option
extrapolated from his corporate sec- options for individual students, schools in the 1970s and employed
tor experience. The mayor and his choice has not been sufficient to the same selection criteria.
administration have restructured the increase systemic equity of opportu-
These large ed-op schools expanded
public school system into a portfolio nity. Our results indicate that univer-
the equity dimensions of choice by
district centered on choice, auton- sal high school choice has not
attracting a diverse mix of students
omy, and accountability. These disrupted the relationship of demog-
ranging from academically strug-
strategies have been promoted as the raphy to educational destiny across
gling to high achieving. In the fol-
most effective and efficient way to the city’s struggling neighborhoods.
lowing decades, more ed-op high
reduce the school system’s substantial
schools were created and other high
racial achievement gap and improve Evolution of High School schools added discrete ed-op pro-
the quality of education for all the
city’s students. As a consequence,
Choice grams, significantly expanding the
New York City’s restructuring effort
has been replicated in districts across
the country, and the New York City
T he New York City school sys-
tem has developed the nation’s
most comprehensive system of high
Choice has not been sufficient
to increase systemic equity of
2
school system is often defined as the school choice. In the century since
nation’s foremost exemplar of a port- Stuyvesant High School was opened opportunity.
folio district. as a citywide choice school, students’
After a decade of implementation, selection of high schools (and high
range and equity of high school
a variety of student, school, and schools’ selection of students) has
choice offerings. These ed-op
system-level outcomes offer a win- become an almost universal process.1
schools and programs represent an
dow into the successes and shortcom- High school choice in New York early form of controlled school
ings of New York City’s portfolio City has expanded and grown more choice by offering placements within
district reforms. This research brief complex as efforts to extend the designated schools to a mix of stu-
examines one aspect of the impact of scope and quality of student choice dents with varying academic abilities.
have alternated with efforts to create
In the mid-1980s, the creation of
an equitable mix of students within
1
Central Park East Secondary School
Stuyvesant High School began restricting schools. In the late 1960s, John
admission based on academics in 1919. In
as a high school of choice helped
Dewey High School opened as the
1972, the New York State legislature linked it initiate a wave of small high school
first educational option (or “ed-op”)
with the Bronx High School of Science and development, pioneered by New
high school. Dewey offered place-
Brooklyn Technical High School and man- Visions for Public Schools and the
dated admission to those three schools to ments to students categorized into
Center for Collaborative Education
students with the highest scores on a special three admissions groups – high, low,
and supported by the Aaron Dia-
citywide test. Five additional high schools and average achievers – according to
were subsequently added to this elite cate-
mond Foundation. Through these
their citywide reading test scores.
gory of specialized schools by the New York initiatives, in the early 1990s some
Dewey selected half the students in
City Department of Education during the thirty-five new small high schools of
Bloomberg administration. choice were developed. An equiva-
lent number of new small highschools were developed as part of testing experts Howard Everson and
the New York Networks for School
“Neither resources nor demogra- Daniel Koretz (2010) showing that
Renewal, the Annenberg Founda- phy is destiny in the classroom” students who reach these bench-
tion’s New York City Challenge marks are significantly more likely
––Joel Klein
grantee, in the mid-1990s. These to earn at least a C in a college-level
efforts considerably expanded the course in that subject.
universe of high school choice. improve the high school selection
■ Methods
Starting in 2002, the Bloomberg process was to ensure that demogra-
phy was not destiny for the city’s In 2011, the New York City Depart-
administration, supported by grants
high school students. As the econo- ment of Education (NYCDOE)
from the Bill & Melinda Gates
mists who developed the high school released data on college readiness
Foundation, Carnegie Corporation,
choice matching process observed in indicators for each New York City
and the Open Society Institute,
a journal article about the new high school, as an additional measure
greatly intensified the pace of small
process, of school performance on the NYC-
high school creation. The adminis-
DOE’s Annual Progress Reports. But
tration also recalibrated the high One impetus for increasing
school choice process. Under school choice was to make sure
former Schools Chancellor Joel students who lived in disadvan-
2
Klein, the process was refined to taged neighborhoods were not New York State’s definition of college readi-
increase the number of individual automatically assigned to disad- ness, based strictly on Regents scores, is
called the Aspirational Performance Meas-
schools each student could select, vantaged schools. (Abdulka-
ure. For the purposes of this analysis, we
and the selection process was diroglu, Pathak & Roth 2005, p. have used the NYCDOE’s more expansive
improved by using a computer- 364) College Readiness Index, which is defined as
driven algorithm similar to the the percentage of students who graduate
formula that matches teaching hospi- High School Choice and with a Regents diploma, earn a 75 or higher
tals and medical student interns to on the English Regents or score 480 or higher
Demography/Destiny on the Critical Reading SAT, and earn an 80
pair students’ choices with schools’
or higher on one Math Regents and complete
selections.
As a result, the percentage of stu-
B ut has the high school choice
system succeeded in breaking
the link between demography and
coursework in Algebra II/Trigonometry or a
higher-level math subject, or score 480 or
higher on the Math SAT. A student can
dents placed in one of their top
destiny? The analysis in this brief demonstrate completion of math coursework
choices of high school has increased by: (a) Passing a course in Algebra II/
begins to address that question.
every year since 2009. In 2011, for Trigonometry or higher and taking one of
example, 83 percent of high school In 2010 the New York State Educa- the following exams: the Math B Regents,
applicants were matched with one tion Department developed a set of Algebra II/ Trigonometry Regents, AP Calcu-
of their five top choices. Mayor indicators to assess student capacity lus, AP Statistics, or IB Math; or (b) Passing
to succeed in college, based on stu- the Math B or Algebra II/Trigonometry
Bloomberg and former Chancellor
Regents. We used this metric because it was
Klein frequently linked their school dent performance on Regents exams
the latest data available at the time of our
reform efforts to the goals of the civil and CUNY assessment tests. If stu- analysis.
rights movement; for example, in dents pass the Math Regents exam
2009 Klein proclaimed that “neither with a score of at least 80 and the
resources nor demography is destiny English Regents exam with a score of
in the classroom.” One of the goals at least 75, they are now defined by
of the administration’s efforts to New York State as college ready.2
This metric is based on research by
Annenberg Institute for School Reform at Brown University 3because the choice system often sev- scores of all the city’s public high
No single neighborhood factor
IS DEMOGRAPHY STIL L DESTINY?
ers the connection between students’ school students, broken down by the
home neighborhoods and the high students’ residential zip code. AISR was as strongly associated
schools they attend (since students amalgamated the student data for
choose schools throughout the city), individual zip codes into a citywide with college readiness as racial/
the data did not connect the demo- neighborhood index3 and then car- ethnic composition.
graphics of students’ neighborhood ried out a series of analyses to assess
residence with their college readiness the relationship between students’
scores to assess the extent to which residential neighborhood demo- ■ Findings
neighborhood demographics are graphic factors 4 and students’ college
associated with students’ college readiness scores, aggregated up to AISR’s analysis found that several
readiness rates. the neighborhood level. neighborhood socio-economic fac-
tors, such as single motherhood,
In 2011, researchers at the Annen- AISR used an online data tool, devel- extent of mother’s education, unem-
berg Institute for School Reform oped by the Infoshare Community ployment rate, and citizenship status,
(AISR) at Brown University Information Service, to merge U.S. were significantly correlated with
requested and received data from Census data, primarily neighborhood students’ college readiness rates.
the NYCDOE on the high school indicators by New York City zip For example, the higher the average
graduation and college readiness code, with the college readiness mother’s level of education in any
scores by students’ residential zip New York City neighborhood, the
code provided by the NYCDOE. To higher the college readiness scores
aggregate from the zip code to the
4
3
We use Infoshare’s definition of a New of the students residing in that
York City neighborhood: “one of 292 neighborhood level, we used data neighborhood. Conversely, the
neighborhoods in which New Yorkers gener- provided by Infoshare that specifies higher a neighborhood’s percentage
ally think of themselves as residing” the overlap of neighborhoods and of single mothers, the lower the col-
(www.infoshare.org). zip codes. Whenever neighborhood lege readiness scores of students liv-
boundaries did not coincide with ing in that neighborhood. The mean
4
These residential neighborhood demo-
those of zip codes, we used 2009 income level in each neighborhood
graphic factors were culled from the U.S.
Census tract populations, broken was particularly strongly correlated
Census 2005–2009 American Community Sur-
vey averages for New York City. The five-year down by the Census tracts in each with students’ college readiness
averages are the most reliable, have the zip code and neighborhood, to calcu- scores – the lower a neighborhood’s
largest sample size, and are best used when late the proportion of the neighbor- mean income, the lower the college
examining Census tracts and small areas hood’s population that comes from readiness scores of the students living
such as neighborhoods.
each zip code. We assigned each in that neighborhood.
neighborhood a college readiness
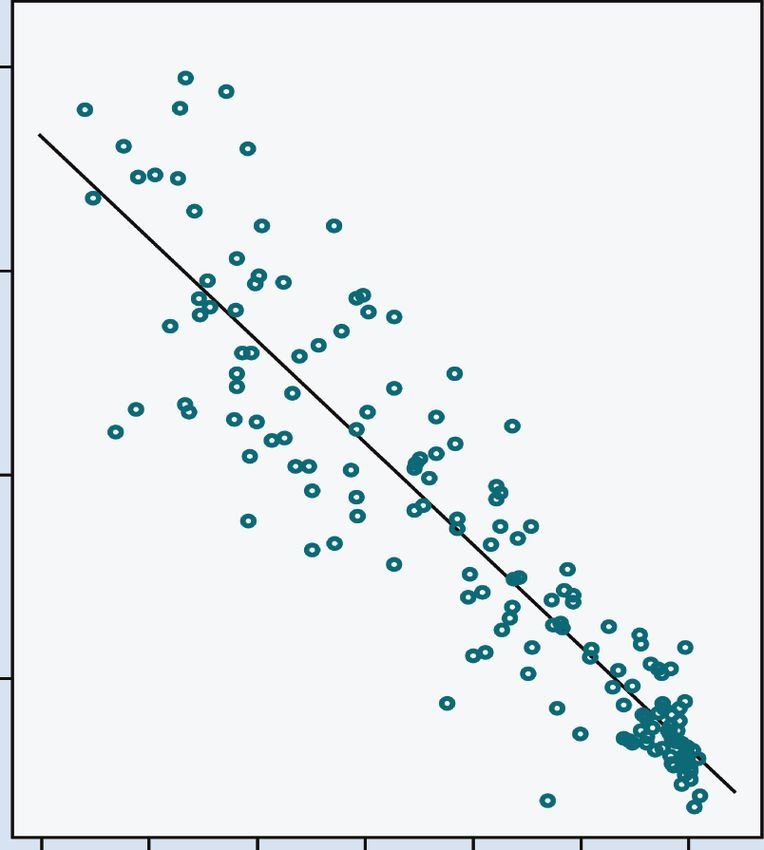
score that represents the weighted No single neighborhood factor was
average of the college readiness as strongly associated with college
scores of those zip codes that overlap readiness as racial/ethnic composi-
with the neighborhood. We used tion. The strongest negative rela-
the same procedures for any demo- tionship to students’ college
graphic variable we converted to the readiness scores was the percentage
neighborhood level. of Black and Latino residents in the
city’s neighborhoods – the higher the
percentage of Black and Latino resi-
dents in specific neighborhoods, thelower the college readiness scores of
the high school graduates (in 2011)
in those neighborhoods. Figure 1,
with all the city’s neighborhoods
represented by circles, illustrates
this very strong negative log-linear
relationship.
The relationship between the two
variables – students’ college readi-
ness scores and the racial composi- FIGURE 1
tion of neighborhoods across New Proportion of Black and Latino neighborhood residents vs. college readiness
York City – is remarkably tight.
When we examined the relationship 80
of other demographic factors (e.g.,
income, single motherhood, citizen-
ship status) to college readiness rates,
we could identify several outliers – 60
Percent college ready
neighborhoods that broke the pat-
tern. But the very strong relationship
between race and college readiness
40
yielded only one neighborhood
(Woodlawn – see Figure 2 on next
page) as a possible outlier, and this is
explained by unusual population pat- 20
terns in the neighborhood.
Figure 2 shows that no more than 10
percent of the high school students -3.0 -2.5 -2.0 -1.5 -1.0 -0.5 0.0
in the Bronx neighborhoods of Mor- log(Proportion Black or Latino)
risania, Woodstock, Longwood,
Claremont, and Mott Haven gradu-
ated high school college ready in
2011. These neighborhoods with low
college readiness rates have the high-
est percentages of Black and Latino
residents in New York City. In fact,
eighteen of the twenty-one neigh-
borhoods with the lowest college
readiness rates are in the Bronx, the
borough with the highest percentage
of Black and Latino residents.
Annenberg Institute for School Reform at Brown University 5Conversely, as Figure 3 shows, 74
IS DEMOGRAPHY STIL L DESTINY?
percent or more of the high school
students in more advantaged Man-
hattan neighborhoods such as
Tribeca, Little Italy, Soho, and
FIGURE 2
Lenox Hill graduated college ready
New York City high schools with lowest college readiness rates
in 2011. All four of these Manhattan
Note high percentages of Black and Latino neighborhood residents
neighborhoods with very high col-
College Black/Latino* lege-ready rates have 10 percent or
Neighborhood Borough Readiness (%) (%) less Black and Latino residents. An
East New York Brooklyn 12 96 analysis of graduate rates showed a
Ocean Hill Brooklyn 12 99 similar negative log-linear associa-
North Baychester Bronx 12 93
tion with the proportion of Blacks
and Latinos in the neighborhood
Edenwald Bronx 12 93
populations. But there was more
Melrose Bronx 12 100
variation in graduation rates than
Hunt's Point Bronx 12 100 college readiness rates among neigh-
East Tremont Bronx 12 98 borhoods with the most Black and
Mount Hope Bronx 11 98
Latino residents, indicating that
there is more equity in opportunity
Bathgate Bronx 11 95
for high school outcomes than for
6
Brownsville Brooklyn 11 100 college readiness.
Crotona Park Bronx 11 99
Given that only 13 percent of the
Port Morris Bronx 11 96
city’s Black and Latino students
East Concourse Bronx 11 100 currently graduate high school pre-
Wakefield Bronx 11 83 pared for college, compared with
Mount Eden Bronx 11 99
50 percent of White students and
50 percent of Asian students,5 these
Morrisania Bronx 10 100
findings are not surprising. Yet it is
Woodstock Bronx 10 100 quite sobering that despite efforts to
Longwood Bronx 10 100 improve the high school choice sys-
Claremont Bronx 10 100 tem to increase educational opportu-
Mott Haven Bronx 8 100
nities for the city’s students, the
relationship between demography
Woodlawn Bronx 8 52**
and college readiness is so strong
* Black/Latino refers to the proportion Black plus the proportion Latino, which can
across the city’s neighborhoods.
sometimes be more than 100 percent because some people identify as both. Where Because the college-ready indicator
percentages added up to more than 100, we rounded to 100. is so new, it has not been possible to
** Woodlawn, which has a large White population, shares a zip code with Eastchester, construct comparisons to determine
a neighborhood that is predominately Black. There are disproportionately more
Black high school students in this zip code, so its low college readiness rate reflects
whether the relationship between
the characteristics of Eastchester. neighborhood demographics and
college readiness has changed across
time. Thus our analysis is very time-
limited – a snapshot based on one
year of data. However, because therelationship between race and out-
comes demonstrated in Figure 1
could hardly be more tight, it is not
likely to have lessened significantly
in recent years.
FIGURE 3
In a broadside that former Chancel- New York City high schools with highest college readiness rates
lor Klein and Michelle Rhee pub- Note low percentages of Black and Latino neighborhood residents
lished in 2010, they declared, “The
College Black/Latino
single most important factor deter- Neighborhood Borough Readiness (%) (%)
mining whether students succeed in
Tribeca Manhattan 79 9
school is not the color of their skin
Little Italy Manhattan 77 10
or their ZIP code or even their par-
ents’ income – it is the quality of Soho Manhattan 74 9
their teacher.” Yet our findings indi- Lenox Hill Manhattan 74 6
cate that ZIP code, income, and, Douglaston & Little Neck Queens 74 13
above all, the racial composition
City Hall Manhattan 71 12
of students’ neighborhoods is very
Upper East Side Manhattan 70 8
strongly correlated with student
success. Chinatown Manhattan 68 16
Yorkville Manhattan 66 9
In spite of the NYCDOE’s efforts to
enhance both the extent of selectivity World Trade Center Manhattan 66 9
and the equity of high school choice, Battery Park Manhattan 66 9
demography is still – and quite Oakland Gardens Queens 65 15
relentlessly – destiny in terms of the
Bellevue Area Manhattan 65 13
relationship between neighborhood
Turtle Bay Manhattan 65 8
race/ethnicity and college readiness
across the city’s public school system. West Village Manhattan 65 11
Universal high school choice seems
not to have provided equity of out-
comes for the city’s high school
students.
5
According to the NYCDOE School-Level
Regents-Based Math/ELA Aspirational Per-
formance Measure (2010), which is the only
college readiness metric provided that is bro-
ken down by race. See http://schools.nyc.
gov/NR/rdonlyres/193BBD8A-5DE1-4EEE-
B49B-C8C45357441B/0/Graduation_Rates
_Public_School_Apm.xls.
Annenberg Institute for School Reform at Brown University 7Exploring the Causes Corcoran and Levin discovered that found that even given the students’
IS DEMOGRAPHY STIL L DESTINY?
the average number of high school tendency to choose schools that
of the Choice/
choices students made varied signifi- matched their own backgrounds:
Demography Link cantly by the middle school they Students’ first-choice schools are
W hat might help to explain
these disturbing results?
Sean Corcoran and Henry Levin’s
attended. After controlling “for stu-
dent characteristics (e.g., achieve-
ment, race, poverty) and residential
on average more advantaged and
less racially isolated than stu-
dents’ middle schools . . . [but]
(2011) comprehensive analysis of the area,” the authors observed “sizable students’ final school assignment
city’s high school choice system pro- middle school effects on choices” is more similar to the students’
vides some suggestions. Corcoran (p. 212). Efforts by the New York feeder school. (p. 218)
and Levin found that under the City Coalition for Educational Jus-
Thus, student preferences for
Bloomberg administration, educa- tice (2007, 2008) have demonstrated
schools that match their back-
tional option program offerings, that patterns of inequity in middle
grounds, combined with the opera-
which control school choice to school curricula, as well as disparities
tion of the matching process
increase equity of student opportu- in resources such as teacher quality
formula, tend to assign students to
nity, have significantly diminished. and student support, are associated
schools more similar to their middle
Unscreened programs, in which stu- with low student achievement in the
schools than the schools they
dents are randomly selected by com- city’s middle schools. Given Corco-
selected as their first choice.
puter, with priority given to those ran and Levin’s finding of “sizable
who attend a school open house or middle school effects,” research Corcoran and Levin acknowledge
information session, have signifi- efforts should assess whether pre- in their study that the Bloomberg
8
cantly increased. Researchers need to dictable disparities in guidance- administration has improved the
examine the equity implications of counselor-to-student ratios in middle choice system’s transparency and
these policy changes. schools are shaping these effects on equity. If there is a cost, they suggest,
high school choice.6 it lies in the system’s increased com-
plexity and the administration’s neu-
Corcoran and Levin (2011) also
“Students’ first-choice schools are found:
trality: “The DOE has shifted the
burden of a complex choice decision
on average more advantaged and Students tended to prefer high
onto students, their parents, and
schools that matched their own
less racially isolated than students’ schools.” They conclude:
academic, racial, and socioeco-
Whether or not this shift
middle schools . . . [but] students’ nomic background. . . . These
improves academic outcomes . . .
patterns suggest that universal
final school assignment is more choice will be limited in its ability
will depend on how students and
their families make school
similar to the students’ feeder to prevent stratification of stu-
choices. If demand is relatively
dents across schools by race,
school.” insensitive to academic quality
socio-economic status, and aca-
and more responsive to location
––Sean Corcoran and Harry Levin, demic ability. (pp. 214–215)
and/or social influences, even a
“School Choice and Competition in
But Corcoran and Levin also fair system of choice will fail to
the New York City Schools”
observed a pattern of disparity provide an impetus for academic
between students’ first choice of high improvement. Moreover, to the
school, students’ middle schools, and
the high schools students were ulti-
mately assigned to. Essentially, theyextent students vary in the values accumulated years of knowledge 2002 levels, but significantly
they place on school characteris- about how to identify the most increased. The goal should be to
tics, decentralized school choice appropriate high schools, combined ensure that students from all neigh-
has the potential to increase with the accumulated experience borhoods have a fair shot at seats in
stratification by race, academic of how to effectively negotiate the the high schools that are most likely
ability, and socio-economic sta- choice process, can provide signifi- to prepare them for college.9
tus. (p. 224) cant advantages to students’ choice.
Providing effective guidance and
That last observation may offer an Evening out these imbalances will counseling support for students
initial explanation of the very strong not only require a more equitable negotiating the high school choice
relationship we found between col- distribution of in-school guidance process – and increasing the number
lege readiness and racial composition and counseling resources. It will
across the city’s neighborhoods. also require mobilizing neighbor-
6
The New York City Coalition for Educational
Reducing the Choice/ Justice has also promoted a series of
In-school advantages are often improvement measures, including expanded
Demography Link learning time and social/emotional supports
buttressed by the social capital such as improved guidance services, partic-
W hat policies might reduce the
strong correlation between
neighborhood characteristics and
that more-advantaged families
ularly focused on the high school choice
process, which might improve the appropri-
ateness and effectiveness of student selec-
and neighborhoods can wield.
college readiness? Because our tion of high schools.
research represents only an initial
7
step in exploring the relationships hood-based guidance and support Forms of community-based guidance and
among these variables, our recom- efforts provided by community serv- counseling have been developed during the
mendations are necessarily prelimi- past decades to help students and their fam-
ice
ilies negotiate the college admissions
nary and limited. But one obvious and advocacy organizations 7 – and process. But to our knowledge, very few of
way to begin is to investigate the perhaps by middle and high school these local forms of support have been mobi-
middle school effects on choice that students through forms of peer lized to help negotiate the high school choice
Corcoran and Levin observed. It may counseling 8 – to help students and process.
well be, for example, that the rela- families in low-income Black and
8
tively small numbers of the system’s Latino neighborhood successfully One example of such programs is the effort
middle schools that serve more- navigate the choice process. to adapt the Urban Youth Collaborative’s Stu-
advantaged students have lower stu- dent Success Center model to the middle
Corcoran and Levin’s finding that school level, now being explored at I.S. 302 in
dent/guidance counselor ratios and
the number of placements available Cypress Hills.
more experienced and effective
in education option schools and pro-
counselors. If there are such in- 9
grams has been significantly reduced These recommendations are similar to those
school counseling advantages, they made by Hemphill and Nauer (2009).
suggests another appropriate policy
may well produce more appropriate
intervention. To increase the possi-
choice of and placement in high
bility that Black and Latino students
schools.
with low levels of achievement have
Moreover, such in-school advantages appropriate placements available to
are often buttressed by the social them through the choice process,
capital that more-advantaged families educational options seats should
and neighborhoods can wield. Fami- not only be restored to their pre-
lies and neighborhoods that have
Annenberg Institute for School Reform at Brown University 9of ed-op placements – would school choice (and school creation) References
IS DEMOGRAPHY STILL DESTINY?
undoubtedly improve the quality as policies to achieve these goals.
and equity of student choices (and However, our analysis suggests that Abdulkadiroglu, A., P. A. Pathak and
ultimately, their college readiness the restructured system of choice A. E. Roth. 2005. “The New York
scores). But such support will not be they created is far from sufficient to High School Match,” American
sufficient to provide the new high meet the citywide equity challenge. Economic Review 95, no. 2, p. 364.
school placements necessary to cor- Corcoran, S. P. and H. M. Levin.
After a decade of expanding high
rect the equity imbalances across the 2011. “School Choice and Compe-
school choice and creating five hun-
choice system. Corcoran and Levin’s tition in the New York City
dred new small schools and one hun-
finding that students choose more- Schools.” Invited chapter for the
dred new charter schools, college
advantaged and less-segregated American Institutes for Research.
readiness rates are still largely pre-
schools than those in which they are In Education Reform in New York
dicted by the demographics of a
student’s home neighborhood. If City: Ambitious Change in the
The finding that students choose demography is no longer to deter- Nation’s Most Complex School
mine destiny for the city’s students, System, edited by J. A. O’Day,
more-advantaged and less-seg- the administration must not only C. S. Bitter, and L. M. Gomez.
restructure the school choice system Cambridge, MA: Harvard Educa-
regated schools than those in
in the ways suggested above, but tion Press.
which they are ultimately placed must also invest heavily in school Everson, H. T. 2010. “Relationship
improvement strategies to of Regents ELA and Math Scores
suggests a much larger prob-
10
increase the capacity of all schools to College Readiness Indicators.”
lem: there are not enough good to effectively prepare students for Memo to David Steiner. New
college. Without such comprehen- York: City University of New York,
schools available within the sive efforts, the vast disparity in Center for Advanced Study in
matching process. opportunity that separates the city’s Education, usny.nysed.gov/
neighborhoods will persist. scoring_changes/
ultimately placed suggests a much MemotoDavidSteinerJuly1.pdf.
larger problem: there are not enough Hemphill, C., and K. Nauer, with
good schools available within the H. Zelon and T. Jacobs. 2009.
matching process. Indeed, the three The New Marketplace: How Small
economists who developed the School Reforms and School Choice
choice process’s matching algorithms Have Reshaped New York City’s High
concluded, in a paper written after Schools. New York: Milano, The
the new process was implemented, New School, Center for New York
that “New York City needs more City Affairs.
good schools” (Abdulkadiroglu,
Klein, J. 2009. “Urban Schools Need
Pathak & Roth 2005, p. 367).
Better Teachers, Not Excuses, to
Over the past decade, the Bloomberg Close the Education Gap,” U.S.
administration has explicitly priori- News & World Report (May 4),
tized narrowing the racial achieve- www.usnews.com/opinion/
ment gap and has invested heavily in articles/2009/05/04/urban-
schools-need-better-teachers-not-
excuses-to-close-the-education-
gap.New York City Coalition for Educa-
tional Justice. 2007. New York City’s
Middle-Grade Schools: Platforms
for Success or Pathways to Failure?
Providence, RI: Brown University,
Annenberg Institute for School
Reform, http://annenberginstitute.
org/publication/new-york-citys-
middle-grade-schools-platforms-
success-or-pathways-failure.
New York City Coalition for Educa-
tional Justice. 2008. Our Children
Can’t Wait: A Proposal to Close the
Middle-Grades Achievement Gap.
Providence, RI: Brown University,
Annenberg Institute for School
Reform, http://annenberginstitute.
org/publication/our-children-cant-
wait-proposal-close-middle-grades
-achievement-gap.
Annenberg Institute for School Reform at Brown University 11Annenberg Institute for School Reform at Brown University 12
You can also read