Teaching: Respect but dwindling appeal
←
→
Page content transcription
If your browser does not render page correctly, please read the page content below
The 50th annual PDKPoll of the Public’s Attitudes Toward the Public Schools
                   50 YEARS OF AMERICAN VOICES

A SUPPLEMENT TO KAPPAN MAGAZINE                  SEPTEMBER 2018

Teaching:
  Respect but dwindling appeal

                                                                      V100 N1   PDK Poll K1
The 50th annual

                                   PDKPoll
                                   of the Public’s Attitudes Toward the Public Schools
Phi Delta Kappan
Rafael Heller
EDITOR-IN-CHIEF
                                   Teaching: Respect but dwindling appeal
Teresa Preston                         K5      Teacher pay
MANAGING EDITOR/
CONTENT                            		 Are we paying teachers what they’re worth?
Carol Bucheri
MANAGING EDITOR/
                                       K7      The teaching profession
DESIGN & PRODUCTION                		 Would you want your child to become a teacher?
PDK Poll
Joan Richardson
                                       K9      School security
DIRECTOR, PDK POLL                 		 Is your child safe at school?
Michele Siuda Jacques
DIGITAL CONTENT EDITOR
                                     K12       School improvement
                                   		 Should we improve schools or start from scratch?
Langer Research                      K13       Spending and funding
Associates
                                   		 Should schools spend more on needier students?
Gary Langer
PRESIDENT
                                     K15       Opportunities and expectations
Sofi Sinozich                      		 Do all students have the same opportunities?
RESEARCH ANALYST

Christine Filer                     K17        Then and now
RESEARCH ANALYST
                                   		 Have schools improved over time?
Allison De Jong
RESEARCH ASSOCIATE                   K18       College affordability
                                   		 Should community college tuition be free?

Kappan                               K19       The value of a degree
      Phi Delta

                                   		 Is a college degree worth the cost?
USPS 429-840
ISSN 0031-7217                      K20        School hours
September 2018 V100 N1
                                   		 Should we change the school schedule?
Published by PDK International,
1820 N. Fort Myer Dr., Suite
320, Arlington, VA 22209, eight     K21        School grades
times per year, September to
May with a combined Decem-         		 How would you grade the schools?
ber/January issue. Subscription
prices available at kappanmag-
azine.org. Periodicals postage      K23        Methodology
paid at Arlington, Va., and
additional mailing offices.

postmaster:Send address
changes to Phi Delta               PDK INTERNATIONAL BOARD OF DIRECTORS/PDK FOUNDATION BOARD OF GOVERNORS
Kappan, P.O. Box 13090,
Arlington, VA 22219.               CURTIS CAIN, chair                 ERIC HOUGAN                           LISA STOOKSBERRY
PRINTED IN U.S.A.                  Wentzville, Mo.                    Seattle, Wash.                        Arlington, Va.
©2018 by Phi Delta Kappa           ANGELA WALMSLEY, vice chair        RICK KOLOWSKI                         MARK STRAUSS
International. All rights          Milwaukee, Wis.                    Omaha, Neb.                           Ft. Lauderdale, Fla.
reserved.
                                   DOUGLAS CHRISTENSEN, past chair    MELISSA NIXON
Publications Mail                  Lincoln, Neb.                      Greensboro, N.C.                      PDK INTERNATIONAL STAFF
Agreement PM# 41450540
                                   FREDERICK FRELOW                   KATHARINE OLIVER                      JOSHUA P. STARR
Return undeliverable               Upper Nyack, N.Y.                  Hagerstown, Md.                       Chief executive officer
Canadian addresses to
P.O. Box 2600,                     DAVID HEMPHILL                     SHARON ROBINSON
Mississauga, ON 4T 0A8.            Ft. Calhoun, Neb.                  Washington, D.C.

K2 PDK Poll       September 2018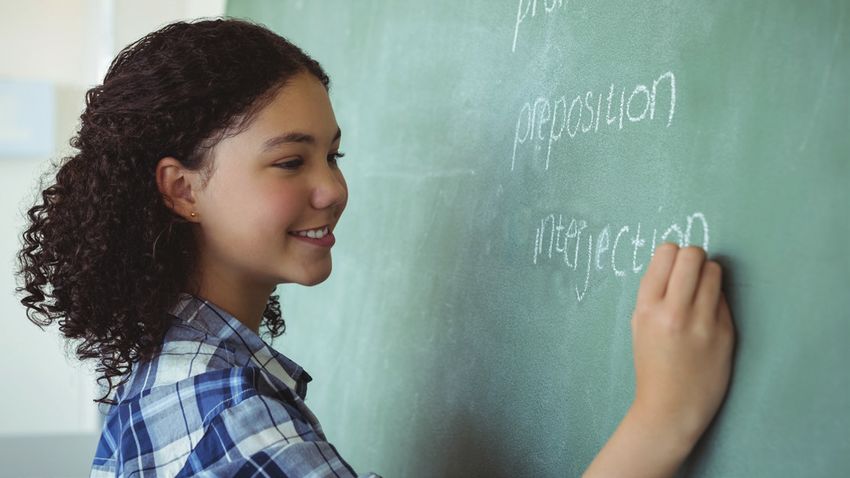
Teaching:
                Respect but dwindling appeal
                    Americans trust and support teachers, but they
                  draw the line at wanting their own children to join a
                   profession they see as undervalued and low-paid.

T        wo-thirds of Americans say teachers are under-
         paid, and an overwhelming 78% of public school
         parents say they would support teachers in their
         community if they went on strike for more pay,
according to the 2018 PDK Poll of the Public’s Attitudes
Toward the Public Schools.
  Even as most Americans continue to say they have high trust
                                                                     These findings are part of the 50th annual PDK Poll of the
                                                                  Public’s Attitudes Toward the Public Schools, which queried
                                                                  U.S. adults about a range of issues confronting education,
                                                                  including teacher pay and the teaching profession, school
                                                                  security, options for improving the public schools, percep-
                                                                  tions of opportunities for different groups of children, college
                                                                  affordability, the value of a college degree, and school sched-
and confidence in teachers, a majority also say they don’t want   ules. The survey is based on a random representative sample
their own children to become teachers, most often citing poor     of 1,042 adults with an oversample to 515 parents of school-age
pay and benefits as the primary reason for their reluctance.      children in May 2018. Langer Research Associates of New York

                                                                                                                V100 N1   PDK Poll K3
Photo: iStock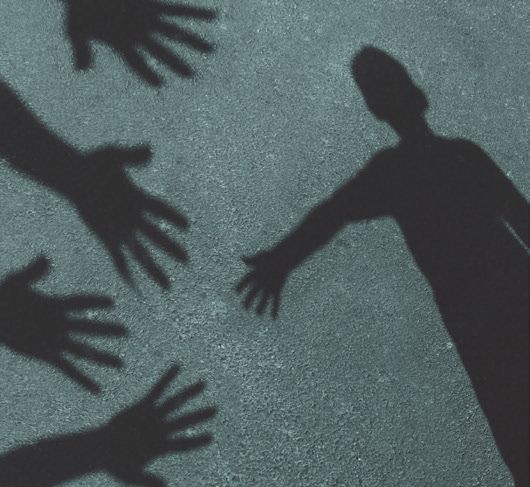
City produced the poll for PDK International using the GfK           accommodate the additional need; half say the schools should
KnowledgePanel®, in which participants are randomly recruit-         spend less on students who require fewer resources, with sharp
ed via address-based sampling and invited to participate in          partisan and ideological differences. In a separate question and
surveys online. Full details about the poll’s methodology are        for the 19th consecutive year, Americans have named the lack of
available at pdkpoll.org/methodology.                                funding as the biggest problem facing their local schools.
  Earlier, PDK released responses to a series of school
                                                                     Then and now. Fifty-five percent say students today receive a
security questions. An abbreviated version of those results is
                                                                     worse education than what they experienced when they were
included in this supplement.
                                                                     students. U.S. adults see job preparation as particularly weak,
                                                                     but they also identify some areas — such as college prep,
    78% of public school parents                                     encouraging critical thinking, and providing a good education
                                                                     for all — where today’s students are receiving a better educa-
   say they would support teachers                                   tion than they did.

     in their community if they                                      Opportunities and expectations. The public says a child’s
                                                                     education opportunities vary based on family income, racial
     went on strike for more pay.                                    or ethnic group, and urbanicity. Lower-income, rural, and
                                                                     black and Hispanic students are underserved compared with
  Among key findings in this report are the remarkable               their counterparts, they say. Many Americans also say schools
support for improving teacher salaries — and record-high             expect less from these students.
compunctions about entering the profession, in part given
                                                                     College affordability. The poll finds broad support for proposals
poor pay. Two-thirds of Americans say teacher pay in their
                                                                     to make college more affordable. Seventy-five percent of Amer-
community is too low; just 6% say it’s too high. An overwhelm-
                                                                     icans are in favor of free tuition for community college — up
ing 73% say they would support teachers in their community if
                                                                     sharply in just the past few years — while 68% support increas-
they went on strike for higher salaries, including about 6 in 10
                                                                     ing federal funding to help students pay tuition at four-year
Republicans.
                                                                     colleges. Currently, only about half of K-12 parents say they’re at
  As things stand, 54% of Americans say they would not want
                                                                     least somewhat likely to be able to pay for college — and among
their child to become a public school teacher, a majority for
                                                                     those making less than $50,000 a year, that falls to just one-
the first time in a question initially asked in 1969. Poor pay and
                                                                     third.
benefits are at the top of the list of reasons why, cited by 3 in
10 of those who’d rather not see their child go into teaching.       The value of a degree. Hand in hand with support for tuition
In a related result, funding remains the most commonly cited         assistance, the public sees value in educational attainment.
problem facing the public schools, a result that’s been consis-      Eighty-two percent see a four-year degree as good preparation
tent since the early 2000s.                                          for a good-paying job — though only 22% say it’s “very” good
Among other notable results:                                         preparation. That view rises sharply for graduate degrees.

School security. Arming teachers trails other school security        School hours. On a topic that’s been debated across the gen-
measures supported by parents. Parents lack strong confi-            erations, high school parents are largely satisfied with their
dence that schools can protect their children against a school       child’s current school schedule. But it could be better: More
shooting but favor armed police, mental health screenings,           than half say current start and end times are off their ideal by
and metal detectors more than arming teachers to protect             at least 30 minutes — generally, too early.
their children.
                                                                     School grades. The public schools continue to suffer from an
School improvement. Nearly 8 in 10 Americans prefer re-              image deficit. Among those who know them best, parents of
forming the existing public school system rather than finding        current students, 70% give their oldest child’s school an A or
an alternative approach — more than in any year since the            B grade. Among the public more broadly, by contrast, only
question was first asked two decades ago. There’s no difference      four in 10 give their local schools an A or B. In results that are
closer to home: 78% say they’d rather reform than replace the        typical across the years, far fewer give top grades to the public
local school system.                                                 schools nationally, just 19%.

Spending and funding. The public supports spending more on             The report that follows delves into each of these topics
students who need extra support (60%) rather than spending the       in greater detail, evaluating results of related questions and
same amount on every student (39%). But they divide evenly on        differences among groups. More complete results for each
where the funds should come from: Half favor raising taxes to        category are available at pdkpoll.org.

K4 PDK Poll   September 2018
WHAT AMERICANS SAID . . .                                           “about right,” but only one-quarter of those with $100,000-plus

Are we paying
                                                                    incomes say it’s acceptable.
                                                                    Would you support a teacher strike?

teachers what
                                                                       Despite declining union affiliation in general, 73% say they
                                                                    would support public school teachers in their community if

they’re worth?
                                                                    they went on strike for higher pay. Even among public school
                                                                    parents — those who would be most directly affected by a
                                                                    strike — 78% say they’d support a teacher walkout.
                                                                       Regional differences occur here as well. Southerners (78%)
                                                                    are more likely than Northeasterners (67%) or Midwesterners
                                                                    (69%) to say they’d support a teacher strike for higher pay;
                                                                    Westerners fall in between at 74%. Four in 10 Southerners and
                                                                    Westerners say they’d “strongly” support a strike, compared
                                                                    with those living in the Northeast (28%) and Midwest (23%).
                                                                       Majorities across partisan lines say they’d support teachers
                                                                    striking for higher pay, albeit with wide gaps. Eighty-seven
                                                                    percent of Democrats say they’d back a strike, 49% saying
                                                                    they’d do so strongly. That falls to 57% among Republicans,
                                                                    just two in 10 strongly. Independents fall in between at 71%
                                                                    support, including 24% strongly.

                                                                                         Teacher pay
                                                                                                 National totals, 2018
                                                                               Teacher salaries in your             If teachers went on strike for
                                                                                 community are . . .               higher pay in your community,
                                                                                                                           would you . . . .
                                                                      80%-
                                                                                                                          73%
                                                                       70%-                      66%
   After several high-profile teacher strikes in the past year,       60%-
the 2018 PDK poll finds broad support for higher teacher pay.
                                                                      50%-
Two-thirds say teacher salaries are too low, a new high in data
since the first PDK poll in 1969. This result was confirmed by        40%-
separately measuring reactions to a starting salary of $39,000 —      30%-              27%                                         27%
the national average for public school teachers, according to the
National Education Association. Again, 65% say it’s too low.          20%-

   Majorities across groups say teachers in their communi-             10%-     6%
ties are paid too little, ranging from 85% of blacks to 55% of
                                                                       0%-
conservatives and rural residents. Views that teacher pay is                    Too     About     Too                    Support Oppose
                                                                                high    right     low                     them them
“about right” peak at about one-third of Republicans and con-
servatives, those in the Northeast or Midwest, rural residents,     PDK poll, 2018
seniors, and adults with no more than a high school diploma.
   Few say teachers are overpaid. Just 6% of all adults say
teacher salaries are too high, peaking at 19% of Northeastern-
ers and dropping to single digits in other regions. (National
Education Association data indicate that starting salaries are
                                                                         Majorities across groups say
highest in the Northeast, on average $42,300, and lowest in the         teachers in their communities
Midwest, on average $36,000.)
   One’s financial situation strongly influences views on a                   are paid too little.
starting salary for teachers. Four in 10 of those with household
incomes of $50,000 or less say a starting salary of $39,000 is

                                                                                                                             V100 N1     PDK Poll K5
Teacher salaries too high? Too low?
                                                                              National totals, 1969-2018
    80%-

    70%-
                                                                                                                                                                    66%
    60%-                                                                                   SALARIES TOO LOW

    50%-

    40%-
              43%
                                                                                                                                        JUST ABOUT RIGHT
              33%
    30%-
                                                                                                                                                                    27%
    20%-

    10%-             SALARIES TOO HIGH
                                                                                                                                                                    6%
     0%-        2%
                    1969                                 1981				                   1990                                    2003                           2015   2018

Gallup produced the PDK polls from 1969 to 2015. Langer Research Associates has produced the PDK poll since 2016, including the 2018 poll.

PDK poll, 2018

   Digging deeper
                   n n n Teacher salaries also emerge as a                                               Just 6% of all adults say
                   prominent issue when we ask Americans
                                                                                                       teacher salaries are too high.
                   to identify the biggest problems facing the
                   public schools. Nine percent specifically
                   mention teacher salaries, and 26% cite
                   funding issues more broadly. Concern about                                 THE QUESTIONS
                   funding is far higher among adults who say                                   Q1. Do you think salaries for teachers in your
                   teachers are underpaid (32%) than among                                          community are too high, too low, or just about
                                                                                                    right?
                   those who say they are not underpaid (14%).
                                                                                                Q2. Imagine that the average starting salary for a
                                                                                                    public school teacher in your community was
                                                                                                    $39,000 a year. Would you consider that too
                                                                                                    high, too low, or just about right?
                                                                                                Q3. If public school teachers in your community
                                                                                                    went out on strike for higher pay, would you
                                                                                                    support them or oppose them?

                                                                                                           Learn more and join the
                                                                                                               conversation at
                                                                                                                    pdkpoll.org
K6 PDK Poll     September 2018
WHAT AMERICANS SAID . . .

Would you want your child to
become a teacher?

   Public school teaching as a career path has lost much of its
allure. Fifty-four percent of parents would not like one of their
children to take up teaching in the public schools as a career,
                                                                              Views of public school
a majority response to this question for the first time since we                    teaching
began asking the question in 1969. Although 46% would sup-                                       National totals, 2018
port a teaching career, that’s down steeply from 70% in 2009
                                                                           Would you like to have your child          Do you have trust and
and from a high of 75% in the first PDK poll in 1969. Support               take up teaching in the public          confidence in public school
                                                                                      schools?                              teachers?
has been lower just once before, by a single percentage point,        80%-
during a trough in the early 1980s.                                    70%-
   Sixty-seven percent of Hispanics would favor their child                                                              61%
working as a teacher, declining to 51% of blacks and 40% of           60%-
                                                                                                54%
whites. Whites with college degrees are essentially split, while      50%-        46%
those without a degree oppose it — 69% of white men without
                                                                      40%-                                                               39%
degrees say they wouldn’t want their child to take up teaching,
as do 59% of white women with no degree.                              30%-
   Americans may not want their children to become teachers,          20%-
but most say they have trust and confidence in teachers — 61%
                                                                       10%-
— although this leaves four in 10 (39%) who lack such confi-
dence. That’s the highest lack of confidence in seven PDK polls        0%-
                                                                                     Yes          No                     Yes             No
since the question was first asked in 2010, though it was similar
(35%) in 2014. Parents of school-age children have higher trust
than those without children in school, 68% vs. 59%.                 PDK poll, 2018

                                                                                                                               V100 N1    PDK Poll K7
Photo: iStock
Would you like your child to become a teacher?
                                                                             National totals, 1969-2018
   80%-    80
              75%
   70%-    70
                                            YES
   60%-    60
                                                                                                                                                              54%
   50%-    50
                                                                                                                                                              46%
   40%-    40
                                                                                                            NO
   30%-    30
   20%-    20
              15%
    10%-   10
    0%-       0
            1969 1972 1980 1983 1988 1990 1993 2005 2009		2011                                                                                  2014      2018

   Gallup produced the PDK polls from 1969 to 2015. Langer Research Associates has produced the PDK poll since 2016, including the 2018 poll.

PDK poll, 2018

  Liberals and white women with college degrees, as well as
those who rate public schools highly, are most likely to have
trust and confidence in teachers, three-quarters or more of
                                                                                                Digging deeper
each. This drops to only about half of conservatives, Northeast-
erners, white men without degrees, and adults who give low                                                       n n n Those who think more highly
grades to the schools.                                                                                           of the public schools are more apt to
                                                                                                                 like the idea of their child becoming a
                                                                                                                 teacher. Among those who give schools
                                                                                                                 nationally an A or B grade, 63% would
               Public school teaching                                                                            support a teaching career for a child,

              as a career path has lost                                                                          compared with 42% of adults who give

                 much of its allure.
                                                                                                                 schools a C or lower.

THE QUESTIONS
 Q4. Do you have trust and confidence in the men
     and women who are teaching children in the
     public schools?
 Q5. Would you like to have a child of yours take up
     teaching in the public schools as a career?
 Q6. [Asked if the response was no] Why would
     you not like to have a child of yours take up
     teaching — what’s the main reason?
K8 PDK Poll    September 2018
WHAT AMERICANS SAID . . .
Why not go into teaching? Is your child safe
at school?
In an open-ended question, the most common responses men-
tion inadequate pay and benefits, followed by student behavior
and lack of discipline. Among the sharpest gaps, 41% of Dem-
ocrats who wouldn’t want their child to teach cite poor pay,
compared with about one-quarter of Republicans and Indepen-
dents. Republicans (17%) and Independents (15%) are slightly
more likely than Democrats (6%) to mention student behavior as
a reason to avoid teaching.
Here are some of the answers said in response to the question:
“Why would you not like to have a child of yours take up teach-
ing?”
n Crappy pay.
n It’s dangerous being a teacher.
n Low salary, low social respect, and physically exhausting.
n The classes are too large, the pay is awful.
n Poor pay considering all the responsibilities and personal
expenses involved.
n Overworked, underpaid, and underappreciated.
n Too much chaos in public schools.
n Teaching seems to be more of a thankless job these days
because so many kids are just going through the motions
and not committed to learning.
n They are not paid well. In our community, a teacher has a
hard time owning a home.
Parents lack strong confidence that schools can protect
n Their time and effort outside the classroom, plus the
emotional toll of investing in individual students, as well as their children against school shootings but favor armed police,
classes in whole, is not reflected in their paychecks. mental health screenings, and metal detectors more than
n Kids are mean. arming teachers.
n Low pay, too political. Just 27% of K-12 parents express strong confidence that their
n Too much disrespect. school could deter an attack like those that have wrenched
n Too much bureaucracy. communities across the nation. One in 3 parents (34%), more-
n The teachers get treated like crap if kids aren’t up to par on over, fears for their child’s physical safety in school, up sharply
the testing scores. They also don’t get paid enough. It’s sad to a level last seen two decades ago, a disturbing number to
we pay more to guys running back and forth on courts and express such a fundamental concern. It’s been this high before
fields than we do to the ones we entrust with our children.
in a PDK survey 20 years ago but represents a steep increase
n Because the students run the classroom. The teachers from 2013 when just 12% were fearful.
cannot force them to pay attention or do what they want
them to do. Students that don’t want to pay attention make Differences among groups are stark. Fears for a child’s
it hard for the children that want to learn. safety at school are twice as high among parents with less than
n Low income. They would struggle to make ends meet. $50,000 in household income (48%) compared with those
n The income is not enough to raise a family. making $100,000 or more (24%). Fear also tops 40% among
n The reason there are not always quality teachers in public urban parents, nonwhites, and those without college degrees.
schools is because of the way they are paid and treated. And Democrats and liberals are 20 and 16 points more likely
I would not want my future child to be treated poorly or than Republicans and conservatives to say they’re fearful for
paid less than they deserve for a job that is as difficult as
teaching children. their child’s safety.
Reaching for solutions, parents overwhelmingly support
n It’s a thankless job.
armed police in the schools (80%), mental health screening
n Because the kids these days are rude and disrespectful.
of all students (76%), and metal detectors at entrances (74%).
n It’s not rewarding enough. It’s a very tough job.
When faced with a choice of spending money on armed
guards in school or on mental health services for students,
the public overwhelmingly prioritizes mental health services
V100 N1 PDK Poll K9
Image: iStockDo you fear for your child’s Fear for child’s safety
safety at school? at school
Parents of school-age children, 1977-2018 Parents of school-age children, 2018
60%-
100%- Yes No No opinion
50%- 48%
90%- 88% 41%
40%-
80%- 34% 34%
30%-
29%
70%- 69% 24%
65% 63% 20%-
60%-
10%-
50%-
0%-
40%- AllTHE QUESTIONS
Q7. Thinking again about your oldest child in K-12, law enforcement. If these conditions were in
when he/she is at school, do you fear for your place, would you support or oppose allowing
child’s physical safety? teachers and other school staff to carry guns in
school?
Q8. How confident are you that there is sufficient
security against a shooting attack at your Q11. Would you support or oppose paying a bonus
child’s school? to teachers and other school staff who carry
Q9. Would or do you support or oppose the guns in school?
following at your child’s school? Having one or Q12. Would you prefer to have your oldest child in
more armed police officers on duty whenever K-12 in a classroom with a teacher who carries
school is in session; having metal detectors a gun or in a classroom with a teacher who
at all school entrances; allowing teachers does not carry a gun?
or other school staff to carry guns in school;
screening all students for mental health Q13. If you knew that teachers or other school staff
problems. at your child’s school carried guns during the
school day, would you feel that they were more
Q10. Some programs require teachers or school safe, less safe, or about the same?
staff to undergo special training in order to be
permitted to carry a gun at school. An example Q14. If you had to choose, which of these would you
is 80 hours of training in the use of force, rather have schools spend money on — mental
weapons proficiency, legal issues, and first health services for students OR armed guards
aid; and approval by the school board and local in school?
School security proposals School spending
Parents of school-age children, 2018 preferences
100%- Parents of school-age children, 2018
Support Oppose
90%- 100%- Armed guards Mental health services
80%- 80% 76% 90%-
74% 83%
70%- 80%-
63% 71%
60%- 70%- 69%
50%- 49% 50% 60%- 59%
40%- 37% 50%-
30%- 40%- 40%
23% 25%
20%- 19% 30%- 28% 27%
10%- 20%- 16%
0%- 10%-
Armed police Mental health Metal Allowing Armed
in school screening detectors at armed teachers/
entrances teachers/staff staff with 0%-
All Democrats Independents Republicans
conditions
PDK poll, 2018 PDK poll, 2018
V100 N1 PDK Poll K11WHAT AMERICANS SAID . . .
Should we improve schools or start
from scratch?
Whatever the challenges facing the public schools, Ameri- with 78% preferring reform and 21% backing alternatives. Sev-
cans want to improve the system — not upend it. Seventy-eight enty-two percent prefer reform at both levels, compared with
percent — a new high in PDK polls that began asking the just 15% who favor alternatives to the current system in both.
question in 1997 — prefer “reforming the public school sys-
tem” over “finding an alternative” to the existing system. That
includes a vast gap in strength of sentiment: Fifty-five percent
strongly prefer reforming the system, while just 15% strongly Digging deeper
favor replacing it.
Majority preference for reforming rather than remaking the
n n n Local impressions make a
school system holds across groups, although there are differ-
ences. Hispanics aren’t as attached to the current system; 65% difference: People who rate their local
prefer reform over alternatives vs. 81% of blacks and 79% of schools highly (A’s or B’s) are more
whites. Among whites, the preference for reform peaks among
white women with college degrees (87%) compared with white
likely to suggest that schools across the
men who do not have college degrees (73%), with a 21-point country should be reformed rather than
gap in the strength of that sentiment.
reconstituted, compared with those
Liberals (83%) and moderates (80%) are more likely than
conservatives (69%) to back reform. About one-quarter of con- who give C’s or lower, 86% vs. 73%.
servatives strongly prefers finding alternatives, compared with
1 in 10 liberals and 1 in 8 moderates.
Results are similar when it comes to reforming or reconsti-
tuting schools in one’s own community rather than nationally,
Reform or replace the public school system?
National totals, 2018
100%-
Reform system Find alternative
90%-
81% 83%
80%- 78% 79% 80%
70%- 69%
65%
60%-
50%-
40%-
34%
30%- 30%
22% 21% 20%
20%- 19% 17%
10%-
0%-
All Whites Blacks Hispanics Liberals Moderates Conservatives
PDK poll, 2018
K12 PDK Poll September 2018Reform or replace, 1997-2018
National totals, 1997-2018
80%-
78%
70%- 71%
REFORM EXISTING SYSTEM
60%-
50%-
40%-
30%-
FIND AN ALTERNATIVE
20%- 23% 22%
10%-
0%-
1997 2000 2003 2006 2018
Gallup produced the PDK polls from 1969 to 2015. Langer Research Associates has produced the PDK poll since 2016, including the 2018 poll. During the Gallup years, the question
was phrased: “In order to improve public education in America, some people think the focus should be on reforming the existing public school system. Others believe the focus
should be on finding an alternative to the existing public school system. Which approach do you think is preferable – reforming the existing public school system or finding an
alternative to the existing public school system?”
PDK poll, 2018
THE QUESTIONS
Q15. Which approach do you think is preferable in Q16. Which approach do you think is preferable in
order to improve public education in America order to improve public education in your own
— reforming the existing public school system community — reforming the existing public
or finding an alternative to the existing public school system or finding an alternative to the
school system? existing public school system?
WHAT AMERICANS SAID . . .
Should schools spend more on needier
students?
Addressing a long-running debate on spending priorities, more support, declining to half of Republicans. Almost two-
the public by a 21-point margin (60% to 39%) prefers having thirds of Democrats would rather raise taxes than spend less
public schools spend more on students who need more sup- on other students, while about one-third of Republicans would
port rather than spending the same on all students regardless rather spend less. Independents fall in between.
of their need for support. These partisan differences extend to other groups. Demo-
However, Americans provide no clear guidance on how to cratic-leaning groups such as nonwhites, urbanites, and white
pay for services for students who need extra support: Half women with college degrees are more likely than their coun-
favor raising more money through higher taxes; half favor terparts to favor spending more.
spending less on students with fewer needs. Seven in 10 urbanites support spending more, while just
The political gaps on both questions are very large. Seven more than half of those in suburban or rural areas say the
in 10 Democrats prefer to spend more on students who need same. Although urban and suburban residents split evenly on
V100 N1 PDK Poll K13The public — by a 21-point margin — prefers having public
schools spend more on students who need more support.
how to make that extra spending happen, more conservative
rural residents prefer spending less on other students (57%)
over raising taxes (41%).
THE QUESTIONS
Q17. Which approach to school spending do
you prefer — spend more money educating
students who need extra support or spend
the same amount of money on each student
regardless of his or her need for support?
Q18. If schools were to spend more money on
students who need extra support, which of
these would you prefer — spend less money on
students with fewer needs or raise more money
for the schools through taxes?
School spending by need
School spending by need National totals, 2018
Spend more on Raise taxes to
National totals, 2018 students who need it pay for it
% %
Which approach to If schools spend more on All 60 49
80%- school spending those who need extra support,
do you prefer? which would you prefer?
Responses by demographic group
70%-
RACE
60%-
60% Whites 56 46
Nonwhites 67 54
50%- 49% 49%
POLITICAL PARTY
Democrats 69 63
40%- 39% Independents 58 49
Republicans 49 33
30%-
POLITICAL LEANING
20%- Liberals 69 64
Moderates 59 49
10%- Conservatives 51 36
TYPE OF COMMUNITY
0%- Urban 68 49
Spend more Spend the Spend less on Raise
on students same on students with taxes Suburban 56 51
who need every student fewer needs Rural 55 41
extra support
PDK poll, 2018 PDK poll, 2018
K14 PDK Poll September 2018
Image: iStockWHAT AMERICANS SAID . . .
Do all students have the same
opportunities?
The public perceives substantial gaps in educational op- Asian students
portunities and expectations facing student groups. Some
Views on opportunities and expectations differ when it
are racial or geographic, but the sharpest are income-based:
comes to Asian students. Seventy percent of adults say Asian
75% of Americans say public school students in low-income
students have the same opportunities as white students, with
communities have fewer educational opportunities than those
the rest roughly divided on whether Asians have more or fewer
in well-off communities, and 55% say schools in low-income
opportunities.
areas have lower expectations for their students.
There are racial differences in both directions: Twenty-two
Majorities across groups see fewer opportunities for stu-
percent of nonwhites overall say Asian students have fewer
dents in low-income communities. One gap is by education
opportunities vs. 7% of whites who hold that view. But 29%
— 86% of college graduates hold this view vs. 70% of adults
of blacks say Asians have more education opportunities than
without a college degree Among others, Democrats (82%) are
whites, twice the level of whites or Hispanics who say so.
more likely than Independents (73%) or Republicans (67%) to
But 37% of Americans say Asian students face higher expec-
see fewer opportunities in low-income areas.
tations than white students, not lower ones. The comparative
The educational gap in this view extends to expectations.
numbers for black and Hispanic students are in the low single
While 68% of college graduates say schools have lower expec-
digits.
tations for students in low-income areas vs. those in well-off
(Results among Asians can’t be broken out due to the small
communities, a smaller share of adults without a college degree
sample size of this group.)
— but still 50% — say the same. Those with incomes of $50,000
or higher (59%) also are more apt to say expectations are lower
in lower-income areas than lower-income adults (48%).
Rural students Education in low-income
Overall, 53% say public school students in rural areas have
fewer educational opportunities than those living in towns,
vs. well-off communities
suburbs, and cities. Fifty-eight percent of urban dwellers say National totals, 2018
rural students have fewer educational opportunities; among Opportunities for public school Expectations for students
students in low-income areas vs. in low-income areas
rural residents themselves, 48% say so. well-off areas vs. well-off areas
A majority (56%) say schools hold the same expectations for 80%-
rural students, but about one-third of Americans say schools 75%
have lower expectations for rural students. 70%-
60%-
55%
Black and Hispanic students 50%-
Overall, 41% say black and Hispanic students alike have
40%-
fewer opportunities than white students. Blacks and Hispan- 34%
ics themselves are significantly more likely than whites to say 30%-
that their groups have fewer education opportunities. Nearly 20%- 20%
three-quarters of blacks say so; it’s much lower among His-
10%- 9%
panics, but still 51% of Hispanics see fewer opportunities for 5%
blacks and Hispanics, compared with 3 in 10 whites. 0%-
More Same Fewer Higher Same Lower
Further, 50% of all adults say black students face lower
expectations from their schools; 45% say the same about His-
PDK poll, 2018
panic students.
V100 N1 PDK Poll K15THE QUESTIONS
Q19. Compared with public school students in well- Q21. Compared with white students, do you think
off communities, do you think students in low- black students, Hispanic students, and Asian
income communities have more educational students have more educational opportunities,
opportunities, fewer educational opportunities, fewer educational opportunities, or the same
or the same educational opportunities? educational opportunities?
Q20. Compared with public school students in Q22. Schools have certain expectations for their
towns, suburbs, and cities, do you think students. Compared with schools in well-off
students in rural areas have more educational communities, do you think schools in low-
opportunities, fewer educational opportunities, income communities have higher expectations
or the same educational opportunities? for their students, lower expectations, or are
expectations the same?
Q23. Compared with schools in towns, suburbs, and
Expectations compared cities, do you think schools in rural areas have
higher expectations for their students, lower
with white students expectations, or are expectations the same?
National totals, 2018 Q24. Compared with white students, do you think
80%- schools have higher expectations, lower
Higher Same Lower
70%- expectations, or are expectations the same
60%-
for the following students: black students,
50%
53% Hispanic students, and Asian students?
50%- 50%
46% 45%
40%- 37%
30%-
Education opportunities
20%- National totals, 2018
10%- 10%
3% 4% See fewer education opportunities for students who are . . .
0%-
Black students Hispanic students Asian students Low-
income Rural Black Hispanic Asian
% % % % %
PDK poll, 2018 All 75 53 41 41 13
Responses by demographic group
POLITICAL PARTY
Digging deeper Democrats
Independents
82
73
60
53
61
39
61
37
19
6
Republicans 67 46 19 20 8
n n n There’s another gap, by age, in POLITICAL LEANING
Liberals 79 65 63 61 17
views of school expectations for Asian Moderates 76 51 43 42 13
Conservatives 70 45 21 22 9
students. Fifty-one percent of those
EDUCATION
younger than 30 say expectations College degree 86 68 52 53 8
No college degree 70 46 36 35 15
are higher for Asians than for whites, RACE
Whites 72 50 32 31 7
compared with 33% of adults age 30 and Blacks 79 44 72 66 23
Hispanics 76 59 51 51 21
older.
TYPE OF COMMUNITY
Urban 79 58 52 51 17
Suburban 74 51 42 40 12
Rural 68 48 21 21 5
PDK poll, 2018
K16 PDK Poll September 2018WHAT AMERICANS SAID . . .
Have schools improved over time?
opinion shared by 48% of Hispanics and 40% of blacks.
There’s a strong link between perceptions of local schools
and education quality overall. Those who give their local
schools an A or B grade say education is better now than when
they were in school, 61% vs. 39%. That’s essentially reversed
among those assigning lower grades, 32% vs. 68%. The pattern
is similar, though much less stark, by high and low grades for
schools nationally as opposed to locally.
Americans who report living in high- or upper-middle-in-
come communities (55%) are more likely than those who live
in middle- to lower-income areas (40%) to say that children
today get a better education than they did.
THE QUESTIONS
Q25. As you look on your own elementary and high
school education, is it your impression that
children today get a better or worse education
than you did? Do you think the education that
Fifty-five percent of adults say today’s students are receiv- students get today is much (better/worse)
ing a worse education than they did when they were students.
than your own elementary and high school
That’s the most negative result on this question (by 5 points) in
education, or somewhat (better/worse)?
the six times the PDK poll has asked it since 1973.
Notably, among those who don’t have a school-age child, Q26. Compared with the schools you attended, do
57% say children today are getting a worse education than they you think the public schools in your community
did; among parents, this declines to 46%. Whites are another today are better or worse at each of the
more critical group — 60% say schools today are worse, an following?
Public schools today vs. when you attended
National totals, 2018
Better at . . . Worse at . . .
60%- 57% 56% 58%
55% 55%
52% 51%
50%- 47% 48%
42% 43% 44% 43% 41%
40%-
30%-
20%-
10%-
0%-
College Educating all Encouraging Ensuring Interpersonal Facts and Work
preparation abilities/ critical respect skills figures preparation
backgrounds thinking for all
PDK poll, 2018
V100 N1 PDK Poll K17
Photo: ComstockWHAT AMERICANS SAID . . .
Should community college tuition
be free?
The public overwhelmingly supports the concept of tui- 73% of other adults. Three-quarters of parents of K-12 students
tion-free community college, a policy already implemented support increased federal funding for tuition assistance; so do
or proposed in several states and cities. Seventy-five percent two-thirds of other adults.
of Americans are in favor, compared with 58% when the same Even among the wealthiest parents of school-age children,
question was asked just three years ago. with $100,000-plus incomes, nearly 3 in 10 are unsure they’ll
Moreover, 68% support greater federal assistance with four- be able to pay for college — and that soars to two-thirds of
year college tuition. That could be because just 19% of parents those with incomes less than $50,000. (It’s 52% in the middle
of K-12 students say it’s “very likely” that they will be able to
pay for their child’s college tuition (an additional 35% call it
“somewhat likely”).
In all, 6 in 10 Americans favor making community college
free and increasing federal funding for four-year college tui-
tion assistance.
Democrats (94%) favor tuition-free community college most
strongly, but the concept is also popular among Independents
(70%). Republicans are split, 48% vs. 52%. Nonwhites are 21
points more likely than whites to favor the idea, 88% vs. 67%.
There are similar patterns on increasing federal tuition sup-
port, although support across groups is slightly lower.
Support for these initiatives is only slightly higher among
parents of K-12 students than others. Eight in 10 parents of
K-12 students favor making community college free but so do
Making college more Ability to pay for college
affordable Parents of school-age children, 1995-2018
National totals, 2018
80%-
Providing free Increasing federal funding to
tuition at community help students pay for four-year 69%
70%-
colleges college
80%- LIKELY ABLE TO PAY
75% 60%-
70%- 68% 54%
50%-
46%
60%- 40%-
50%- 29%
30%-
40%- 20%-
32% NOT LIKELY ABLE TO PAY
30%-
25% 10%-
20%- 0%-
1995 2008 2014 2018
10%- 2010 2015
0%-
Favor Oppose Support Oppose Gallup produced the PDK polls from 1969 to 2015. Langer Research Associates has
produced the PDK poll since 2016, including the 2018 poll.
PDK poll, 2018 PDK poll, 2018
K18 PDK Poll September 2018
Photo: StockbyteIs a degree good preparation for a good-paying job?
National totals, 2018
Very Somewhat Not so Not at all
70%-
60%-
60%
53%
50%- 49%
44%
41%
40%-
34%
31%
30%-
22%
20%-
13% 12% 13%
10%- 9%
6% 4% 4%
3%
0%-
Two-year Four-year Master’s Ph.D.
PDK poll, 2018
$50,000 to $100,000 group.) More than half of adults who have graduated from college and those who have not: 75% of
don’t have college degrees expect challenges paying vs. 28% of college graduates say the degree is key to future success; 55%
college graduates. of adults who lack college degrees agree. That difference is
driven by whites, particularly white men. White men with col-
lege degrees are keener on further education: 73% say it’s key;
Is a college degree worth the cost?
26% say it’s not worth the cost. Just 41% of white men without
Many Americans may be uncertain if they can afford college a college degree say it’s worth it; 56% say it’s not. Majorities
bills, but most are convinced that college degrees are worth of white women say college is key to success, regardless of
the expense. More than 60% say a degree from a two-year whether they have a degree.
community college prepares someone for a good-paying job
in today’s economy. That rises sharply if it’s a four-year college THE QUESTIONS
degree, master’s degree, or Ph.D. — more than 80% in each
case say those prepare students for a good-paying job.
Q27. In general, how well do you think each of the
Strength of sentiment differs — just 9% are “very” confident
following prepares someone for a good-paying
that a community college degree helps get a good job, and
22% say so about a bachelor’s. That rises to 44% for a master’s
job in today’s economy? A two-year degree
degree and 49% for a Ph.D.
from a community college, a four-year degree
Those with four-year degrees or higher are more skeptical from a college or university, a master’s degree,
about community colleges — 54% see them as good prepara- or a Ph.D. degree.
tion for a good job vs. 65% of those with less education. Still, Q28. Which comes closer to your view: A four-year
no more than 1 in 10 in either group says a community college college degree is a key to future success OR a
degree will prepare someone very well. four-year college degree is not worth the cost?
College graduates (92%) are more likely than those without
a college degree (81%) to see a postgraduate degree as good Q29. Political leaders are discussing a proposal that
preparation. Adults who have postgraduate education are 10 community college should be free for students.
points more likely to see a master’s as good preparation than a Do you favor or oppose this idea?
Ph.D., a difference not seen in other groups. Q30. Would you support or oppose increasing
Another way of looking at the cost-benefit equation is to
federal funding to help students pay for four-
assess whether a four-year college degree is “a key to future
year college tuition?
success” or “not worth the cost.” Sixty-one percent overall
say it’s crucial to future success, and 70% of nonwhites Q31. How likely do you think it is that you or your
agree. family will be able to pay for college for your
There’s a 20-point gap on this question between those who oldest child in K-12?
V100 N1 PDK Poll K19WHAT AMERICANS SAID . . .
Should we change the school schedule?
School hours are a perennial topic of debate. This year’s PDK p.m. end-of-school time, 46% vs. 19%. Parents whose oldest is a
study finds limited complaints but also a preference for later girl are more likely to favor a slightly later slot, 3 to 3:45 p.m.
start and end times to the school day among high school par- In all, about 6 in 10 high school parents would like a change
ents. One attractive reason is to allow for more classroom time; of at least 30 minutes in either school start or end times — in
another is simply to let kids sleep in. The possibility of increased almost all cases, a later start or a later end time.
bus time or bus expenses doesn’t raise much concern. Asked about positive reasons to change school schedules, 71%
In general, nearly all parents — 92% — say current school endorse creating more time in the classroom and 63% like letting
start and end times work very or somewhat well with their fam- their high schooler get more sleep. Many fewer (41%) say it would
ily’s schedules, a result that’s consistent across grade levels. be worth it to change the schedule to better fit their work hours.
And three-quarters of high school parents wouldn’t change the (Just one-third of whites say that accommodating one’s work is a
current length of the school day. good reason to adjust the schedule vs. 52% of nonwhites.)
Still, high school parents do identify some potential areas Asked about negatives of a schedule change, just 28% and 32%
for change. Sixty-four percent say their child’s current school express concern about more time on the school bus or higher school
start time is between 7 and 7:45 a.m., but only one-third of par- district costs for bus service. More, but still a minority (41%), are
ents pick this as their preferred school start time. Instead, 66% concerned about conflicts with before- or after-school activities.
would prefer that school start at 8 a.m. or later — just 36% say
their child’s school now starts at 8 a.m. or later. School start and end times
Fathers of high schoolers are more likely to favor an early start, Parents of high school students, 2018
with 42% saying school should start between 7 and 7:45 a.m., 7 to 7:45 a.m. 8 a.m. or later
compared with just 24% of mothers. There’s common ground at 8 % %
to 8:45 a.m., preferred by 48% of fathers and 57% of mothers. Current high school start time 64 36
Preferred start time 33 66
Similarly, 54% say their high schooler’s school day now ends
at 2 to 2:45 p.m., but fewer (33%) call this ideal. Sixty-three 2 to 2:45 p.m. 3 p.m. or later
% %
percent of high school parents want school to end at 3 p.m. or
later. School now ends that late for many fewer (42%). Current end time 54 42
Preferred end time 33 63
Parents whose oldest (or only) child is a high school boy are
more likely than those whose oldest is a girl to prefer a 2 to 2:45 PDK poll, 2018
Reasons to change school Reasons not to change
schedules school schedules
Parents of high school students, 2018 Parents of high school students, 2018
80%- Good reason Not a good reason 80%- Good reason Not a good reason
71% 71%
70%- 70%- 66%
63%
60%- 58% 60%- 58%
50%- 50%-
41% 41%
40%- 40%-
34% 32%
30%- 28% 30%- 28%
20%- 20%-
10%- 10%-
0%- 0%-
Allows for more Allows child to Better fit with More time on bus District spending on bus Interference with
class time get more sleep work schedule service would increase extracurriculars
PDK poll, 2018 PDK poll, 2018
K20 PDK Poll September 2018THE QUESTIONS Q36. About what time does your child’s regular
school day end? Do not include clubs and other
Q32. Thinking again about your [oldest] child in K-12, extracurricular activities.
how well do your child’s regular school hours Q37. From your perspective, what would be the ideal
work with your family’s schedule? time for your child’s regular school day to end?
Q33. [Asked only of parents of high school students] Q38. What do you think about these reasons for
Would you prefer your child’s regular school changing his/her school schedule? He/she
day to be longer than it is now, shorter than it is could get more sleep. It would work better with
now, or kept the same length as it is now? Do not your work schedule. It allows for more time in
include clubs and other extracurricular activities. the classroom.
Q39. What do you think about these reasons against
Q34. About what time does your child start his/her
changing your child’s school schedule? He/
regular school day? Do not include clubs and
she would have to spend more time on the bus.
other extracurricular activities.
The district would have to spend more for bus
Q35. From your perspective, what would be the ideal service. It would interfere with before-school
time for his/her regular school day to start? or after-school activities.
WHAT AMERICANS SAID . . .
How would you grade the schools?
The 2018 PDK poll repeated its long-standing practice of deserve higher grades than do other adults (17%).
asking Americans to assign A-Fail grades to the public schools. This year’s ratings for schools in the community and nation-
As in past years, parents rate their own children’s schools ally may be influenced by a survey mode effect; the new study
quite highly — 70% give them an A or B grade. The public was conducted using a random-sample online panel rather
overall gives lower ratings to their local schools, 43% A’s or B’s, than random-sample telephone calls, and research indicates
and the nation’s schools as a whole receive much lower ratings that questions like these can produce more negative results
still, 19% A’s or B’s. when self-administered rather than when talking to a live
Even though ratings for one’s child’s school are high, there
are large gaps among groups. Those living in higher-income
areas, college graduates, and parents with higher incomes Grading the schools
themselves are more likely than those living in lower-income
National totals, 2018
areas, adults without a college degree, and those earning less
than $100,000 to award A or B grades to their child’s school, A/B C D Fail
by 27-, 20-, and 12-point margins. 70%-
70%
Slightly fewer blacks (60%) than whites (73%) give an A or B to
60%-
their oldest child’s school.
Local schools are graded well by more than half of parents and 50%- 46%
43%
those living in high- or upper-middle-income areas. By contrast,
40%- 38%
only about one-third of blacks, conservatives, and those making
less than $50,000 say the same. Evaluations among parents are 30%- 26%
22%
more positive, with the exception of black parents, but follow 20%- 19%
similar patterns. 11% 8%
10%- 9%
While the nation’s public schools overall receive middling 5% 3%
grades, Hispanics (36%) and blacks (23%) are significantly more 0%-
Public schools Public schools in Child’s school
likely than whites (14%) to give them an A or B. The same goes for nationally your community (among parents)
urbanites (22%) and suburbanites (20%) vs. rural residents (11%).
PDK poll, 2018
More parents of school-age children (27%) say schools nationally
V100 N1 PDK Poll K21A’s and B’s for public schools, 1974-2018
National totals, 1974-2018
80%
71%
70%
70%
60%
Oldest child’s school
50% 48%
40% Local schools 43%
30%
20% 20%
19%
Nation’s schools
10%
0%
1977
1987
1997
2007
2017
1978
1979
1980
1988
1989
1990
1998
1999
2000
2008
2009
2010
2018
1974
1975
1976
1981
1982
1983
1984
1985
1986
1991
1992
1993
1994
1995
1996
2001
2002
2003
2004
2005
2006
2011
2012
2013
2014
2015
2016
Gallup produced the PDK polls from 1969 to 2015. Langer Research Associates has produced the PDK poll since 2016, including the 2018 poll.
PDK poll, 2018
Biggest problem facing local schools, 1969-2018
Biggest problem facing local schools, 1969-2018
National totals, 1969-2018
Percentage identifying lack of discipline lack ofLack
Lack of discipline financial support
of financial support useUse
of of
drugs
drugs fighting/gang violence as the top problem
Fighting/gang violence
40
40%
35
35%
30
30%
25
25%
20%
20
15%
15
10%
10
5%
5
0%
0
1969
1970
1971
1972
1973
1974
1975
1976
1977
1978
1979
1980
1981
1982
1983
1984
1985
1986
1987
1988
1989
1990
1991
1992
1993
1994
1995
1996
1997
1998
1999
2000
2001
2002
2003
2004
2005
2006
2007
2008
2009
2010
2011
2012
2013
2014
2015
2016
2017
2018
Gallup produced the PDK polls from 1969 to 2015. Langer Research Associates has produced the PDK poll since 2016, including the 2018 poll.
PDK poll, 2018
K22 PDK Poll September 2018interviewer. At the same time, both results have been this low Q41. Students are often given the grades of A, B, C,
or lower previously — most recently in 1996 for community D, and Fail to denote the quality of their work.
schools and in 2014 for schools nationally. Suppose the public schools themselves, in
We asked respondents who didn’t give their community’s your community, were graded in the same way.
schools an A grade what it would take for those schools to earn What grade would you give the public schools
an A. One in 5 said changing the curriculum would help, while
here — A, B, C, D, or Fail?
other frequently cited issues included education standards,
funding problems, and teacher quality. Q42. How about the public schools in the nation as
Since 1969, the poll’s first question has been about the big- a whole? What grade would you give the public
gest problem facing the local public schools. For 17 consecu- schools nationally — A, B, C, D, or Fail?
tive years, the lack of funding stands out as the most frequent-
Q43. Using the A, B, C, D, Fail scale again, what
ly cited issue, with 26% mentioning it this year. Problems with
student behavior are the next most common, with 10% each
grade would you give the school your oldest
mentioning general student discipline or bullying this year.
child attends?
Q44. Thinking again about the public schools in your
own community, what would they have to do to
THE QUESTIONS
earn an A grade from you?
Q40. What do you think are the biggest problems Q45. Which approach do you think is preferable in
facing the public schools in your community? order to improve public education in America?
PDK POLL ADVISORY GROUP, 2018
Methodology Katherine Bassett
PRESIDENT AND CEO
The 2018 PDK Poll of the Public’s Attitudes Toward the Public Schools was designed, managed, National Network of State Teachers of the Year
analyzed, and reported by Langer Research Associates of New York, N.Y., in consultation with Catherine Brown
PDK. All results described in this report were tested for statistical significance. VICE PRESIDENT, EDUCATION POLICY
Center for American Progress
Langer Research Associates is a charter member of the Transparency Initiative of the American Tyrone Byrd
Association for Public Opinion Research. After six months, researchers will have access to the DIRECTOR OF SECONDARY EDUCATION
complete dataset through the Roper Center for Public Opinion Research. Arlington (Va.) Public Schools
The survey was conducted May 1-21, 2018, among a random national sample of 1,042 adults, Jessica Cardichon
DIRECTOR, FEDERAL POLICY
including an oversample to 515 K-12 parents. Results have a margin of sampling error of 3.9 Learning Policy Institute
points for the full sample and 5.5 points for the sample of parents, the focus of this report, Heather Harding
including design effects. Error margins are larger for subgroups. SENIOR PROGRAM OFFICER, U.S. PROGRAMS, COLLEGE READY
Bill & Melinda Gates Foundation
On May 18, during the closing days of the survey’s field period, eight students and two teachers Rene Islas
were killed in a school shooting at Santa Fe High School in Santa Fe, Texas. All but 18 of the EXECUTIVE DIRECTOR
respondents, including nine parents, completed the survey before this event. National Association for Gifted Children
Robert Mahaffey
Sampling and data collection were provided by GfK Custom Research via its nationally EXECUTIVE DIRECTOR
representative, probability-based online KnowledgePanel®, in which participants are randomly The Rural School and Community Trust
recruited via address-based sampling to participate in survey research projects by responding Nat Malkus
RESIDENT SCHOLAR AND DEPUTY DIRECTOR, EDUCATION POLICY
to questionnaires online. Households without internet connections are provided with a web- American Enterprise Institute
enabled device and free internet service.
Princess Moss
The survey was designed to include about 540 adults in the general population, and, through SECRETARY-TREASURER
National Education Association
oversampling, 500 parents of students in grades K-12, including 100 black parents and 100
Hispanic parents. The full sample was weighted to reflect the correct proportions of these Jose Munoz
DIRECTOR
oversampled populations. The questionnaire was available to respondents in English and Coalition for Community Schools
Spanish. Jasmine Oke
SENIOR ASSOCIATE, EDUCATIONAL ISSUES
The survey questionnaire was pretested April 27-30, 2018. After initial invitations, email American Federation of Teachers
reminders were sent to all nonresponders on the third, seventh, and 14th days of the field Joan Richardson
period, with additional reminders to black and Hispanic parents on the 10th, 17th, and 19th PDK POLL DIRECTOR
days of the field period. Out of 1,830 panel members invited to participate, completed, qualified PDK International
surveys were provided by 1,065. Participants completed the survey in a median time of 11 Carolyn Sattin-Bajaj
ASSOCIATE PROFESSOR
minutes. Seton Hall University, South Orange, N.J.
The sample composition after quality control was 527 general population adults and 515 K-12 Nathan Smith
parents, including 103 black parents and 101 Hispanic parents. DIRECTOR OF PUBLIC POLICY
GLSEN
More complete details about the methodology are available at pdkpoll.org/methodology Joshua P. Starr
CEO
PDK International
V100 N1 PDK Poll K23You can also read