Breast Cancer Mass Detection in Mammograms Using Gray Difference Weight and MSER Detector
←
→
Page content transcription
If your browser does not render page correctly, please read the page content below
SN Computer Science (2021) 2:63
https://doi.org/10.1007/s42979-021-00452-8

    ORIGINAL RESEARCH

Breast Cancer Mass Detection in Mammograms Using Gray Difference
Weight and MSER Detector
B. V. Divyashree1 · G. Hemantha Kumar1

Received: 29 August 2020 / Accepted: 5 January 2021 / Published online: 30 January 2021
© The Author(s), under exclusive licence to Springer Nature Singapore Pte Ltd. part of Springer Nature 2021

Abstract
Breast cancer is a deadly and one of the most prevalent cancers in women across the globe. Mammography is widely used
imaging modality for diagnosis and screening of breast cancer. Segmentation of breast region and mass detection are crucial
steps in automatic breast cancer detection. Due to the non-uniform distribution of various tissues, it is a challenging task to
analyze mammographic images with high accuracy. In this paper, background suppression and pectoral muscle removal are
performed using gradient weight map followed by gray difference weight and fast marching method. Enhancement of breast
region is performed using contrast limited adaptive histogram equalization (CLAHE) and de-correlation stretch. Detec-
tion of breast masses is accomplished by gray difference weight and maximally stable external regions (MSER) detector.
Experimentation on Mammographic Image Analysis Society (MIAS) and curated breast imaging subset of digital database
for screening mammography (CBIS-DDSM) show that the method proposed performs breast boundary segmentation and
mass detection with best accuracies. Mass detection achieved high accuracies of about 97.64% and 94.66% for MIAS and
CBIS-DDSM dataset, respectively. The method is simple, robust, less affected to noise, density, shape and size which could
provide reasonable support for mammographic analysis.

Keywords Breast cancer · Mammography · Gradient weight map · Gray difference weight · Fast marching · De-correlation
stretch · MSER detector

Introduction                                                                  computer-based diagnosis of mammography, it is impor-
                                                                              tant to highlight breast features as the radiologist decision
Breast cancer is the most common cancer among women                           depends on the clinical evidences on the mammograms.
after 40 years and demands early detection which reduces                      Image segmentation is a crucial part in automatic detec-
the mortality rate [1, 2]. Among various imaging techniques                   tion of breast cancer which involves background suppres-
used for breast cancer screening and early diagnosis, mam-                    sion (skin–air boundary), identification of pectoral muscle
mography, a low dose X-ray imaging technique, reveals the                     boundary, breast region extraction and detection of abnormal
possibility of presence of breast cancer from the surrounding                 regions. Masses are the most commonly found as one of the
infiltrated breast tissues [3–8]. Although having limitation,                 abnormalities in mammograms. Masses are uncontrolled
mammography has 85–90% sensitivity for the detection of                       growth of tissues in the breast having some abnormal shape
breast cancer and remains as an effective screening tool for                  and contour.
the detection of abnormalities [9–11].                                           Existing studies on image segmentation focusing on
   The accurate detection of breast cancer in mammograms                      breast region and pectoral muscle segmentation, adopted
is difficult for the radiologist because of errors in imag-                   various techniques like thresholding methods, contour-
ing condition, overlapped cancer and normal tissues. In                       based methods, region growing methods and so on. Then,
                                                                              the detection of masses is a complex task as the computer-
                                                                              aided diagnosis (CAD) must deal with the broad range of
* B. V. Divyashree
  divyashreenivas@gmail.com                                                   possibility like its density (fatty, glandular, dense type),
                                                                              shape, sizes and margins of masses. The vast literature report
1
     Department of Studies in Computer Science, University                    is presented in Table 1.
     of Mysore, Manasagangotri, Mysore, Karnataka 570006,
     India

                                                                                                                   SN Computer Science
                                                                                                                         Vol.:(0123456789)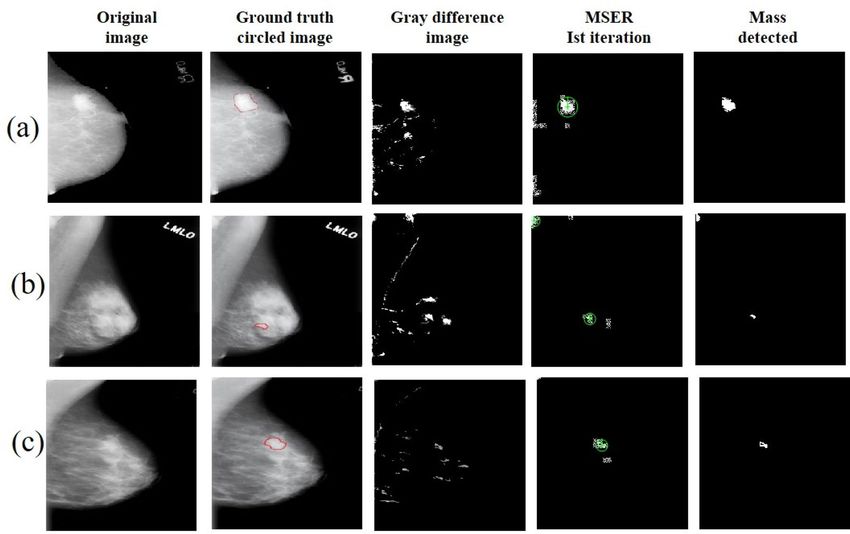
Table 1  Existing literature and their advantages and limitations
                      Literature details                                          Method used                                                   Advantages and limitations

                      Chen et al. [12]                                            Region growing                                                Obtained good accuracy in identifying breast boundary. However,
                                                                                                                                                                                                                       63 Page 2 of 13

                      Segmentation of breast region                                                                                              the boundary obtained for pectoral suppression is lower than the
                                                                                                                                                 actual boundary
                      Rampun et al. [13]                                          Region-based active contour model                             Computational complexity is simple. But, the boundary obtained
                      Estimation of breast boundary                                                                                              was lower than the actual boundary and slower processing time

SN Computer Science
                      Shi et al. [14]                                             Unsupervised pixel-wise labeling and texture filters          The method motivated by achieving good accuracies. But, the
                      Breast boundary segmentation and calcification detection                                                                   segmentation errors could be further avoided
                      Makandar et al. [15]                                        Adaptive thresholding method, watershed transformation and    The method promised high accuracy which could be further
                      Segmentation of masses in breast region                      contour-based method                                          improved
                      Rahmati et al. [16]                                         Maximum likelihood active contour method                      Showed robustness for choosing the seed point and possess high
                      Segmentation of masses                                                                                                     segmentation accuracy. The main problem of this method is that,
                                                                                                                                                 it needs expert intervention and is time consuming
                      Neto et al. [17]                                            Swarm optimization, area filters and texture descriptors      Reduced false positives. However, the method could not detect
                      Segmentation of masses                                                                                                     small masses in non-dense breast density type and failed to
                                                                                                                                                 detect mass in case of dense breast density types
                      Soulami et al. [18]                                         Meta-heuristic algorithm electromagnetism-like optimization   Unable to remove the muscle completely in some cases and hence
                      Segmentation of masses                                       (EMC)                                                         achieved less accuracy in segmentation of mass
                      Anitha et al. [19]                                          Dual stage adaptive thresholding (DuSAT) method               Achieved good average sensitivity, But, lowered its performance in
                      Segmentation of abnormality                                                                                                speculated type of lesions with less sensitivity
                      Wang et al. [20]                                            Gestalt psychology and morphological characteristics          More efficient and innovative data analysis method. But, the
                      Detection of mass                                                                                                          method faced difficulty in generalizing the parameters for differ-
                                                                                                                                                 ent dataset
                      Geraldo et al. [21]                                         Diversity analysis, geostatistical and concave geometry       Though the method was robust to different datasets, by altering
                      Detection of masses                                                                                                        filter parameters for suspicious regions reduced the false-positive
                                                                                                                                                 rate, but noticed misclassification results
                      Agarwal et al. [22]                                         Deep learning                                                 Efficient, shown improved performance with high sensitivity and
                      Detection of masses                                                                                                        low false-positive rates. But, less sensitive to small masses and
                                                                                                                                                 needs large datasets
                      Suresha et al. [23]                                         Modified fuzzy C-means clustering and deep neural network     Classification accuracy is improved. But, considered single dataset
                      Segmentation, detection and classification of masses
                      Zeiser et al. [24]                                          Deep learning                                                 Able to detect masses in high-density images. But, detected mass
                      Segmentation of masses in mammograms                                                                                        is smaller than the actual mass. Also, could not detect the masses
                                                                                                                                                  in images that have density similar to other breast tissue
                      Vikhe and Thool [25]                                        Wavelet processing and adaptive threshold technique           Simple, computation time used is more
                      Mass detection in mammographic image
                      Divyashree et al. [26]                                      Texture feature extraction and KNN classifiers                The method considers whole breast region for classification
                      Segmentation and classification of mammograms                                                                               instead of particular abnormal region of interest and obtained
                                                                                                                                                  satisfactory outputs
                      Divyashree et al. [27]                                      Thresholding method and quad tree decomposition               Simple method, very well taken care of information loss during
                      Locating the region of interest in mammograms                                                                               segmentation of breast region and suitable for subtle masses.
                                                                                                                                                  But, failed in locating large masses
                                                                                                                                                                                                                       SN Computer Science (2021) 2:63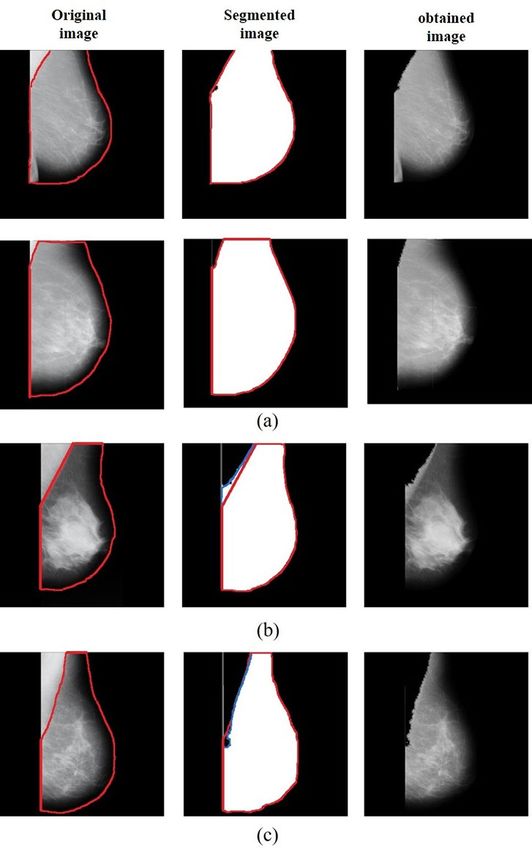
SN Computer Science (2021) 2:63                                                                                  Page 3 of 13 63

   Many of the studies in the state-of-the-art developed com-   masses can be extracted from the breast region that helps
puter-aided design system for mammographic segmentation,        radiologist’s decision for further clinical references.
detection and classification. Presently, there is a renowned
need to reduce the segmentation errors noticed in dense         Dataset
and extremely dense breast density types. Also, developing
robust model for all kinds of masses including circumscribed    For experimentation of the proposed work, Mammogram
and speculated type of lesions is still challenging. Hence,     Image Analysis Society (MIAS) database and curated breast
in this paper, an automated method is proposed to first seg-    imaging subset digital database for screening mammogra-
ment the breast region using gradient weight, gray difference   phy (CBIS-DDSM) databases are considered [28, 29]. These
weight and fast marching method. Then, enhancement of           datasets are publicly available benchmark datasets that
breast region is accomplished using contrast limited adaptive   contains 322 images and 2620 images, respectively. CBIS-
histogram equalization (CLAHE) and de-correlation stretch       DDSM dataset is standardized and updated version of digi-
followed by detection of mass using MSER detector. The          tal database for screening mammography (DDSM). From
main contribution of the paper includes estimation of breast    CBIS-DDSM dataset out of 2620 images, randomly selected
region precisely and detection of mass accurately using         200 images are considered. The images in the MIAS dataset
MSER detector that is suitable for varied size and shape.       have size of 1024 × 1024 in “Portable Gray Map” (PGM)
   The remaining part of the paper is organized as; In          format; whereas, the images in the CBIS-DDSM dataset are
“Materials and Methods”, datasets are explained followed        in DICOM format with varied size.
by detailed description of methods used to accomplish breast
region segmentation and detection of mass. In “Results”,        Background Suppression
to show the performances of the proposed method, experi-
mental results are presented. Lastly, discussions and future    Gradient Weight‑Based Segmentation
improvements of the proposed paper are presented.
                                                                A certain number of digital images in dataset contain differ-
                                                                ent artifacts similar to dense regions in the breast. In our pre-
                                                                vious work, to obtain the precise region of interest (skin–air
Materials and Methods                                           boundary), gradient weight map method is adopted [30].
                                                                The weights are computed for each pixel based on gradient
This paper proposes a more efficient and robust model for       magnitude using 3 × 3 windows. Then, the image is com-
image segmentation. The model performs background sup-          plemented to highlight the skin–air boundary followed by
pression, segmentation of pectoral muscle, segmentation         binarization. Although binarization reduces the processing
of breast region and detection of mass in the breast region     time, it does not lose any useful information in the breast
of mammograms. The workflow of the proposed model               region as binarization is adopted in the proposed work only
is shown in Fig. 1. From the integrated methodology, the        to segment the region of interest (skin–air boundary). The

Fig. 1  Workflow of the proposed model

                                                                                                       SN Computer Science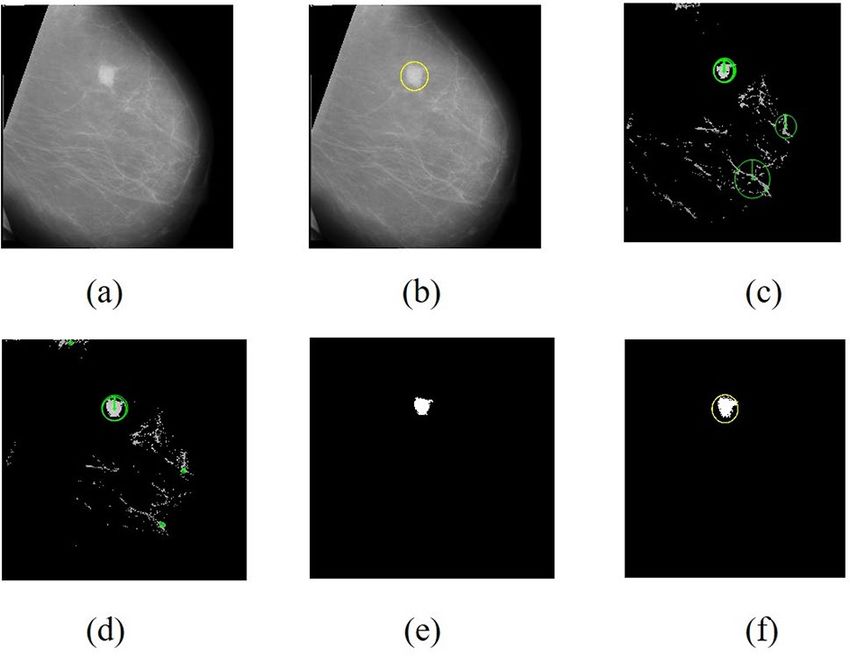
63 Page 4 of 13                                                                                           SN Computer Science (2021) 2:63

invalid connected components present in the background               difference between representative value and the intensity
region were eliminated using area opening operation with             of the pixel. If the difference between pixels is small, then
predefined threshold. Further, the largest connected com-            the gray difference weight assigns larger weights; and if
ponent is extracted which is a skin–air boundary (breast             the difference is large, the pixel weight assigned is small.
region and pectoral region). Final refinement is performed              Also, threshold is fixed on the intensity difference val-
with morphological opening operation, where the square and           ues to suppress the output weights more than the cutoff
rectangular regions fewer than the threshold are removed.            (cutoff = 25) and assigns least output weight values to
The skin–air boundary detected image is shown in Fig. 2.             those pixels. This cutoff value restricts the pectoral region
The segmented breast region plus pectoral region will then           from being added with some parts of breast region. The
be interpreted by the next level of segmentation.                    gray-scale intensity difference array obtained was not hav-
                                                                     ing significant information about the actual transitions
Breast Region Segmentation                                           between the boundaries. To solve this issue, a numerical
                                                                     technique, Fast marching method is adopted that tracks the
Pectoral Muscle Segmentation Using Gray Difference                   topological changes of boundaries and displays segmented
Weight and Fast Marching Method                                      binary image. The resultant image provided the pectoral
                                                                     muscle and some isolated areas from the breast region
Since the tissues present in the pectoral muscle and breast          (Fig. 3b, e). These areas are ignored using morphological
region are alike, to find abnormal tissues in the breast             erosion operation and provided segmented pectoral muscle
region, the pectoral muscles need to be removed. Trian-              (Fig. 3c, d).
gular pectoral muscles appear in the rightmost corner or
in the leftmost corner of the medio-lateral oblique (MLO)
views of the mammogram. The pectoral muscles present                 Segmentation of Breast Region Using Exclusive‑OR
in the right side are flipped to the left. To segment the            Operation
pectoral muscle, gray difference weight method adapted
computes weights for each pixel in the background image              To segment only breast region, the pectoral muscle seg-
wherein the reference gray-scale intensity value (repre-             mented image (P) and the skin–air boundary detected
sentative value) is the average of the pixel intensity values        image (S) undergo bitwise XOR operation. The resultant
of pixel locations that is specified by vectors of seed point.       image is set to maximum value if value P or S occurred,
This seed point is chosen empirically. The pixel weights             but not both. The segmented breast region is as shown in
are computed for every pixel that is the absolute value of           Fig. 4.

Fig. 2  Background suppressed images of MIAS (first row) and CBIS-   Fig. 3  Pectoral muscle segmented images of MIAS (first row) and
DDSM (second row), a, d are original images, b, e are background     CBIS-DDSM (second row), a, d are original background suppressed
suppressed image after gradient operation and c, f are background    images, b, e are gray difference weight images and c, f are segmented
suppressed image in original form                                    pectoral muscle images

SN Computer Science
SN Computer Science (2021) 2:63 Page 5 of 13 63
Fig. 4 Breast region segmented
image of MIAS (first row) and
CBIS-DDSM (second row), a,
e are background suppressed
image, b, f are pectoral muscle
segmented images, c, g are
breast region segmented images
after bitwise XOR operation
and d, h are breast region seg-
mented outputs in original form
Segmentation of Masses in Breast Region are assigned for pixels having large difference. The output
of gray difference image is as shown in Fig. 6b. Later,
Image Enhancement MSER detector is adopted to detect the masses in the
mammograms. MSER is a blob detection method that
Since the invisible abnormal tissues reside in the dense extracts various co-variant regions in an image. MSER
normal tissues, finding the masses in the breast region is a regions of an image are connected components wherein
challenging task. Hence, to improve the visibility, combina- local intensity remains stable for a large set of thresh-
tion of CLAHE and de-correlation stretching methods were old values. The MSER detector first sorts pixels based
used. The CLAHE is a modified adaptive histogram equali- on the intensity level, finds candidates for each intensity
zation (AHE) technique and both implements equalization level and determines the representative for each level.
except CLAHE uses contrast amplification limiting method Since the malignant masses are hidden inside the dense
that reduces the noise in the image. De-correlation stretch breast tissues, maximum intensity values are considered
enhances the regions in an image having intensity variations as suspicious regions. By the adoption of MSER detector,
to a wide range using band-band correlation. The pixels of only suspicious regions are detected. Finally, the sizes are
those regions are stretched to equalize the band variances. tracked and the growth rate is monitored for local mini-
The combination of both CLAHE and de-correlation stretch mums and displays the pixels belonging to MSER detector
methods yielded better visual interpretation with better fea- as output (Fig. 6c, d).
ture discrimination. The enhanced mammographic image is The aim of the proposed paper is to detect the masses
shown in Fig. 5. in the mammogram, but MSER detector adopted detects
suspicious region rather than mass. Hence, the algorithm
Suspicious Region and Mass Detection needs two iterations of image enhancement and MSER
detection. The suspicious region image is again passed
In the presented paper, to detect the masses present in through the enhancement using CLAHE, gray differ-
the breast region, gray difference weights are employed ence weight and MSER detector algorithms. This is per-
[11], wherein weights are computed for each pixel based formed to eliminate some more unwanted regions that
on intensity difference. Since the masses have the highest are present in the suspicious regions. The resultant mass
intensity value at its center and decreases outwards (i.e., detected image is as shown in Fig. 6f. The features are
towards boundary of mass), highest intensity value is cho- first extracted in breast region then in suspicious region to
sen as representative value. Larger weights are assigned maximize the accuracy and reliability.
for the pixels having small difference and smaller weights
SN Computer Science63 Page 6 of 13 SN Computer Science (2021) 2:63
Fig. 5 Enhanced images of
breast region of MIAS (first
row) and CBIS-DDSM (second
row), a, d are original breast
region segmented images, b, e
are CLAHE images and c, f are
de-correlation stretch images
images in MIAS datasets and 200 images in CBIS-DDSM
dataset. The CBIS-DDSM dataset provides both CC view
and MLO view images, including calcification and mass
images. There are 292 MLO view mass images in the data-
set. Hence we randomly selected 200 images that contain
mass for the validation of the proposed method.
A. Breast boundary segmentation in both MIAS and CBIS-
DDSM images
For the detection of masses in the mammogram, back-
ground suppression, pectoral muscle removal, segmenta-
tion of breast region and suspicious regions segmenta-
tion are to be accomplished in sequence. The algorithm
is then validated for its consistency and robustness on
two different datasets (MIAS and CBIS-DDSM). In
the first stage, proposed method is evaluated for breast
Fig. 6 Detection of masses in breast region, a is original image with region segmentation. Breast region is the area accom-
mass in breast region, b is image with ground truth on mass, c MSER
(I iteration), d MSER (II iteration), e detected mass and f detected plished after suppressing background region (skin–air
mass inside the ground truth ring boundary) and pectoral muscle. For performance evalu-
ation of breast region segmentation, breast region, back-
ground region and pectoral muscle regions are termed
Results as Br, Bg and Pm, respectively. Both the datasets con-
tain ground truths with respect to mass detection but,
To evaluate the proposed work, MIAS datasets and CBIS- ground truths for the segmentation of breast region are
DDSM datasets are considered. For breast region segmen- not available in the datasets. So, ground truths for seg-
tation, the experimentation is conducted on all the 322 mentation of breast regions are manually marked under
the guidance of expert radiologist and compared with
SN Computer ScienceSN Computer Science (2021) 2:63 Page 7 of 13 63
the obtained segmentation results. As per the radiolo- ground truths. Meanwhile, pectoral muscle segmenta-
gist suggestion, the results obtained are divided into tion and removal algorithms performed well for good-
well-segmented, under-segmented, over-segmented and quality images, i.e., the segmented boundary was along
mis-estimated images. Segmentation result that matches the ground truth. However, there are some problems in
the real boundary almost exactly are well-segmented few of images which had no significant contrast between
images, segmented result that are slightly lower than the the pectoral muscle and the breast region, more glandu-
real boundary considered as under-segmented images, lar images with shadowing effect, multilayered pectoral
segmented result that adds extra outside regions nearby muscle. The over- and under-segmented problems iden-
apart from the real boundary are over segmented images tified reflect minor segmentation errors. The proposed
and segmented result that mismatches to large extent are method could detect boundaries in all types of densities
considered as the mis-estimated images. for varied shape and size. In addition to this, selection
Figure 7 shows the original images marked with of seed point for varied sizes is a challenging issue. The
ground truths and the obtained segmented images. Fig- algorithm was experimented repeatedly on all the sizes
ure 7a–c shows examples of the well-segmented images, of densities and empirically chosen the seed point for
under-segmented images and over-segmented images. pectoral muscle segmentation. For simplicity, flipped
To describe about the images, the skin–air boundaries the right MLO view to the left MLO view and fixed
detected in all the test samples were almost similar to the the seed point for single MLO view. There were three
images in the dataset which do not have pectoral muscle
at all, hence those images are ignored from this level
of segmentation. The absolute gray difference threshold
maintained for the segmentation of pectoral muscle is 25
which could able to suppress all other intensity values
except pectoral muscle intensity values and the threshold
value remains same for both the datasets.
Besides MIAS dataset, the proposed segmentation
algorithm could be applied on CBIS-DDSM dataset
also. Both MIAS images and CBIS-DDSM images are
gray-scale images having same bit depth and resolution
with the only difference being their size. The segmenta-
tion methodology is same for both datasets, only change
is that the CBIS-DDSM images needs single iteration of
MSER detector for mass detection.
To evaluate the accuracy of segmentation, three met-
rics sensitivity (TPR), specificity (TNR), false-positive
rate (FPR) and correctness (PPV) were considered. The
metrics are defined as follows,
TP
Sensitivity = , (1)
TP + FN
TN
Specificity = , (2)
TN + FP
FP
False positive rate = , (3)
FP + TN
TP
Correctness = ,
TP + FP
TP + TN
Fig. 7 Examples of breast region segmentation outputs in which first Accuracy = . (5)
TP + FP + TN + FN
two rows are a samples of well-segmented images, third row is b
sample of under-segmented images and last row is c sample of over-
segmented images
SN Computer Science63 Page 8 of 13 SN Computer Science (2021) 2:63
For further evaluation, Jaccard index [31] and Dice side regions of the segmented images, respectively. The
similarity coefficients [32] were considered. For cal- over- and under-segmented errors caused by gray dif-
culating the similarity index, metrics are defined for ference weight and fast marching method resulted in
simplicity as follow, Ss for segmented output of the pro- imprecise detection of breast boundary. Besides, the
posed method and Sg for the ground truth image: dataset contains images which are extremely dense
breast density types and had poor visualization due to
|Ss ∩ Sg|
Jaccard = , (6) uneven intensity distributions at the borders of pecto-
|Ss ∪ Sg| ral muscle. These images are considered as more noisy
images and the algorithm mis-estimated those breast
|Ss ∪ Sg| regions with less accuracy. Though the accuracy is
Dice = 2 . (7)
|Ss| + |Sg| maximum (97.68%) in case of well-segmented images,
the decrease in accuracies of under-, over-segmented and
The experimental results are listed in Table 2 com- mis-estimated images dropped the overall accuracy to
paring segmented output obtained from the proposed 94.12%.
method with the ground truth of MIAS dataset. Besides, the method produced Jaccard similarity ratio
In terms of segmentation of breast region, sensitivity of 94.15% and dice = 96.99% which is slightly smaller
represents the ratio of number of true-positive pixels to than the accuracy metric considered. The reason is
the number of pixels in true breast regions; specificity that those two-similarity metrics are sensitive to shape
represents the ratio of number of true-negative pixels changes between ground truths and segmented output
to the number of pixels marked as non-breast region in than calculating overlapping area ratios. Jaccard indexes
the true background; false-positive rate represents the are low in all the cases than dice similarity as the union
ratio of number of false-positive pixels to the number of ground truth and the segmentation area were stable
of pixels marked as non-breast region in the true back- for different cases. Hence, proposed method is robust
ground; and correctness is the average portion of cor- to different quality of images with respect to dice coef-
rectly detected breast region pixels. ficient.
In Table 2, the average values of sensitivity, specific- Similarly, Table 3 depicts that the proposed method
ity, false-positive rates, correctness and accuracies are also resulted with accuracy of 90.38% on 200 images
displayed. In case of over- and under-segmented images, from CBIS-DDSM dataset, indicating the accuracy drop
the ground truth edges are located at the inside and out-
Table 2 Results for MIAS Well-segmented Under-segmented Over-segmented Misestimated Overall
dataset
Number of images 225 43 45 10 322
Sensitivity (%) 98.53 99.47 99.14 65.61 90.68
Specificity (%) 92.15 91.22 93.33 34.92 77.70
False-positive rate (%) 2.28 9.35 7.42 3.49 5.63
Correctness (%) 97.37 96.44 93.92 80.11 91.96
Accuracy (%) 97.68 94.11 94.64 90.28 94.12
Jaccard (%) 94.15 90.96 89.73 85.57 90.10
Dice (%) 96.99 93.02 92.31 88.57 92.72
Table 3 Results of CBIS- Well-segmented Under-segmented Over-segmented Mis-estimated Overall
DDSM dataset
Number of images 145 18 17 20 200
Sensitivity (%) 99.42 88.09 83.08 67.32 84.47
Specificity (%) 94.01 86.26 79.83 42.74 75.71
False-positive rate (%) 7.40 6.26 7.98 4.27 6.47
Correctness (%) 94.01 86.26 79.83 42.74 75.71
Accuracy (%) 94.88 90.92 89.95 85.80 90.38
Jaccard (%) 89.68 88.26 87.09 81.45 86.62
Dice (%) 92.86 83.63 82.68 87.94 86.77
SN Computer ScienceSN Computer Science (2021) 2:63 Page 9 of 13 63
compared to the other dataset. The reason is inconsist- compared with ground truths for location and boundary
ency in size and varied noises in CBIS-DDSM images. of mass.
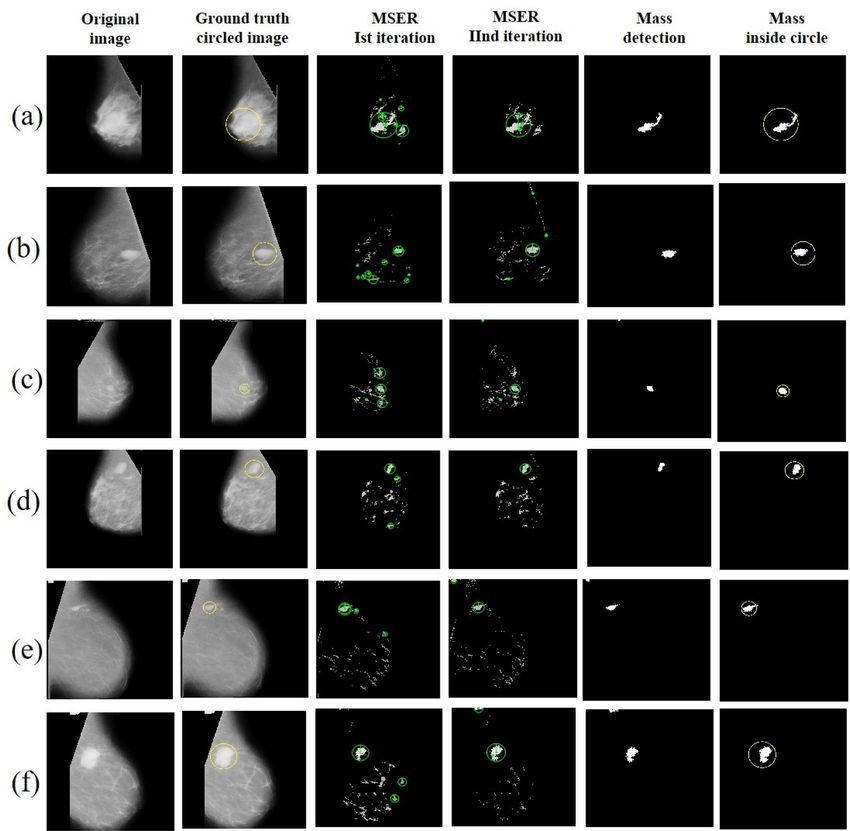
B. Mass detection for abnormality quantification Segmentation results depicted in Fig. 8 shows the
The other major focus in the present paper is on the mass detection outputs in MIAS dataset wherein, each
detection of masses based on gray difference weight row contains from left to right original image, ground
and MSER detector. For the validation of detection of truth circled image, MSER detector output at first itera-
masses in MIAS dataset, 85 images were used and in tion, MSER detector output at second iteration, mass
CBIS-DDSM dataset, 200 images were used. Ground detected image and mass located inside the circled
truths are provided in the dataset in the form of x, y co- image. The segmented output is inside the ring and
ordinates and radius in MIAS dataset. From the ground hence, it is the success of the proposed method. Figure 8
truth information, a ring is plotted over the image. includes segmented circumscribed, speculated and other
The algorithm is considered as successful only if, the ill-defined mass outputs obtained from the proposed
segmented image obtained from the proposed method method.
appeared inside the ground truth ring, In CBIS-DDSM The images shown in third column are obtained after
dataset, ground truth images are provided in the form of enhancement, gray difference weight and MSER detec-
binary images. For this dataset, the segmented image is tion (I iteration). The proposed method is tested on all
Fig. 8 Examples of mass detection in MIAS dataset
SN Computer Science63 Page 10 of 13 SN Computer Science (2021) 2:63 types of densities that includes fatty, glandular and dense racy after experimentation. Hence, to improve the effi- type. The contrast enhancement limits are empirically cacy, we resized the CBIS-DDSM images to 256 × 256. chosen as 0.05 which remains constant for all types of Whereas, the MIAS dataset images bear uniform size mammographic images. In addition to contrast enhance- and yielded best accuracy without undergoing resiz- ment, the tolerance value chosen for de-correlation ing. The proposed method is directly applied to CBIS- stretch is 0.01. Since masses have maximum intensity, DDSM images and is able to obtain good results. Only the representative value is also maximum and the abso- difference is that for CBIS-DDSM dataset, results in the lute gray-scale intensity difference threshold chosen for single iteration of MSER detector have been obtained. gray difference weight is 14 and it may vary from 10 Some of the images exhibited few unexpected extra to 20 for more noisy images (extremely dense breast regions. Those regions are eliminated by binarizing the density type images with poor visualization). The first image to specified level (0.7) and the binarization level iteration of MSER detector retains extra regions other varies from 0.7 to 0.85 for more noisy images. This than masses. Forth column represents the MSER detec- small change is due to the different imaging conditions tion of second iteration wherein it eliminates all other adopted while taking mammography. Contrast limits, regions except masses. Masses obtained from the pro- tolerance value and absolute gray difference threshold posed method are displayed in fifth column and the sixth maintained are 0.5, 0.01 and 25, respectively. column shows masses encircled with the ground truth The MIAS dataset contains the ground truth in the information provided in the dataset. form of radius and coordinate points. Hence, circle is Figure 9 shows the results obtained for CBIS-DDSM plotted using ground truth on the original images and dataset wherein first and second images of each figure the validation of the algorithm is performed based on are original image and ground truth marked on origi- whether the output mass obtained from the proposed nal image, respectively. Third image is obtained after method exists inside the circle or not. Table 3 is tabu- applying enhancement and gray difference weight. Forth lated making use of Eq. (8). CBIS-DDSM dataset con- image is the MSER detected image and the last image is tains ground truths that are provided in the form of the mass detected image. binary mass region and square shaped original patch Since CBIS-DDSM dataset has images in various region. Hence, the proposed method evaluated this sizes, the images are normalized. First, the images are dataset similar to MIAS dataset and also measured per- resized to 1024 × 1024 and noticed the drop in accu- Fig. 9 Sample images of mass detection in CBIS-DDSM dataset SN Computer Science
SN Computer Science (2021) 2:63                                                                                     Page 11 of 13 63

Table 4  Experimental results on detection of masses                   	  Though the difference between centroids of the
Dataset      Number Number Number          Detected      Accuracy        ground truth mass and the obtained mass is less, focus
used         of images of masses of masses masses        %               is needed to identify some missing areas at the bound-
                                 unlisted  listed                        ary of the detected masses. Hence along with the overall
                                           (true                         detection accuracy, we have experimented to validate
                                           positive)
                                                                         the boundaries of the detected masses in multiple ways
MIAS          85          85         2           83      97.64           to provide evidence of the consistency of the proposed
CBIS-        200         200         8          192      94.66           method. The segmentation results were evaluated for
 DDSM                                                                    CBIS-DDSM dataset for detected mass considering sen-
                                                                         sitivity, specificity and accuracy as parameters using the
                                                                         Eqs. (1), (2) and (5). From the table, we can notice that
                                                                         accuracy of the segmentation of mass is slightly lower
Table 5  Experimental results on segmentation of masses in CBIS-
                                                                         than the overall detection accuracy of mass and they are
DDSM dataset
                                                                         independent of each other.
Number of       Sensitivity    Specificity    Accuracy   Dice          	  In Table 4, segmentation results for masses are dis-
images          (%)            (%)            (%)        coefficient
                                                         (%)
                                                                         played for CBIS-DDSM dataset. Nevertheless, for MIAS
                                                                         dataset, detection accuracy is computed and segmenta-
200             91.21          90.27          94.32      91.46           tion accuracy for mass detection is not computed. The
                                                                         reason is, the dataset contains radius and coordinate
                                                                         points of the mass which is a ground truth for detection
  formance using sensitivity, specificity, precision and                 of mass, and it does not contain ground truth in terms of
  accuracy parameters (Tables 4, 5).                                     segmentation of mass. The average sensitivity, specific-
	  The position of every mass detected undergo a com-                    ity, accuracy and dice similarity coefficient obtained for
  parison with its corresponding ground truth. The loca-                 CBIS-DDSM dataset from the proposed method were
  tion of the interested point (x1, y1) of the detected image            about 91.21, 90.27, 94.32 and 91.46%, respectively.
  is compared with the centroid of its respective ground                 Thus, the results listed depict that the proposed method
  truth (x2, y2) by taking the difference among them (Dx                 yields best sensitivity and specificity outputs achieving
  and Dy). The differences are calculated using equation                 accuracy of about 94.32%. The proposed method could
  shown below:                                                           help the radiologist in identifying cancer masses more
                                                                         accurately.
      Dx = ||x1 − x2 ||, Dy = ||y1 − y2 ||.                      (8)

	  If the difference value is ≤ factor of 10, then the points
  are very much closer to each other. Based on this we
  have calculated the accuracy using the Eq. (9):                      Discussion
                      Number of correctly detected images
      Accuracy =                                          . (9)        Comparing with the state-of-the-art methods, the proposed
                          Total number of images
                                                                       work executes multiple tasks to obtain good performance
	  For both the datasets, the detection accuracy obtained              in every step that highlights the different morphological
  is determined considering the total number of true-                  characteristics of hidden objects for detection of masses. A
  positives cases to the total number of cases involved.               straight comparison with existing work is difficult as some
  As shown in Table 3, in MIAS dataset, 85 images were                 of them considered partial dataset cases, eliminating certain
  used for experimentation. Among them 83 masses were                  images. However, we have provided few of existing ones of
  detected and shown exact locations as specified in the               the same kind.
  ground truth. Meanwhile, two masses were not detected                   Comparison on segmentation of breast region: compar-
  that are marked in the dataset. In CBIS-DDSM dataset,                isons with few of the existing studies comprises of most
  200 images were considered and the proposed method                   common methods on the detection of masses are shown in
  was able to detect 192 images with exact locations as                Table 6.
  given in dataset but failed to detect eight mass images.                In comparison with the state-of-the-art methods, the
  The accuracy obtained for CBIS-DDSM dataset is quite                 accuracies of detection of breast masses from both MIAS
  lower than that of MIAS dataset. The reason is because               and DDSM dataset are listed in Table 6. Summarizing per-
  of the varied quality of examination, and noise added                formances of representative methods from the literature, the
  due to different imaging conditions.                                 method adopted in the proposed work achieved maximum

                                                                                                            SN Computer Science
63 Page 12 of 13 SN Computer Science (2021) 2:63
Table 6 Comparative study on Detection approach Author Dataset Accuracy %
detection of masses for MIAS
dataset Gray difference weight and MSER detector Proposed method MIAS 97.64
DDSM 94.66
Threshold-based segmentation Makandar et al. [15] MIAS 94.5
Meta-heuristic algorithm electromagnetism-like Soulami et al. [18] MIAS 78.57
optimization DDSM 91.07
Dual stage adaptive thresholding (DuSAT) Anitha et al. [19] MIAS 93.5
DDSM 92.5
Gestalt psychology Wang et al. [20] MIAS 92
DDSM 93.84
Quad tree decomposition Divyashree et al. [27] DDSM 90
accuracy in case of MIAS dataset and quite less accuracy the robustness of the algorithm could be tested with other
in case of DDSM dataset. Slightly lower accuracies are standard datasets available. The work can also be extended
obtained in case of DDSM dataset due to more noisy images to detect other abnormalities in mammography.
compared to MIAS dataset. These results on detection of
masses provide solid foundation to focus on the masses
listed for further analysis.
Conclusion
In the analysis of mammographic image, segmentation of
Future Scope breast region and detection of masses are important steps
to be accomplished for proper diagnosis of breast cancer.
Breast region segmentation is the crucial step in the mam-
In this paper, background suppression, pectoral muscle
mographic study, which defines the boundaries of the breast
removal, breast region extraction and enhancement fol-
for further quantifications. The segmentation of breast
lowed by detection of mass are performed to analyze mam-
region is performed using gray difference weight and fast
mograms. Gradient weight map is utilized for background
marching method. But, segmentation errors in segmenting
suppression, pectoral muscle boundary is identified and
breast region could be further reduced. Because, accurate
removed to obtain breast region alone using gray difference
segmentation of breast region avoids missing of abnormal
weight and fast marching method. Later, the breast region is
tissues particularly localized at the boundary regions. The
enhanced using CLAHE and de-correlation stretch. Gray dif-
visualization of the breast region in mammographic image
ference weight and MSER detectors are employed to detect
can be performed still better to distinguish tissues in more
the mass. The experimental results proved that the method
noisy images.
proposed produced comparable results as per the ground
The breast imaging reporting and data system (BI-RADS)
truth provided in the dataset for segmentation of breast
[33] defines indicators such as calcifications, glandular den-
region and mass detection and achieved higher accuracies.
sity and particular masses that have been proved symptom
The algorithm is tested on MIAS and CBIS-DDSM dataset
for breast cancer [34, 35]. The features characterizing indi-
for its efficiency.
cators, as derived from segmentation and mass detection
results, may conduct primary screening for radiologists to Acknowledgements The authors would like to thank Dr. Deepashree
save manpower. Basavalingu, Consultant Radiologist, Blackpool Teaching Hospitals,
The detection of mass is achieved using gray difference NHS Foundation Trust, United Kingdom for her certification of ground
truths, valuable help and comments in carrying out this work. The first
weight and MSER detector in which the method achieved
author would like to thank the Ministry of Tribal Affairs, Govern-
high accuracy. In future, the improvements could focus on ment of India for awarding the National Fellowship (201718-NFST-
enriching the detection rate of mass as the proposed method KAR-00159) to carry out this research work.
failed to detect masses in some cases. Especially in case
of CBIS-DDSM dataset, the detection rate could be further Funding The first author would like to thank the Ministry of Tribal
Affairs, Government of India for awarding the National Fellowship
improved. The detected masses in some of the images were
(201718-NFST-KAR-00159) to carry out this research work.
under-segmented and correct masses were not identified in
some extremely dense breasts regions. To deal such images
Compliance with Ethical Standards
and to improve the performances, in future, along with the
CLAHE technique, technique that further amplifies the noisy Conflict of Interest Corresponding author declares that no conflict of
data can be inculcated as a post processing method. Later, interest.
SN Computer ScienceSN Computer Science (2021) 2:63 Page 13 of 13 63
Ethical Approval This article does not contain any studies with human 19. Anitha J, Dinesh Peter J, Immanuel APS. A dual stage adaptive
participants or animals performed by any of the authors. thresholding (DuSAT) for automatic mass detection in mammo-
grams. Comput Methods Programs Biomed. 2017;138:93–104.
20. Wang H, Feng J, Qirong B, et al. Breast mass detection in digital
mammogram based on gestalt psychology. J Healthc Eng. 2018.
References https://doi.org/10.1155/2018/4015613.
21. Geraldo J, Rocha S, Almeida J, Paiva A, Silva A, Gattass M.
Breast cancer detection in mammography using spatial diversity,
1. DeSantis C, Ma J, Bryan L, et al. Breast cancer statistics, 2013.
geostatistics, and concave geometry. Multimedia Tools Appl.
CA Cancer J Clin. 2014;64(1):52–62.
2019;78:13005–031. https://doi.org/10.1007/s11042-018-6259-z.
2. Oeffinger KC, Fontham ETH, Etzioni R, et al. Breast cancer
22. Agarwal R, Díaz O, Yap MH, Lladó X, Martí R. Deep learning
screening for women at average risk: 2015 guideline update from
for mass detection in full field digital mammograms. Comput Biol
the American Cancer Society. JAMA. 2015;314(15):1599–614.
Med. 2020. https://doi.org/10.1016/j.compbiomed.2020.103774.
3. Jalalian A, Mashohor SBT, Mahmud HR, et al. Computer-aided
23. Suresh R, Nagaraja Rao A, Eswara Reddy B. Detection and clas-
detection/diagnosis of breast cancer in mammography and ultra-
sification of normal and abnormal patterns in mammograms using
sound: a review. Clin Imaging. 2013;37(3):420–6.
deep neural network. Concurr Comput Pract Exp. 2019. https://
4. Chen B, Ning R. Cone-beam volume CT breast imaging: feasibil-
doi.org/10.1002/cpe.5293.
ity study. Med Phys. 2002;29(5):755–70.
24. Zeiser FA, da Costa CA, Zonta T, Marques NMC, Roehe AV,
5. Mann RM, Kuhl CK, Kinkel K, et al. Breast MRI: guidelines
Moreno M, da Rosa Righi R. Segmentation of masses on mammo-
from the European Society of Breast Imaging. Eur Radiol.
grams using data augmentation and deep learning. J Dig Imaging.
2008;18(7):1307–18.
2020;33(4):858–68. https: //doi.org/10.1007/s10278 -020-00330- 4.
6. Olsen O, Gøtzsche PC. Cochrane review on screening for breast
25. Vikhe PS, Thool VR. Mass detection in mammographic images
cancer with mammography. Lancet. 2001;358(9290):1340–2.
using wavelet processing and adaptive threshold technique. J Med
7. Johns PC, Yaffe MJ. X-ray characterisation of normal and neo-
Syst. 2016;40(4):82.
plastic breast tissues. Phys Med Biol. 1987;32(6):675–95.
26. Divyashree BV, Soujanya MR, Keerthana M, Naveen M, Heman-
8. Mustra M, Grgic M, Rangayyan RM. Review of recent advances
tha Kumar G. Segmentation and classification of mammogram
in segmentation of the breast boundary and the pectoral muscle
into normal and abnormal using texture features. Int J Recent
in mammograms. Med Biol Eng Comput. 2016;54(7):1003–24.
Technol Eng. 2020. https://doi.org/10.35940/ijrte.A1964.059120.
9. Dromain C, Boyer B, Ferre R, et al. Computed-aided diag-
27. Divyashree BV, Amarnath R, Naveen M, Hemantha Kumar G.
nosis (CAD) in the detection of breast cancer. Eur J Radiol.
Novel approach to locate region of interest in mammograms for
2013;82(3):417–23.
Breast cancer. J Intell Syst Appl Eng. 2018;6(3):185–90. https://
10. Oliver A, Freixenet J, Marti J, et al. A review of automatic mass
doi.org/10.18201/ijisae.2018644775.
detection and segmentation in mammograic images. Med Image
28. Suckling J, Parker J, Dance DR, Astley S, Hutt I, Boggis CRM,
Anal. 2010;14(2):87–110.
Ricketts I, Stmatakis E, Cernaez N, Kok SL, Taylor P, Betal D,
11. Gonzalez RC, Woods RE, Eddins SL. Digital image processing
Savage J. The mammographic image analysis society digital mam-
using MATLAB: and mathworks, MATLAB Sim SV 07. Gates-
mogram database. In: Proceedings of the 2nd international work-
mark Publishing; 2009.
shop on digital mammography; 1994. pp. 375–378.
12. Chen Z, Zwiggelaar R. A combined method for automatic iden-
29. Lee RS, Gimenez F, Hoogi A, Rubin D. Curated Breast Imaging
tification of the breast boundary in mammograms. In: 5th Inter-
Subset of DDSM [Dataset]. The Cancer Imaging Archive. 2016.
national conference on biomedical engineering and informatics
https://doi.org/10.7937/K9/TCIA.2016.7O02S9CY.
(BMEI), IEEE; 2012. pp. 121–125.
30. Divyashree BV, Hemantha Kumar G. Segmentation and enhance-
13. Rampun A, Morrow PJ, Scotney BW, et al. Fully automated breast
ment of mammograms for the detection of cancer using Gradient
boundary and pectoral muscle segmentation in mammograms.
weight map and de correlation stretch. NCVPRIPG. Accepted for
Artif Intell Med. 2017;79:28–41.
publication 2020. (In Press).
14. Shi P, Zhong J, Rampun A, Wang H. A hierarchical pipeline
31. Tan PN, Steinbach M, Kumar V. Introduction to data mining. 1st
for breast boundary segmentation and calcification detection in
ed. Boston: Addison-Wesley Longman Publishing Co., Inc.; 2005.
mammograms. Comput Biol Med. 2018. https: //doi.org/10.1016/j.
32. Dice LR. Measures of the amount of ecologic association between
compbiomed.2018.03.011.
species. Ecology. 1945;26(3):297–302.
15. Makandar A, Halalli B. Threshold based segmentation tech-
33. Magny SJ, Shikhman R, Keppke AL. Breast imaging reporting
nique for mass detection in mammography. J Comput.
and data system. StatPearls publishing; 2020. https://www.ncbi.
2016;11(6):472–8.
nlm.nih.gov/books/NBK459169/.
16. Rahmati P, Adler A, Hamarneh G. Mammography segmenta-
34. Boyd NF, Guo H, Martin LJ, et al. Mammographic density
tion with maximum likelihood active contours. Med Image Anal.
and the risk and detection of breast cancer. N Engl J Med.
2012;16:1167–86.
2007;356(3):227–36.
17. Neto OPS, Silva AC, Paiva AC, Gattass M. Automatic mass
35. Vachon CM, Van Gils CH, Sellers TA, et al. Mammographic den-
detection in mammography images using particle swarm opti-
sity, breast cancer risk and risk prediction. Breast Cancer Res.
mization and functional diversity indexes. Multimed Tools Appl.
2007;9(6):217–26.
2017;76(18):19263–89.
18. Soulami KB, Saidi MN, Honnit B, Anibou C, Tamtaoui A.
Publisher’s Note Springer Nature remains neutral with regard to
Detection of breast abnormalities in digital mammograms
jurisdictional claims in published maps and institutional affiliations.
using the electromagnetism like algorithm. Multimedia Tools
Appl. 2019;78(10):12835–63. https: //doi.org/10.1007/s1104
2-018-5934-4.
SN Computer ScienceYou can also read