Destination decision making in tourism regions on Australia's east coast
←
→
Page content transcription
If your browser does not render page correctly, please read the page content below
Please do not remove this page

Destination decision making in tourism regions on
Australia's east coast
Fuller, Don; Wilde, Simon J; Hanlan, Janet; et al.
https://researchportal.scu.edu.au/discovery/delivery/61SCU_INST:ResearchRepository/1267029230002368?l#1367456070002368

Wilde, S. J., Hanlan, J., Mason, S., & Fuller, D. (2007). Destination decision making in tourism regions on
Australia’s east coast.
https://researchportal.scu.edu.au/discovery/fulldisplay/alma991012821142002368/61SCU_INST:ResearchRepo
sitory

Southern Cross University Research Portal:
https://researchportal.scu.edu.au/discovery/search?vid=61SCU_INST:ResearchRepository
ResearchPortal@scu.edu.au
Open
Downloaded On 2021/02/01 15:48:46 +1100

Please do not remove this page
Destination Decision Making in Tourism Regions on Australia’s East Coast

Don Fuller, Simon Wilde*, Janet Hanlan and Stephen Mason
*Corresponding author

Don Fuller
Adjunct Associate Professor
Flinders University Business School, Adelaide, Australia.
E-mail: dfu66685@bigpond.net.au

Simon Wilde
PhD Candidate
Australian Regional Tourism Research Centre
Coffs Harbour Campus, Southern Cross University, Australia.
Ph: +61 2 6659 3656, Fax: +61 2 6659 3144, E-mail: simon.wilde@scu.edu.au

Janet Hanlan
Marketing Manager
Faculty of Arts & Sciences
Coffs Harbour Campus, Southern Cross University, Australia.
Ph: +61 2 6659 3063, Fax: +61 2 6659 3051, E-mail: janet.hanlan@scu.edu.au

Stephen Mason
Lecturer
School of Commerce and Management
Coffs Harbour Campus, Southern Cross University, Australia.
Ph: +61 2 6659 3195, Fax: +61 2 6659 3144, E-mail: stephen.mason@scu.edu.au

Flinders Business School Research Paper Series

07-07

ISSN 1441-3906
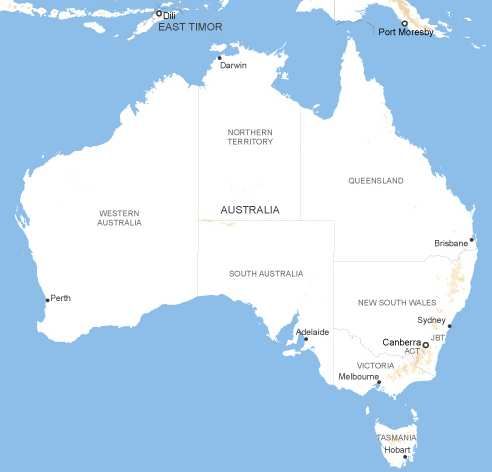
Destination Decision Making in Tourism Regions on Australia’s East Coast

It is important to better understand the main drivers affecting the choice and later
evaluation of a tourism destination by consumers. The experience usually involves
the consumption of both products and services requiring a relatively high level of
expenditure. More recently, studies have begun to investigate satisfaction levels
relating to the quality of particular experiences by tourists visiting a destination.
Within this context, the case study presented in this paper aims to investigate the
motivation, behaviour and satisfaction levels of tourists to the Coffs Coast
Tourism Region, located on the East Coast of Australia, within the State of New
South Wales. The findings presented here should assist the development of
strategies by planners aimed at better recognising and responding to changing
demand patterns among potential visitors to important tourism regions such as that
represented by the Coffs Coast Tourism Region.

Keywords: Destination choice, destination marketing strategies, destination
development.

INTRODUCTION

The Coffs Coast Tourism Region is visited by an estimated one million tourists
per annum. The Coffs Coast consists of three local government areas. They are the
City of Coffs Harbour, the Shire of Nambucca and the Shire of Bellingen. The
region is 550 kilometres north of the city of Sydney, the capital of New South
Wales and 430 kilometres, south of Brisbane, the capital city of the state of
Queensland. The coastal destinations of Coffs Harbour and Nambucca are
characterised by a mild, pleasurable climate with spectacular beaches and coastal
scenery. Bellingen is an attractive rural area, with scenic vegetation, surrounding
wooded, sub-tropical ranges and meandering rivers flowing from the Dorrigo
World Heritage Area to the Pacific Ocean. Figure 1 shows the location of the
Coffs Coast on the East Coast of Australia.

Throughout the period January 1998 to December 2001, the State of NSW as a
whole, experienced stable domestic tourist visitation while the North Coast
Region of the State experienced declines of over five percent (ATS Group 2004, p.
19). The decline has been recorded principally in the holiday/leisure market (ATS
Group 2004, p. 19), and is attributed to a change in the travel behaviour of
regional tourists. The report identifies two broad market segments visiting the
region. These two segments reflect different travel motivations. The report
describes the first of these segments as:
Figure 1
 LOCATION OF THE COFFS COAST (EAST COAST OF AUSTRALIA)

                                                                              Coffs
                                                                              Coast

                                                                  Map Inset

1. The destination specific tourist – This broad segment comprises the dominant
market segment for the region that frequently returns each year. These visitors
rarely change their destination and participate in traditional coastal activities, such
as visiting beaches, that centre on their accommodation base (ATS Group 2004, p.
2).

The second segment identified in the ATS Group report has been described as:

2. The regional traveller – This segment includes the in-transit traveller who
tends to stay for short periods on their journey to another destination; and the
experiential traveller, described as those travellers seeking a diversity of
experiences within the region. They are referred to as experiential travellers due
their ‘underlying desire to experience and interact with the region’s natural,
cultural and social values’ (ATS Group 2004, p. 2-3). High yield niche markets, or
defined market segments which yield higher than average returns from tourists,
were identified within the experiential traveller segment. Such markets include
backpackers, eco-tourism and food and wine and cultural heritage travellers.

The Tourism Plan Report (ATS Group 2004) argues that recent urban
development in the North Coast region of NSW, a lack of destination
differentiation, and changes in the benefits visitors seek from the travel experience,
have combined to lead to a decline in the traditional destination specific tourist
segment. These travellers have traditionally been the core market for the North
Coast NSW region and for important components of this larger region, such as the
Coffs Coast.
Principally due to such findings, the aim of this research was to undertake an
investigation into the recent behaviour and motivation of travellers to the Coffs
Coast region of NSW. As most tourism service purchases are considered to be
high-involvement, extensive decision-making purchases, destinations invest a
significant amount of resources, both monetary and non-monetary, in targeting
visitors and segments of the tourism market. The findings of this paper may assist
in the development of both a local and regional marketing strategy that recognises
changing demand patterns by visitors in choosing a destination such as the Coffs
Coast region on the East Coast of Australia. As a result, the research aims to assist
product development and destination promotional activities and to better
harmonise these activities with market demand.
Specific aims of the project were to identify:
1. the characteristics of tourism visitors to the Coffs Coast Region.
2. information sources used for trip planning.
3. mode of transport used to travel to the Coffs Coast Region.
4. main reason for visiting the Coffs Coast Region and the level of
satisfaction experienced,
5. the built and natural attractions tourists were most likely to visit and levels
of satisfaction experienced, and
6. an estimate of daily expenditure within the region by tourists according to
main categories.
The need to conduct future research outside the Coffs Coast region to establish the
characteristic and motivations of potential travellers who do not currently visit the
region is recognised as a limitation of the current study. This paper commences
with a discussion of relevant literature relating to destination decision-making.
The following sections discuss the methods used to collect information from
visitors to the region and present the results of the study. The final section
discusses the implications of these findings for regional destination planning and
marketing in the context of tourism destinations on the East Coast of Australia.
LEISURE TRAVEL DESTINATION DECISION PROCESSES – A
REVIEW OF RELEVANT MODELS
A range of theoretical models have been advanced in the academic literature to
explain the destination decision process (Chon 1990; Woodside and Lysonski1989; Gunn 1989; Clawson and Knetch 1966). It has been widely argued by researchers concerned with such a purchasing decision, that the consumer’s decision to purchase is a multi-staged process (Chon 1990; Woodside and Lysonski 1989; Mayo and Jarvis 1981; Hunt 1975; Gunn 1972; Clawson and Knetch 1966). Consumer Decision Making – Traditional Processes Kotler (1998) for example, identifies that when involved in a purchase decision, the consumer transits the stages of (1) need recognition, (2) information search, (3) evaluation of alternatives, (4) choice of product or service and (5) post-purchase evaluation. Not every purchase transits each step of the model. However, a key advantage of this model is that it recognises that the buying decision process is likely to commence long before actual purchase and continue after purchase has occurred, signalling that marketers need to focus on the entire buying process rather than just on the purchase decision (Kotler 1998). Following on from need recognition, information search is the stage in the process where the consumer is aroused to search for more information. This state may encourage the consumer to go in active search of information or may heighten their attention to relevant information sources, including advertising. It is important marketers understand the sources from which customers draw their information if they are to influence the decision process (Gartner 1993). Once sufficient information is gathered, the consumer moves to the evaluation of alternative solutions to their needs. The evaluation process is complex and will vary according to the buying situation. However, in general terms, the consumer will examine the attributes of the product, assign different levels of importance to such attributes, determine the likely level of overall satisfaction with each alternative and derive an attitude toward the different solutions/brands. Marketers need to better understand how their customers evaluate alternatives so they may take steps to influence the outcome. A strategic planning and management approach can provide a valuable systematic framework to assist this process by better identifying the need to alter the attributes of the product, or better inform customers of the benefits of certain attributes of a certain destination. In the evaluation stage, consumers rank brands and form purchase intentions. Generally, the consumer’s decision will be to purchase the preferred brand/solution but two factors can come between the purchase intention and the purchase decision. The first factor is the attitude of key people and relationships that may influence the purchase decision, for example family members. Marketers must therefore be aware of those who influence the buying decision. They may decide to use targeted communication to influence their buying attitudes, as well as those of the purchaser. The second is unexpected situational factors. In such situations, the potential purchaser may find some element of the marketing mix
which does not meet their expectation, such as discovering a price increase or
finding the standard and type of service received at a particular distribution outlet
to be unsatisfactory (Kotler 1998).
The decision process is not complete when the sale has been made as the
consumer may experience varying degrees of satisfaction with the outcome. The
consumer can therefore be expected to engage in a form of post-purchase
evaluation. The relationship between consumer expectations and their perception
of product performance will determine their satisfaction level. Creating satisfied
customers is essential as this both assists in customer retention and can lead to
new business through satisfied customers becoming advocates for the product.
Firms therefore need to monitor both customer expectations and their satisfaction
levels (Lovelock, Patterson and Walker 2001).

Researchers in the tourism and recreation area concerned with the travel purchase
decision have made similar observations to that of researchers investigating
consumption decisions. The decision to travel has been recognised as multi-
phased rather than a single step process (Chon 1990; Gunn 1989; Clawson and
Knetch 1966).

Clawson and Knetch’s Model of Recreational Behaviour

Clawson and Knetch (1966) identified a five-phased process in their recreational
behaviour model. These phases were (1) Anticipation: planning and thinking
about the trip, (2) Travel to the site: getting to the destination, (3) On-site
behaviour: behaviour at the site or destination region, (4) Return travel: travelling
home and (5) Recollection: recall, reflection and memory of the trip.

The anticipation stage in this travel decision process incorporates the activities
undertaken prior to travel, including need recognition and information search.
Travelling to the site could involve a range of experiences and service encounters
depending on the mode of transport. In some travel situations travel to and from
the site may be a major part of the travel experience as in the case of long haul
international travel or luxury train journeys. Behaviour on the site incorporates the
actual travel experience and is influenced by a wide number of service providers
including the accommodation facility, recreation outlets, retail services and
interaction with other travellers. Recollection and recall of the trip includes the
post-purchase evaluation phase. This will have a major impact on the next
purchase decision (Clawson and Knetch 1966).

Gunn’s Model of Leisure Travel

The work of Gunn (1989), identified a seven stage process in the leisure travel
experience:
1.   Accumulation of mental images about vacation experiences.
    2.   Modification of those images by further information.
    3.   Decision to take a vacation trip.
    4.   Travel to the destination.
    5.   Participation at the destination.
    6.   Return travel.
    7.   New accumulation of images based on the experience.

Gunn made explicit reference to changes in destination image as the consumer
moves through the seven stages of the leisure travel experience. The process
begins with the accumulation of destination images from a wide variety of sources
that are then modified as a result of extended information search. These images
are again altered during the post-purchase evaluation of the travel experience,
implying the concept of continually evolving destination image. This observation
supports the work of Hunt (1975) and Mayo and Jarvis (1981), who argue that a
traveller’s choice of destination is subjective and multi-faceted. While there are
many factors involved in the decision making process, the most important is based
on the image projected by a set of alternatives and the perceived ability of that
image to most closely satisfy the travellers’ needs (Mayo and Jarvis 1981).

The travel process models emphasise the need for direct experience to evaluate the
tourism product. There is an emphasis on actual service consumption, including
travel to and from the destination along with actual on-site behaviour. Another
key difference with more general consumer purchase decision models is that the
travel process models omit the ‘evaluation of alternatives phase’ from their
framework. This omission has the potential of reducing the importance of
competition between tourism destinations for a limited number of available
consumers. As competition for tourism visitation between destinations increases it
becomes more challenging for destination marketers to differentiate themselves
adequately within the marketplace. Because of this, it is argued by the authors of
this paper that increased attention needs to be paid to the way in which potential
visitors evaluate destination alternatives. This is supported by the work of Ritchie
and Crouch (2000) and Hankinson (2001).

Arguably, the psychology and behaviour of tourists when choosing, consuming
and later evaluating their destination experiences, represents one of the most
complex fields of consumer behaviour research. Consumers are usually highly
involved in the selection of a tourism destination, it is usually a relatively
expensive decision, it may be risky and is often highly self-expressive. There are
also significant differences between brands (destinations) requiring significant
information gathering, and consumers may hold strong beliefs or attitudes about
different destinations (Van Raaij and Crotts 1994, Crouch 1996). Beside
destination choice, research relating to the factors and processes that influence the
image and attractiveness of a destination has received considerable research attention (for example, Echtner and Ritchie 1991 and 1993, Dann 1996, Selby and Morgan 1996, Lubbe 1998, Walmsley and Young 1998). In addition, studies have investigated the destination experience, including dimensions of quality and factors leading to satisfaction/dissatisfaction (Otto and Ritchie 1996, Hudson and Shepherd 1998, Sheppard et.al. 1998, Tribe and Snaith 1998). The destination product is an experience comprising an array of commercial tourism services (e.g. accommodation, commercial attractions, events, car rentals, restaurants, tours, for example). However, non-commercial experiences (for example, a cityscape, forest, beach, wildlife, local residents) are also important. The destination product therefore, is complex and not subject to the degree of control and management often available for other products. There has been little evident effort in research to date to study the destination product covering the range of attributes discussed in this paper. Studies have tended to selectively address certain product elements in isolation (Crouch 2000, p. 69). To this end, there are important limitations evident in existing models of destination choice. Thus, recent conceptual research has proposed a more comprehensive approach that investigates attributes associated with industry level competitiveness to more conventional destination attributes, such as physiography, activities that can be undertaken and the available tourism experiences (Enright and Newton 2005). Such aspects are increasingly being seen as a major influence on the performance of tourism destinations in competitive world markets. This has been an area receiving increased attention from researchers interested in tourism (for example, Chon and Mayer 1995, Crouch and Ritchie 1999, Hassan 2000). Ritchie and Crouch (2000:6) argue that destination competitiveness has “tremendous ramifications for the tourism industry and is therefore of considerable interest to practitioners and policy makers”. The work of Crouch and Ritchie (1999) extends research focused mainly on the attributes that are seen to attract visitors such as climate, scenery and accommodation (see for example, Gallarza, Saura and Garcia 2002) to investigate factors that may affect the competitiveness of firms that supply tourism products and services at a destination. This paper investigates the activities and experiences undertaken by visitors to the Coffs Coast Region. However, the research presented here is also interested to identify indicators of satisfaction associated with activities undertaken and business services received, as well as estimates of expenditure on various business categories within the region. To this end, the research presented here, investigates factors important to business performance and competitiveness within a tourism destination.
METHODOLOGY

Personal interviews were conducted with 131 visitors at tourist locations including
visitor attractions, hospitality establishments, transportation hubs, and visitor
information centres within the Coffs Coast region during the final week of January,
2005. Purposive sampling of visitors at such locations ensured that field staff were
able to survey a reasonable sample of visitors, in a cost-effective manner.
Purposive sampling, often referred to as judgemental sampling, groups
participants according to preselected criteria relevant to a particular research
question, and involves the researcher making a decision about which study units
will be included in the study (Jennings 2001). Such sampling techniques are
appropriate in selecting 'unique cases that are especially informative’ (Neuman
1994, p. 198). The period during which the survey was conducted is an important
holiday time in Australia. The authors recognise that this timing presupposes that
most respondents are therefore on holidays, and this can be expected to influence
the nature of visitors to the region.

The sample size of 131 respondents is a relatively small number of overall visitors
to the region. The annual estimated number of visitors to the region in 2003 was 1
million (Bureau of Tourism Research 2003). A key aim of survey development
was to provide a more comprehensive framework for future surveys and tourism
projects. It is important that the findings of this initial study be used to generate
further, more frequent research in the field of tourism within regions such as the
Coffs Coast Tourism Region. Such frequency will enable key tourism
stakeholders to develop a more informed understanding of the tourism market in
the region, paying particular attention to the effects of seasonal influences upon
tourism flows.

Twenty-four questions were asked of each respondent. Data obtained through the
survey instrument included the location where the survey was undertaken;
duration of visit; information sources utilised in trip planning; mode of transport;
average daily expenditure according to main categories; reason for visitation;
satisfaction levels achieved at key built and natural attractions within the region,
and overall satisfaction levels of the visit. Likert scales were used to measure a
number of variables. For example, when asked ‘to what extent did you make use
of the following information sources to plan your trip to the Coffs Coast Region?’,
a 5-point Likert scale was developed, anchored by 1 representing ‘Extensively’,
with 5 indicating a response of ‘Not at all’. Prior to the survey, a pilot of ten
respondents was undertaken to confirm the clarity and validity of the questions.
Minor modifications to some questions were undertaken as a result of this pilot
survey. A copy of the survey instrument is available from the Centre for
Enterprise Development and Research (2005). Survey interviewers underwent
extensive training, which ensured consistent delivery of the survey instrument.
Supervisory staff closely monitored field workers and provided feedback where
required, throughout the survey period.
SURVEY RESULTS

The majority of visitors to the Coffs Coast region where found to be families with
children aged 13 years or under (30.9%) with parents aged between 25 and 44
years (33.3%). This information is important for the marketing of the Coffs Coast
region as it indicates the region is currently attracting holidaying families. Table 1
shows the information sources used by visitors to plan their trip to the Coffs Coast
region. It can be seen from Table 1 that the Internet is now a key tool used by
visitors planning a holiday. The majority of visitors to the region (64.3%) used the
Internet to plan some aspect of their holiday. Continuing to have appropriate,
accessible and user-friendly tourism web sites for the marketing of the destination
would therefore seem important. The next highest source of information was
‘family and friends’. This implies that favourable feedback on the region from
friends and/or family either living in the region or who have previously visited the
region, is an important influence upon the decision to holiday in the region.
Visitor Information Centres also play an important role in holiday planning.
Therefore, it is important such information centres are visible and accessible and
provide information on local attractions and entertainment activities.

                          Table 1
         INFORMATION SOURCES USED FOR TRIP PLANNING

                                      Very        To Some
                      Extensive                                A Little   Not At All
                                      Much         Extent
                         %                                       %            %
                                       %             %
      Airline           21.8           4.3          4.3          0.0         69.6
 Coach Operator         17.5           4.3           0.0         4.3         73.9
   Travel Agent         54.6           0.0           3.0         3.0         39.4
 Visitor Centre         33.3           13.9         13.9         2.8         36.1
   Motoring
                         0.0           5.0           0.0         0.0         95.0
  Organisation
 Family/Friends         54.7           15.1          3.8         3.8         22.6
Magazines, Papers
                        40.0           14.0         12.0         8.0         26.0
 and Brochures
    Internet            64.3           7.1           8.9         1.8         17.9

Mode of Transport
Table 2 shows most visitors travel to the region in private vehicles (73.6%). This
implies that regional planners need to provide infrastructure in the form of well-
maintained and safe highways for example, to support the arrival of a relatively
large number of visitors with their own vehicles at key holiday periods during the
year. This is currently a major concern for tourism planners and marketers on the
East Coast of Australia. There have been a relatively large number of traffic
accidents involving fatalities on the Pacific Highway. This is the main highway
that provides the primary access to East Coast tourism destinations, including the
Coffs Coast Region. For example, from 1994 to 2003 the Pacific Highway was the
scene of 9996 crashes, accounting for 453 deaths (NRMA Motoring and Services
2005). It is expected that unless significant upgrades are undertaken on the Pacific
Highway within the near future, such accidents will exert an important influence
on the willingness of self-drive tourists to visit the Coffs Coast and associated
regions on the East Coast. The infrastructure considerations need to include
appropriate parking at locations including beaches, entertainment venues, and
shopping complexes. High fuel prices can also be expected to impact on the
willingness of visitors to travel to the Coffs Coast region.
Table 2
MODE OF TRANSPORT TO COFFS COAST REGION
Category Percentage (%)
Airline 13.1
Tour Coach 7.0
Caravan 3.9
Coach 0.8
Motorbike 0.8
Vehicle 73.6
Motor Home 0.8
Train 0.0
Satisfaction levels of visitors to the region
Table 3 presents data on the satisfaction levels of visitors to the Coffs Coast
Region according to length of stay, reasons for visiting, and whether or not, this
was the first visit undertaken. Table 3 shows that over 98% of visitors were
satisfied with their visit to the Coffs Coast region, with the majority (53.3%)
finding their visit was ‘as expected’. A substantial proportion of respondents (40%)
reported satisfaction levels to be above expectations. However, while no visitors
stated that their experiences were “well below expectations”, nearly 2% reported
that their experience was ‘below expectations’.Table 3
PERCENTAGE OF VISITORS TO COFFS COAST REGION
ACCORDING TO PERIOD OF VISIT, REASON FOR VISIT
AND SATISFACTION LEVEL EXPERIENCED
SATISFACTION LEVELS
PERIOD
REASON Well Above Above Below Expectations Well Below
(DAYS) As Expected (%)
FOR VISIT Expectations (%) Expectations (%) (%) Expectations (%)
Never Visited Never Visited Never Visited Never Visited Never Visited
visited before visited before visited before visited before visited before
Holiday 0.0% 0.0% 1.8% 3.5% 8.0% 5.3% 0.0% 0.0% 0.0% 0.0%
1-2
Friends/relatives 0.0% 0.0% 0.0% 1.8% 0.9% 1.8% 0.0% 0.0% 0.0% 0.0%
Holiday 0.9% 1.8% 4.4% 11.5% 5.3% 18.6% 0.0% 0.0% 0.0% 0.0%
3-7
Friends/relatives 0.0% 0.9% 1.8% 5.3% 0.9% 2.7% 0.0% 0.0% 0.0% 0.0%
Holiday 0.9% 0.9% 0.9% 0.9% 0.9% 4.4% 0.9% 0.0% 0.0% 0.0%
8-10
Friends/relatives 0.0% 0.0% 0.0% 1.8% 0.0% 0.0% 0.0% 0.0% 0.0% 0.0%
Holiday 0.0% 0.0% 0.9% 1.8% 0.0% 1.8% 0.9% 0.0% 0.0% 0.0%
11-15
Friends/relatives 0.0% 0.0% 0.0% 1.8% 0.0% 0.9% 0.0% 0.0% 0.0% 0.0%
Holiday 0.0% 0.0% 0.0% 1.8% 0.0% 1.8% 0.0% 0.0% 0.0% 0.0%
16-20
Friends/relatives 0.0% 0.0% 0.0% 0.0% 0.0% 0.0% 0.0% 0.0% 0.0% 0.0%
Total 1.80% 3.60% 9.80% 30.20% 16.00% 37.30% 1.80% 0.00% 0.00% 0.00%
Examination of supplementary comments provided by respondents noted on
questionnaires by the interviewers, indicated that poor weather, including rain at
the time of conducting the survey, was an important influence upon answering this
question. Such weather patterns were unusual for the Coffs Coast region at that
time of year. In general, the data presented in Table 3 suggests visitors are
satisfied with their experience while holidaying on the Coffs Coast. A more
detailed analysis of pre-purchase expectations would however, need to be made
with visitors in order to substantiate this claim more fully. Geva and Goldman
(1991) argue for example, that ‘satisfaction with past purchase may not be closely
related to intentions to repurchase because of the different functions they may
fulfill. Whereas satisfaction reflects the need to justify past purchase behaviour,
intentions to repurchase, which are of instrumental importance, reflect learning
from experience’. As there is not likely to be a direct causal link between
satisfaction and repurchase intentions, tourism based firms should not be content
with simply being informed about visitors’ satisfaction levels.
From Table 3 it can be seen that over 70 per cent of visitors had been to Coffs
Harbour prior to their current visit. It could therefore be expected that such
tourists were familiar with the region and its attractions and were informed
visitors. The overall satisfaction level apparent from Table 3 is therefore
consistent with the relatively high proportion of return visitors to the region. From
the Table it can also be seen that the majority of visitors stay for 10 days or less.
The average length of visit was 2 to 3 days, although the majority of respondents
were visiting for between 3 and 10 days. A quarter of visitors interviewed in the
survey stayed for 8 days or more. Destination Marketing Organisations need toaim to increase this proportion, in order to increase the economic impacts of visitor expenditure in a manner likely to further stimulate regional output and employment. Respondents were given the choice of indicating the main reason for visiting the Coffs Coast region. Possible reasons included for (1) Holiday, (2) Visiting Friends and Relatives, (3) Personal, (4) Conference, (5) Sport, (6) Education, (7) Business, or (8) Shopping. Eighty per cent of visitors gave the principal reason for visiting the Coffs Coast region as for holiday purposes. These results are likely to have been influenced by the time the survey was conducted. However, a relatively high proportion also gave their reason as, ‘visiting friends and relatives’, living within the region. There were either zero or relatively low proportions recorded against reasons other than ‘holiday’ or ‘visiting friends and relatives’. This demonstrates the need to conduct such visitor destination surveys throughout the year in order to develop a more comprehensive understanding of visitor destination decision making. The importance of the Coffs Coast region as a holiday destination was supported by investigating a random selection of over two hundred visitors to Novotel Pacific Bay Resort at Coffs Harbour over the years 2003 and 2004. As these questionnaires were completed by visitors to the Coffs Coast region throughout the years of 2003 and 2004, they are likely to reduce bias associated with collecting information at one point in time during the year. Analysis of these questionnaires showed that over sixty per cent of visitors to the Coffs Coast region throughout this two year period gave visiting for ‘holiday’ purposes as the main reason for visiting the Coffs Coast region (Morrison 2005). A Chi Square test was undertaken to examine for possible significant relationships between the two variables, satisfaction levels and whether visited the region before or not. This test was undertaken for the ten cross tabulations involving whether visited before or not (2) and satisfaction levels (5). The test indicated that there was no significant difference (at the 0.05 level) in the distribution of satisfaction levels, according to whether or not, an individual had visited the region before. With four degrees of freedom the calculated Chi Square value was 5.30 compared with a critical value of 9.49. A similar test was undertaken to investigate the relationship between satisfaction levels and reasons for visiting the region. Once again there was no significant difference between the distribution of satisfaction levels according to reasons for visiting the region. Similarly there was no apparent significant difference between the distribution of length of stay and reasons for visiting the region. Amongst other things, Table 3 suggests that those concerned with marketing the Coffs Coast as a destination, need to aim to increase the relationship between higher levels of satisfaction and increased length of stay.
Attractions Visited According to Enjoyment
Respondents were asked to indicate those attractions on the Coffs Coast they were
most likely to visit and that they most enjoyed. The data above shows the ranking
of attractions based on this information. The Big Banana recorded the highest
proportion of visitors as the location they were most likely to visit. The Big
Banana, markets itself as Australia's original 'Big Thing', and is situated on the
Pacific Highway just north of Coffs Harbour. It has been at the current location
for around forty years and has been utilised by drive visitors to the region, often as
a ‘halfway stop’, between the state capitals of Sydney and Brisbane. It includes
rides for children and family members, including a toboggan, ice skating, a snow
slope, recreational activities, and a range of food and retail outlets.

The Big Banana, was followed by the Porpoise Pool. This oceanarium was
established in Coffs Harbour in 1970 and houses dolphins, seals and sea lions. The
next ranked attraction was Park Beach Plaza. This is a large, contemporary,
regional shopping centre located on the Pacific Highway at Coffs Harbour. It
consists of 120 specialty shops, a food court, banks and a retail grocery outlet and
is open for business throughout the week. Of key interest from the Table, is the
disparity between intention and action. For example, 92 visitors intended to visit
the Big Banana yet only 52 recorded a satisfaction rating. The anomaly could
result from the fact that at the time of providing information, the visitor had
intended to visit but had not done so at the time of conducting the survey.

                            Table 4
             BUILT ATTRACTIONS MOST LIKELY TO VISIT
                       AND MOST ENJOYED

            Attraction         Most Likely         Attraction         Most
             (sorted)           to Visit            (sorted)         Enjoyed
                                   %                                   %
           Big Banana             65.6         Park Beach Plaza       30.5
          Porpoise Pool           55.7            Big Banana          27.5
        Park Beach Plaza          51.9           Porpoise Pool        21.4
          Jetty Markets           35.1          Butterfly House        7.6
              Fishing             25.2               Fishing           7.6
              Surfing             21.4           Jetty Markets         6.9
         Butterfly House          18.3               Surfing           6.1
        Coffs Promenade           16.8         Coffs Promenade         5.3
        Bellingen Markets         16.0         Bellingen Markets       4.6
          Whale Watch             14.5         Old Butter Factory      4.6
          Horse Riding            13.7          Waterfall Way          3.8
            Clog Barn             13.0                Golf             3.1
          White Water             13.0           Yellow Shed           3.1
        Old Butter Factory        12.2             Coffs Zoo           2.3
Coffs Zoo 11.5 Whale Watch 2.3
Golf 11.5 White Water 2.3
Waterfall Way 11.5 Clog Barn 1.5
4WD-Trail Bike 9.9 Horse Riding 1.5
Honey Place 6.1 4WD-Trail Bike 0.8
Surf Rafting 5.3 Honey Place 0.8
Raleigh Vineyard 3.8 Opal Centre 0.8
Yellow Shed 3.8 Surf Rafting 0.8
Table 5 shows details of intention to visit natural attractions within the Coffs
Coast region. A relatively high proportion of respondents (92.4%), indicated that
they were ‘likely to visit’ beaches. Marine Parks recorded the next highest ranking
for ‘likely to visit’. A relatively high proportion also indicated that they intended
to visit rivers/estuaries. The data suggests that a majority of visitors to the region
intend to visit and enjoy beaches and surrounding water based natural attractions.
As a result, it could be argued that the focus of marketing campaigns targeting
holidaymakers over the summer period should clearly identify the region’s
beaches and associated activities.
Table 5
INTENTION TO VISIT NATURAL ATTRACTIONS
Attraction Likely to Visit Neutral Unlikely to Visit
National Parks 34.4% 0.8% 12.2%
Botanic Gardens 22.1% 0.0% 13.7%
Marine Parks 38.9% 3.8% 9.9%
Beaches 92.4% 0.8% 2.3%
Hinterland 27.5% 2.3% 11.5%
Rivers/Estuaries 33.6% 3.1% 11.5%
The main problem with such an approach is that it is difficult to adequately
differentiate the Coffs Coast destination from other coastal destinations found on
much of the East Coast of Australia, using such a strategy. Tourism literature
indicates for example, that tourists’ intention to re-visit a destination is linked to a
destinations’ difference and image compared to other destinations. Bigne, Sanchez
and Sanchez (2001) suggest, for example, that a place’s image is more important
in leading visitors to re-visit compared to satisfaction levels. Further research
needs to be conducted to determine the attributes of beaches that most appeal to
visitors and to ensure these are maintained as an integral part of the region’s
development plans.Figure 2 presents a graphical representation of responses according to class
intervals of daily expenditure by visitors to the Coffs Coast region according to
expenditure categories. The majority of responses for each expenditure category
fall in the lowest expenditure interval ($0-$29). Expenditure on food and
beverages recorded fell in the next lowest expenditure band of $30-$60, and
accommodation with an equal number of respondents in the lowest expenditure
band ($0-$29) and the highest expenditure band (>$181).
Figure 2
EXPENDITURE CATEGORIES
90
80
70
60
Accommodation
Transport
50
Food/Beverages
40 Entertainment
Activities
30
Miscellaneous
20
10
0
$0-$29 $30-$60 $61-$90 $91- $121- $151- >$181
$120 $150 $180
It is evident from the expenditure data that most visitors to the Coffs Coast region
prefer to limit expenditure to the lower levels. This is consistent with other results
which indicate that families groups dominate the visitor profile to the Coffs Coast
region. It appears from the data that such family groups are seeking relatively low
cost forms of entertainment and activities during their stay. They are also
predominantly using their own vehicles for transport. Such expenditure patterns
have important implications for those involved in destination planning and
marketing. They suggest that a key attraction of the destination is the ability of
visitors to access and enjoy lower cost activities.
SUMMARY AND CONCLUSIONS
It has been argued by tourism planners and practitioners that recent urban
development in the North coast region of New South Wales, a lack of destination
differentiation, and changes in the benefits visitors seek from the travel experience,have all led to a decline in the traditional destination specific tourist segment. These travellers have traditionally been the core market for the North Coast New South Wales region and for important components of this larger region, such as the Coffs Coast region. The aim of the research was to evaluate important behavioural aspects of travellers to the Coffs Coast region of the East Coast of Australia. Important aspects of the research include the findings that the majority of visitors to tourism destinations such as the Coffs Coast Tourism Region on the East Coast of Australia are families with relatively young children. With regard to information sources used to choose a destination it can be seen that the Internet is now an important tool used by tourists planning a holiday. Accessible, attractive and user-friendly tourism web sites for the marketing of destinations would therefore seem important. Most visitors travelled to this tourism region in private vehicles. This suggests that well maintained and safe infrastructure in the form of highways will become increasingly important in supporting the arrival of relatively large visitor numbers to holiday regions such as the Coffs Coast Tourism Region. In addition, escalating fuel prices can be expected to impact on the willingness and ability of families to continue travelling to such tourism destinations in the future. The majority of visitors to the Coffs Coast Tourism Region were satisfied with their visit with most finding their visit to be, ‘as expected’. Iconic, regionally based attractions, such as the ‘Big Banana’ were reported to be the most likely built form sites to be visited by tourists. With respect to natural attractions, a relatively high proportion of respondents (over ninety per cent), indicated that they were likely to visit beaches. Data relating to daily expenditure by visitors show that most prefer to limit expenditure within the categories of accommodation, transport, food and beverages and entertainment to the lower levels. Expenditure data collected in the survey suggest that families visiting regions such as the Coffs Coast Tourism Region seek relatively low cost entertainment and activities during their stay. Their preference to self-drive, also acts to limit their use of alternative forms of transport while holidaying within the region. Such expenditure patterns have important implications for destination marketing. It is important to attempt to better understand the behaviour of tourists when choosing, consuming and later evaluating their destination experiences. The destination product is an experience comprising an array of industry tourism services and non-commercial experiences. Insights provided by the data presented in this paper can be expected to assist in the identification of existing and potential target markets for regions such as the Coffs Coast Tourism Region. It can also be expected to assist tourism destination planning in the provision of suitable facilities and activities for visitors.
References

ATS Group (2004). North Coast NSW, Regional Tourism Plan 2004 – 2007.

Bigne, E. J., Sanchez, I.S. & Sanchez, J. (2001). Tourism Image, Evaluations
Variables and After Purchase Behaviour: Inter-Relationship. Tourism
Management, 22. 607-616.

Bureau of Tourism Research (2003). National Visitor Survey 2003. Bureau of
Tourism Research: Canberra.

Centre for Enterprise Development and Research (2005). Coffs Coast Visitor
Survey, report commissioned by the Coffs Coast Tourism Association. Available
at http://cedar.net.au/assets/pdf/Report_1.pdf

Chon, K. (1990). The role of destination image in tourism: A review and
discussion. The Tourist Review, February, 2-9.

Chon, K.S. & Mayer, K.J. (1995). Destination Competitiveness Models in
Tourism and Their Application to Las Vegas. Journal of Tourism Systems and
Quality Management, 1 (2-4), 227-46.

Clawson, M. & Knetch, J. (1966). Economics of Outdoor Recreation. Baltimore,
Johns Hopkins University Press.

Crouch, G.I & Ritchie, J.B.R. (1999). Tourism, Competitiveness, and Societal
Prosperity. Journal of Business Research, 44 (3), 137-152.

Crouch, G.I. (1996). Demand Elasticities in International Marketing: A Meta-
Analytical Application to Tourism. Journal of Business Research, 36 (2), 117-
136.

Crouch, G.I. (2000). Services Research in Destination Marketing: A Retrospective
and Prospective Appraisal. International Journal of Hospitality and Tourism
Administration, 1 (2), 65-85.

Dann, G.M.S. (1996). Tourist Images of a Destination – An Alternative Analysis.
Journal of Travel and Tourism Marketing, 5 (1/2), 41-55.

Echtner, C.M. & Ritchie, J.R. (1991). The Meaning and Measurement of
Destination Image. The Journal of Tourism Studies, 2 (2), 2-12.

Echtner, C.M. & Ritchie, J.R. (1993). The Measurement of Destination Image: An
Empirical Assessment. Journal of Travel Research, 31 (4), 3-13.

Enright, M.J. & Newton, J. (2005). Determinants of Tourism Destination
Competitiveness in Asia Pacific: Comprehensiveness and Universality. Journal of
Travel Research, 43, 339-350.

Gallarza, M.G., Saura, I.G. & Garcia, H.C. (2002). Destination Image Towards a
Conceptual Framework. Annals of Tourism Research, 29 (1), 56-72.

Gartner, W. (1993). Image formation process. Journal of Travel and Tourism
Marketing, 2 (2/3), 191-215.
Geva, A. & Goldman, A. (1991). Satisfaction Measurement in Guided Tours.
Annals of Tourism Research, 18 (2), 177-185.

Gunn, C.A. (1972). Vacationscape: Designing Tourist Regions, Bureau of
Business Research. Austin: University of Texas.

Gunn, C. (1989). Vacationscape: Designing Tourist Regions, 2nd ed. New York:
Van Nostrand Reinhold Publishers.

Hankinson, G. (2001). Location branding: A study of the branding practices of 12
English cities. Journal of Brand Management, 9, 127-142.

Hassan, S.S. (2000). Determinants of Market Competitiveness in an
Environmentally Sustainable Tourism Industry. Journal of Travel Research, 38
(3), 239-45.

Hudson, S. & Shephard, G.W.H. (1998). Measuring service quality at tourist
destinations: an application of importance-performance analysis to an Alpine ski
resort. Journal of Travel and Tourism Marketing, 7 (3), 61-77.
Hunt, J. (1975). Images as a factor in tourism development. Journal of Travel
Research, 13, 1-7.

Jennings, G. (2001). Tourism Research. Milton, QLD: Wiley and Sons.

Kotler, P.H. (1998). Marketing Management: Analysis, Planning, and Control, 8th
ed. Englewood Cliffs, NJ: Prentice-Hall, Inc.

Lovelock, C., Paterson, P. & Walker, R. (2001). Services Marketing: An Asia-
Pacific Perspective. Frenches Forest: Prentice Hall.

Lubbe, B. (1998). Primary image as a dimension of destination image: an
empirical assessment. Journal of Travel and Tourism Marketing, 7 (4), 21-43.

Mayo, E., & L. Jarvis (1981). The Psychology of Leisure Travel: Effective
Marketing and Selling of Travel Services. Boston: CBI Publishing Co., Inc.

Morrison, A. (2005). Service Quality in a Regional Resort.” Unpublished Paper.
School of Commerce and Management. Coffs Harbour: Southern Cross University.

Neuman, W.L. (1994). Social research methods: qualitative and quantitative
approaches. Boston: Allyn and Bacon.

NRMA Motoring and Services. (2005). Pacific Highway Audit,
http://www.fixourbloodyroads.com/yourhighway_pacific.asp (accessed 11 Nov,
2005).

Otto, J.E. & Ritchie, J.R. (1996). The service experience in tourism. Tourism
Management, 17 (3), 165-174.

Ritchie, J.R. & Crouch. G.I. (2000). The competitive destination: A sustainability
perspective. Tourism Management, 21, 1-7.

Selby, M. & Morgan, N.J. (1996). Reconstructing place image: a case study of its
role in destination market research. Tourism Management, 17, 287-294.
Sheppard, A.G., Grove, S.J., Norman, W.C., McLelland, R.W. & McGuire, A.
(1998). Lasting Service Products and the Nature of Tourism. Tourism Analysis, 2
(3/4), 207-212.

Tribe, J. & Snaith, T. (1998). From SERVQUAL to HOLSAT: Holiday
Satisfaction in Varadero, Cuba. Tourism Management, 19 (1), 25–34.

van Raaij, W.F. & Crotts, J.C. (1994). Introduction: The Economic Psychology of
Travel and Tourism. Journal of Travel and Tourism Marketing, 3 (3), 1-19.

Walmsley, D.J. & Young, M. (1998). Evaluative images and tourism: the use of
personal constructs to describe the structure of destination images. Journal of
Travel Research, 36 (3), 65-69.

Woodside, A. & Lysonski, S. (1989). A general model of traveller destination
choice. Journal of Travel Research, 27, 8-14.
You can also read