Keystone XL: A Tar Sands - Pipeline to Increase Oil Prices - Author Anthony Swift Natural Resources Defense Council
←
→
Page content transcription
If your browser does not render page correctly, please read the page content below

Keystone XL: A Tar Sands
Pipeline to Increase Oil Prices

                                                      Author
                                               Anthony Swift
                            Natural Resources Defense Council

          A D V O C A C Y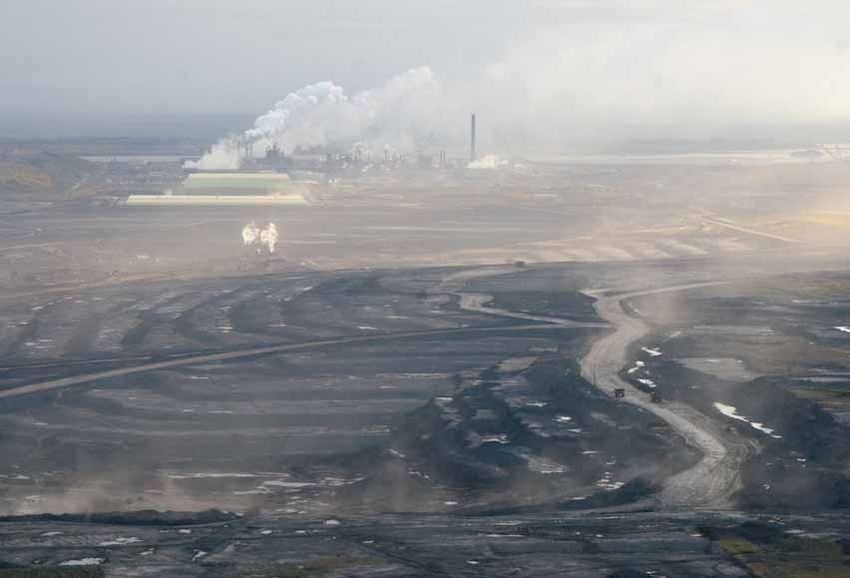
About the Natural Resources Defense Council
The Natural Resources Defense Council (NRDC) is a national nonprofit environmental organization with more than 1.3
million members and online activists. Since 1970, our lawyers, scientists, and other environmental specialists have worked
to protect the world’s natural resources, public health, and the environment. NRDC has offices in New York City, Washington,
D.C., Los Angeles, San Francisco, Chicago, Montana, and Beijing. For more information, please visit www.nrdc.org.

About Oil Change International
Oil Change International campaigns to expose the true costs of fossil fuels and facilitate the coming transition towards
clean energy. We are dedicated to identifying and overcoming political and economic barriers to that transition.
Visit us at www.priceofoil.org for more information. To find out how much money your Congressional Representatives take
from fossil fuel interests, visit www.DirtyEnergyMoney.com.

About Forest Ethics Advocacy
Founded in April 2012, ForestEthics Advocacy is a non-profit society devoted to public engagement, outreach and
environmental advocacy—including political advocacy. We secure large-scale protection of endangered forests and wild
places and transform environmentally destructive resource-extraction industries.

Acknowledgements
Thanks to the reviewers of this report: Ian Goodman, The Goodman Group, Ltd.; Susan Casey-Lefkowitz, NRDC; Peter Ashton,
Phillip Verleger, Steve Kretzmann, Oil Change International; Henry Banta, Laurie Johnson, NRDC; Jeff Benzak, NRDC; and
Carlita Salazar, NRDC.

NRDC Director of Communications: Phil Gutis
NRDC Deputy Director of Communications: Lisa Goffredi
NRDC Publications Director: Alex Kennaugh
NRDC Publications Editor: Carlita Salazar
Design and Production: Tanja Bos

© Natural Resources Defense Council, 2012

Cover photo: The Canadian Parks and Wilderness Society, © David Dodge

                                                                        |
                                                            PAGE 2 Keystone XL: A Tar Sands Pipeline to Increase Oil Prices
INTRODUCTION
O
ne of the most misunderstood issues surrounding the proposed Keystone XL tar sands
pipeline is the project’s impact on U.S. gasoline prices. The Keystone XL tar sands
pipeline would pump up to 830,000 barrels per day (bpd) of some of the world’s dirtiest
oil, which is strip mined and drilled from under Canada’s Boreal forests, straight through the
heart of America’s breadbasket to refineries on the Texas Gulf Coast. By allowing tar sands access
to the lucrative international market, Keystone XL would finance further expansion of tar sands
extraction, worsening climate change and undermining efforts to move to clean energy. Pipeline
supporters cite high gasoline prices as a reason to build the project. The truth is that Keystone XL is
likely to both decrease the amount of gasoline produced in U.S. refineries for domestic markets, and
increase the cost of producing it, leading to even higher prices at the pump.
The Keystone XL tar sands pipeline would divert oil from the Meanwhile the Keystone XL pipeline will increase the price
Midwest to refineries on the Gulf Coast of Texas. Midwestern that gasoline producing refineries in the Midwest pay
refineries produce more gasoline per barrel than refineries for crude oil. TransCanada, the company sponsoring the
in any other region in the United States. That gasoline is pipeline, pitched the pipeline to Canadian regulators as a
then sold to U.S. consumers. In contrast, refineries on the way of increasing the price of crude in the United States.1
Gulf Coast of Texas produce as much diesel as possible, Right now, Midwestern refineries are buying crude oil at a
much of which is exported internationally. By taking oil from discount—a deep discount. This allows them to produce
midwestern gasoline refineries to Gulf Coast diesel refineries, products more cheaply than they would otherwise be able
Keystone XL will decrease the amount of gasoline available to to. Building Keystone XL would change that. If TransCanada’s
American consumers. analysis is accurate, under current market conditions,
|
PAGE 3 Keystone XL: A Tar Sands Pipeline to Increase Oil PricesKeystone XL would add $20 to $40 to the cost of a barrel of
How Refineries Work
Canadian crude—increasing the cost of oil in the United
States by tens of billions of dollars.
Crude oil is a mixture of petroleum molecules of
The Keystone XL tar sands pipeline is not a solution to rising different sizes. Refineries take this raw mixture and
turn it into useful products like gasoline and diesel.
gas prices. By decreasing the supply of gasoline in the United
The first step in the refining process is separating the
States and increasing the price refineries pay to produce
naturally occurring petroleum molecules by size. This
it, Keystone XL will add to America’s pain at the pump.
happens in a distillation unit, where crude is heated and
The United States does not need the Keystone XL tar sands sorted based on the different boiling points. Lighter
pipeline and the associated climate, land, and water risks. molecules used to make high-value gasoline boil at
The solutions to our energy needs lie in reducing our demand lower temperatures, while heavier molecules that make
for oil, increasing fuel efficiency standards, and eliminating lower value products, like petroleum coke, boil at higher
subsidies for the oil industry. temperatures.
Natural distillation does not produce enough gasoline
and diesel to satisfy market needs. Light oil only yields
Oil Industry Shifts Focus about 20 percent gasoline products and 50 percent
from Gasoline to Diesel heavy residuum.a Heavier crude blends produce even
less gasoline in natural distillation.b
To understand Keystone XL’s impact on U.S. gas prices, it is
first necessary to understand how the U.S. refinery industry
Refineries use secondary conversion processes to
supplies fuel for domestic and international transportation
increase the volume of gasoline and diesel that can
markets. The United States runs on gasoline. Motor gasoline be produced from a barrel of oil. Refineries contain
provides more than two-thirds of the fuel for the U.S. ground several types of cracking and coking units which break
transportation network.2 In this, the United States is the large petroleum molecules into smaller ones. They also
international exception rather than the rule. Diesel provides contain units which can combine very small petroleum
nearly two-thirds of the ground transportation fuel outside molecules into larger ones. While refineries cannot
North America. 3 process crude oil to produce one refined product
exclusively—they can configure their operations to
Historically, gasoline has commanded higher prices than maximize the production of one product or another.c
diesel on both the U.S. and international markets, creating a By adjusting the configuration of these downstream
financial incentive for refiners to produce as much gasoline facilities, refinery operators can maximize the production
as possible.4 Prior to 2000, largest gasoline producing region of gasoline or diesel.
in the United States was the Gulf Coast, which produced
a
http://www.eia.gov/pub/oil_gas/petroleum/analysis_publications/oil_market_basics/refining_text.
refined products almost exclusively for the U.S. market.5 htm#Crude Oil Quality
However, in recent years, increased worldwide demand b
http://www.gao.gov/new.items/d05525sp.pdf
for diesel fuel in Europe, China, India, and Latin America c
U.S. Energy Information Administration (EIA), Increasing Distillate Production at U.S. Refineries – Past
Changes and Future Potential, Oct. 2010, pg. 9-13, ftp://ftp.eia.doe.gov/features/distillateprod.pdf.
increased its price relative to gasoline.6 By 2004, average
diesel prices exceeded gasoline prices—particularly outside
the United States.7 These increasing diesel prices have created source of gasoline for the U.S. market, had the greatest access
a financial incentive for refineries to maximize the amount of and capacity to export to international diesel markets.9 Today,
diesel they can get out of a barrel of oil and send that diesel to these refiners have started reconfiguring their operations to
overseas markets. prioritize diesel for international customers over gasoline
for U.S. customers.10 Data from the fourth quarter of 2011
Refineries can increase their diesel production with indicate that the majority of refined products produced in
relatively minor, low-cost changes to the configuration of Texas Gulf Coast refineries were exported on the international
their existing operations. Larger capital investments, such market.11
as expansions that use hydocracking units rather than fluid
catalytic cracking units, can further increase the amount of
diesel that can be produced from a barrel of oil. Refineries
in the United States, particularly those on the Texas Gulf Midwestern Refineries Produce
Coast, are pursuing both strategies to increase their diesel More Gasoline Than Texas Gulf
yield, decreasing their production of gasoline in the process.
Coast Refineries
Data shows that gasoline yield, or the amount of gasoline
produced from a barrel of crude, has been declining over the In recent years, Gulf Coast refineries have switched from
last 10 years.8 producing gasoline to producing diesel. Ten years ago, Texas
Gulf Coast and Midwestern refineries had similar gasoline to
This trend has been pronounced in refineries on the Gulf diesel ratios, both producing about 2.3 barrels of gasoline for
Coast with access to the higher prices in the international every barrel of diesel. Since then, Texas refineries have had a
diesel market. Gulf Coast refiners, historically the primary 30 percent decline in their gasoline to diesel output.
|
PAGE 4 Keystone XL: A Tar Sands Pipeline to Increase Oil PricesFigure 1: Refineries in the Texas Gulf Coast are Producing Less
Finished Gasoline and More Diesel When Compared to Midwestern Refineries*
2.50
GASOLINE TO DIESEL RATIO
2.00
1.50
Midwest Gasoline
to Diesel Ratio (bpd)
1.00
Texas Gulf Gasoline
to Diesel Ratio (bpd)
0.50
* Calculated by adding both finished
gasoline and gasoline blending
0.00 components produced by refineries
2002 2003 2004 2005 2006 2007 2008 2009 2010 2011 and blenders and dividing diesel output
Lower gasoline production in Texas Gulf refineries cannot be Given current differences between the gasoline yields of
attributed to lower quality crude oil feedstock. High quality midwestern and Texas Gulf refineries, the fact that the
crudes, which are lighter and less sulfuric, do tend to produce Keystone XL pipeline will siphon up to 830,000 barrels per
Figurethe
more gasoline. However, 2: Tar Sands
overall Crude
quality Sellsoil
of crude for a Signficant Discount
day of crude Compared
oil from to Both
the Midwest to the Gulf Coast would
processed in TexasDomestic
Gulf Coastand International
refineries is better thanCrudethat decrease U.S. gasoline supplies by 80,000 bpd, or 1.2 billion
processed by many refineries
120 in the Midwest which have gallons a year.15 And this analysis does not yet account for
higher gasoline output. 12 For instance, northern midwestern the fact that gasoline yields in Gulf refineries may continue
Mexican Maya
refineries, which process crudes which are both heavier and to decline and the majority of(International
finished gasoline produced
100
more sulfuric than those processed in the Texas Gulf Coast, in Texas Gulf refineries is exported internationally. Even
Heavy Crude)
PRICE PER BARREL (USD)
also have gasoline yields that are more than 10 percent without incorporating these factors, the numbers show that
West Texas
greater than those on 80
the Gulf Coast of Texas. by reducing available gasoline supplies in the United States,
Intermediate
the Keystone XL pipeline will(Domestic Light Crude)
likely increase pressure on retail
More specifically, northern midwestern refineries produced gasoline prices. Western Canadian
60
about 22 gallons of gasoline from every barrel of crude oil Select (Tar Sands)
over the last year—despite working with inferior feedstock.13
On the other hand, refineries
40 on the Gulf Coast of Texas
produced about 17 gallons of gasoline, while processing
“Increased diesel production certainly has
lighter, sweeter crudes that should yield greater volumes of
20
gasoline in similarly configured refineries.14 In other words, a had a pressuring effect on gasoline prices.”
barrel of crude processed in midwestern refineries produces
0
more than 25 percent more gasoline than one processed in a — Avery Ash, manager of regulatory affairs, American
08 09 10 11 -11 -11 -11 11Automobile
-11 2 -12
Texas Gulf refinery. 20 20 20 an- c h a y l y p -
ov n-1Association,
ch March 29, 201216
J r Ju Se Ja r
Ma M N Ma
Table 1: Comparison in Crude Quality and Gasoline Yield Between Northern Midwest and Texas Gulf
Coast Refineries
Crude Quality and Gasoline Yield Northern Midwest Crude Quality Texas Gulf Coast Crude Quality
API Gravitya 28 29
Sulfur Contentb 2.3% 1.8%
Gasoline Yieldc 51.2% 40.8%
Gallons of Gasoline per Barrel 21.5 17.1
Despite processing lower quality crudes, Northern Midwestern refineries produce more gasoline per barrel of crude oil than Texas Gulf Coast refineries.
Source: Showing crude input qualities from March 2011 – February 2012. EIA, Crude Input Qualities, April 30, 2012, http://www.eia.gov/dnav/pet/pet_pnp_crq_dcu_nus_m.htm.
a
API gravity is a measure of how dense or heavy crude oil. The lower the gravity, the heavier and lesser quality the oil.
b
Crudes with higher sulfur content are lower quality and more difficult to refine.
c
Gasoline Yield is how much gasoline and gasoline blending components a refinery produces from a barrel of crude oil.
|
PAGE 5 Keystone XL: A Tar Sands Pipeline to Increase Oil PricesKeystone XL Will Divert Keystone XL: Simply an Export Pipeline
Oil Away From Midwest via the Texas Gulf Refineries
Keystone XL is not a pipeline to the United States, but one Rising diesel prices have corresponded with the United
through it. Existing pipelines from Canada to the United States becoming a major exporter of refined products. These
States provide enough capacity to move all the oil that changes have been dramatic in refineries located on the
Canada produces. In fact, Canada’s current oil production Gulf Coast. More than three-quarters of the nation’s exports
uses only approximately half of its export pipeline capacity. In originate in refineries on the Gulf Coast.21 As was explained
2010, Canada exported less than 2 million bpd of crude oil.17 in a previous section, within the Gulf Coast refineries, those
The vast majority of these exports were produced in western located on the Texas Gulf Coast are particularly active in the
Canada and transported to the United States. Canada already export market. In the fourth quarter of 2011, these Texas
has an excess of crude oil export pipelines—enough to export Gulf Coast refineries were responsible for exporting nearly
nearly 4.1 million bpd (see table 2: Total Capacity of Canada’s 1 million barrels of gasoline and diesel every day. These
Existing Export Pipelines). refineries produce more than half of U.S. gasoline and diesel
exports, while only accounting for approximately one-sixth of
Tar sands oil production in Canada is at approximately 1.6 the country’s petroleum input.22
million bpd.18 Tar sands production would have to reach
nearly 4.1 million bpd for Keystone XL to begin to transport On the other hand, midwestern refineries sell 99 percent of
additional crude into the United States.19 Even if Canadian their product to U.S. customers. Midwestern refineries do
tar sands oil production increases at the highly aggressive not currently have an easy means of accessing the lucrative
pace that its oil industry predicts—reaching 3.7 million bpd international market for refined products.23 The Midwest
by 2025—it would take more than 15 years to fill the existing itself is one of the largest markets for gasoline in the United
pipelines to the United States.20 States and it is not well situated to export refined products to
Europe, Latin America, or Asia. Moreover, its refineries have
TransCanada’s Keystone XL tar sands pipeline bypasses not pursued infrastructure to support the international export
Midwestern refineries, transporting tar sands from Alberta of products. The small fraction of petroleum exported by
directly to refineries on Texas’s Gulf Coast. Although many Midwestern refineries is primarily low-value petroleum coke,
pipeline systems have numerous pipelines for offloading oil residual fuel oil, and asphalt.24 In 2011, more than 99.7 percent
along their route, Keystone XL only has two—one in Houston of gasoline and diesel produced in the Midwest stayed in the
and another in Port Arthur, which are increasingly moving United States.25
from domestic sales to focus on international exports of the
products they produce.
Table 2: Total Capacity of Canada’s Existing Export Pipelinesa
Capacity
Name Destination
(barrels per day)
Eastern Canada
Enbridge Mainline East Coast 1,900,000
Midwest
Enbridge Alberta Clipper Pipeline Northern Midwest 800,000b
TransCanada Keystone I Pipeline Midwest 590,000
Rocky Mountains
Express 283,000
Midwest
Milk River Rocky Mountains 118,000
Rangeland Rocky Mountains 85,000
Kinder Morgan TransMountain Pipeline British Columbia 300,000
Total Existing Canadian Pipeline Export Capacity West Coast 4,076,000
a
Energy Resources Conservation Board, ST98-2011 Alberta’s Energy Reserves 2010 and Supply/Demand Outlook 2011-2020, June 2011, pg. 3-28, http://www.ercb.ca/docs/products/STs/
st98_current.pdf
b
The Alberta Clipper pipeline is currently operating at 450,000 bpd, but is designed for a maximum capacity of 800,000 bpd. Enbridge, Alberta Clipper and Southern Lights, http://www.
enbridge.com/Alberta-Clipper-and-Southern-Lights.aspx.
|
PAGE 6 Keystone XL: A Tar Sands Pipeline to Increase Oil PricesThe Gulf Coast Exports Gasoline and Diesel
“So you will see what we have been doing
During a recent Energy and Power subcommittee
is we are changing our output to meet the
hearing, Alex Pourbaix of TransCanada explained to
world demand and it is actually pulling Representative Markey that after oil from Keystone XL
is refined, diesel will be exported from Texas refineries
product from the United States in the form internationally, while gasoline for U.S. consumers would
of willing to bid up the price.” be imported in exchange.a However, the numbers on
the Gulf Coast tell a different story. In 2011, Gulf Coast
— Bill Klesse, chief executive officer of Valero, refineries exported 390,000 barrels per day of finished
March 6, 201226 motor gasoline on net.b Refineries on the Texas Gulf
Coast were responsible for the majority of these exports.c
While Gulf refineries are focused on exporting diesel, they
are also exporting gasoline and not importing gasoline in
Keystone XL Will Increase Price high enough amounts to replace what they export.
Figure 1: Refineries in the Texasof Oil
Gulf Coast are Producing Less
in United States and Canada
Finished Gasoline and More Diesel When Compared to Midwestern Refineries*
In fact, nationally, the United States is now a net
The configuration of2.50
the U.S. pipeline system has meant exporter of refined product. In the last quarter of 2011,
that with additional flows of crude oil coming from the U.S. exports of refined products exceeded imports by
north, increased oil supplies are available to refineries in 2.5 million bpd.d Most of these exports were driven by
GASOLINE TO DIESEL RATIO
the Midwest, Rocky2.00Mountains, and Ontario. As supplies in an increase in foreign purchase of diesel fuel.e
these regions have increased, oil prices have declined relative
to the world oil market price. Throughout 2011, this caused a
House Energy and Commerce Subcommittee on Energy and Power, Hearing on
the price of Canadian1.50crude to decline significantly below “The American Energy Initiative,” Dec. 2, 2011,
http://www.youtube.com/watch?v=VucRPHJtvGU.
international prices. In March 2012, tar sands crude was b
EIA, Monthly Gulf Coast (PADDMidwest
3) Exports Gasoline
of Finished Motor Gasoline,
selling for $70 per barrel in the Midwest when Mexican Maya, to Diesel Ratio (bpd)
Jan. 30, 2012, http://www.eia.gov/dnav/pet/hist/LeafHandler.
ashx?n=PET&s=MGFEXP32&f=M; EIA, Monthly Gulf Coast (PADD 3) Imports
1.00 selling on the international market,
a crude of similar quality of Finished Motor Gasoline, Jan. 30, 2012, http://www.eia.gov/dnav/pet/hist/
Texas Gulf Gasoline
LeafHandler.ashx?n=PET&s=MGFIMP32&f=M.
was selling for more than $112 per barrel.27 c
to Gulf
In the fourth quarter of 2011, the Diesel Ratio
Coast (bpd)
exported 557,000 bpd of finished
motor gasoline, of which 422,000 bpd originated from Texas Gulf Coast refineries.
One of the primary 0.50
purposes of the Keystone XL tar sands EIA, Gulf Coast Exports of Finished Motor Gasoline, March 1, 2012, http://www.
eia.gov/dnav/pet/hist/LeafHandler.ashx?n=PET&s=MGFEXP32&f=M/; EIA Texas
pipeline is to increase the price of Canadian tar sands and Gulf Coast data request, * Calculated by adding both finished
April 2, 2012. gasoline and gasoline blending
profits for the multinational companies that produce the d
EIA Import and Export Data components produced
for 4th quarter by refineries
of 2011.
0.00
tar sands. According to TransCanada, Keystone
2002 2003 2004 2005 XL2006
would
2007 2008 e
2009
EIA, U.S.2010 2011
petroleum andexports
product blendersexceeded
and dividingimports
diesel output
in 2011 for first time
in over six decades, March 7, 2012, http://www.eia.gov/todayinenergy/detail.
increase the price of Canadian tar sands to roughly equal cfm?id=5290.
that of Mexican Maya.28 When TransCanada told Canadian
Figure 2: Tar Sands Crude Sells for a Signficant Discount Compared to Both
Domestic and International Crude
120
Mexican Maya
100 (International
Heavy Crude)
PRICE PER BARREL (USD)
West Texas
80 Intermediate
(Domestic Light Crude)
Western Canadian
60 Select (Tar Sands)
40
20
0
08 009 010 n-11 h-1
1 -11 11 1 -11 2
h-1
2
20 2 2 Ja rc y ly- p-1 v n-1
Ma Ma Ju Se No Ja
Ma
rc
|
PAGE 7 Keystone XL: A Tar Sands Pipeline to Increase Oil Pricesregulators that Keystone XL would eliminate the disparity built, Gulf Coast refineries will process Canadian volume of
between Canadian crude and international crude prices in crude oil diverted from the Midwest.39 If Keystone XL is not
2009, Canadian crude was selling at a $3 a barrel discount.29 built, the Midwest will process that Canadian crude, turning
The overall revenue increase for Canadian crude producers it into high volumes of gasoline.40 Gulf refiners will continue
was estimated at between $1.8 billion to $3.4 billion.30 to buy oil on the international market in order to sell refined
products back to the international market.41
“The price for Canadian heavy crude could
Keystone XL is Likely to Increase
increase further if the Keystone XL Pipeline U.S. Gasoline Prices
causes the available supply in the Midwest The proposed Keystone XL tar sands pipeline will likely
to be less than the demand, resulting increase gasoline prices in large areas of the United States
through two mechanisms:
in a price equivalent to Midwest parity with
n Substantially increasing the cost of crude for refineries
imported Maya crude, as it was in the Midwest and Rocky Mountain states, leading them
before 2000.” to either increase the price of their products or reduce
their output
— Remarks submitted to Canadian National Energy
Board by Purvin & Gurtz on TransCanada’s behalf31
n Diverting oil from refineries in the Midwest that
maximize gasoline production to those on the Texas Gulf
Coast that maximize diesel output, reducing gasoline
production in the U.S. market
Since the beginning of 2012, Canadian tar sands crude has
been selling at discount to Mexican Maya of $20 to $40 per Increasing Cost of Producing Gasoline
barrel.32 In the first quarter of 2012, prices at the Gulf Coast in Midwest and Rockies
for Mexican Maya hovered between $100 and $115, while In the United States, the price of gasoline is primarily dictated
Canadian tar sands sold in the Midwest for between $60 by the price of crude oil.42 TransCanada as well as industry
and $90.33 Reversing this discount would have a significant and market analysts expect that Keystone XL will increase
impact—increasing U.S. oil prices and the oil industry’s profits. the price of Canadian crude oil.43 This increase will have a
substantial effect on the operating costs of refineries in the
The disparity between tar sands and Mexican Maya is Midwest and Rocky Mountains, which both rely on Canadian
now between six and fourteen times greater than the price crude imports for more than half of their feedstock.44
discount existing when TransCanada forecast that Keystone Refineries deal with higher costs in two ways—passing them
XL would increase the revenues of Canadian tar sands onto consumers as higher gas prices or producing less.
producers by up to $3.4 billion. If TransCanada were to do the
same analysis today, it would likely find that the Keystone XL Refineries may attempt to pass on higher costs to consumers
pipeline would increase the amount the United States paid directly in the form of higher gasoline prices. Just as lower
for Canadian crude by up to $27 billion a year. 34 regional crude prices have resulted in lower gasoline prices
in Rocky Mountain states, higher crude oil costs often lead to
TransCanada predicted Keystone XL would lead to higher higher gasoline prices.
Canadian crude prices for several years—lasting as long as
pipeline capacity exceeded Canadian tar sands supply.35
With Keystone XL, Canada would have 5 million bpd of Figure 2: What Is In The Price of Gasoline?
export pipeline capacity, nearly three times more pipeline
capacity than it has oil to export.36 Even based on industry’s
optimistic projections, it will take decades to fill that much Distribution and Marketing
pipeline capacity. 37 6%
Taxes
The Keystone XL pipeline would allow tar sands producers
to ship crude to Texas Gulf Coast refineries at higher 11% Refining
international prices. In the process, it would divert oil from 16%
Midwestern refineries until decreasing oil supplies in that
Crude Oil
region force prices there to reach international levels.
67%
Meanwhile, according to a Department of Energy report, the
Keystone XL pipeline will not have a substantial effect on the
crude available to Gulf Coast refineries.38 If Keystone XL is Source: U.S. EIA, Gasoline and Fuel Update, May 21, 2012, http://www.eia.gov/petroleum/gasdiesel/.
|
PAGE 8 Keystone XL: A Tar Sands Pipeline to Increase Oil PricesWhy Keystone XL Will Raise U.S. Oil Prices, Not Lower International Prices
Keystone XL will take oil currently refined in the Midwest and Rockies and send it to the Gulf Coast where it can be sold on
the international market. Oil supplies dedicated to the United States will decline while the Keystone XL pipeline provides
the international market with access to that Canadian crude previously meant for the U.S. market. This will have a powerful
impact on oil prices in the Midwest and the Rockies—increasing the price of Canadian crude by $20 to $30 a barrel in the
2012 U.S. market, while doing nothing to decrease world oil prices. There are three reasons why the Keystone XL pipeline
will not significantly lower international crude prices:
n The international market is more than twenty times n TransCanada’s economic rationale for the Keystone
larger than the midwestern and Rocky Mountain oil XL project requires the pipeline to increase U.S. oil
markets. Keystone XL could reduce Midwest and Rocky prices without affecting international prices. Tar sands
Mountain oil supplies by more than 20 percent while producers will have to pay larger pipeline fees to send
adding a fraction of a percent to global oil supplies. oil from Keystone XL to the Gulf of Mexico rather than
n In the highly unlikely event that additional Canadian the Midwest. TransCanada has stated that Keystone XL
supplies had a measurable impact on world oil prices, will increase the price of Canadian crude to equal the
Organization of the Petroleum Exporting Countries cost of Mexican Maya. Based on 2012 prices, that is an
(OPEC) has the power to reduce international oil supply increase of approximately $25 per barrel.a
accordingly. OPEC produces more than 30 million bpd
and already keeps an additional 2.5 million bpd off the
a Bloomberg, Western Canadian Select Crude Spot Oil, April 27, 2012, http://www.bloomberg.com/quote/
market. Were additional Canadian supplies to measurably USCRWCAS:IND; Bloomberg, Latin American Maya Crude Spot Oil, April 27, 2012, http://
decrease international prices, OPEC could take an www.bloomberg.com/quote/LACRMAUS:IND.
additional amount off the market to compensate.
Refiners that are unable to pass on higher crude oil costs to refineries to consider two responses: increase gasoline prices
consumers often do so by lowering the amount of crude they directly or increase gasoline prices indirectly by lowering
process.45 This has become the case with refineries on the their output or shutting down units, thereby decreasing
East Coast, where higher crude costs in recent years have led regional supply.
to refineries idling capacity and even considering closure.46
Relying on the international market for much of their crude Decreased Regional Gasoline Production
oil supply, East Coast refineries are paying the highest price Leads to Higher Gasoline Prices
in the nation for crude oil feedstocks. In 2011, these refineries Local gasoline supplies are reduced when refineries, due to
paid nearly $10 a barrel above the national average.47 The higher crude oil costs, reduce their output or shut down. This
costs are being passed on to East Coast consumers, who requires gasoline to be shipped from more distant locations
pay some of the highest gasoline prices in the country. East that have excess, or marginal, gasoline supplies. Acquiring
Coast refineries have not been able to pass on all the costs, these additional supplies requires that consumers pay a
however. In recent years they have idled significant capacity premium to bid the additional gasoline away from other
and are currently running just above two-thirds of operable markets that may also be under-supplied. In addition to this
capacity.48 Several major East Coast refineries have been so premium, consumers must pay added transportation costs to
compromised by these economic conditions that their long- have the gasoline shipped from a distant location.
term viability is in question.49
There are increasingly limited volumes of excess gasoline
Rising crude oil prices in the Midwest and the Rockies is likely supplies in the Gulf Coast. Competing with other markets
to put pressure on refinery operations, which are currently currently purchasing these gasoline supplies, notably Latin
configured to maximize gasoline production. These refineries America, requires paying higher gasoline prices. In the case
have been insulated from higher international crude prices of the East Coast, which already imports gasoline from
by their access to discounted Canadian crudes. Gulf Coast Gulf refineries, importing additional gasoline supplies will
refineries, which have been affected by higher crude costs, require paying higher prices. As the Energy Information
have compensated by decreasing their gasoline output, Administration (EIA) explains “higher price differentials
increasing their diesel production and exploiting higher for wholesale products compared with the Gulf Coast and
prices overseas. Unlike Gulf Coast refineries, Midwestern markets abroad would have to occur to incentivize producers
and Rocky Mountain refineries do not have access to the to send more products to the Northeast.”51 In other words,
international market and therefore have not been able to if the East Coast, or any other region in the United States,
profit from higher international diesel prices in the way that requires additional gasoline from the Gulf Coast, they will
Gulf Coast refineries have.50 The higher crude costs that come have to compete with the international market—and that
along with the Keystone XL tar sands pipeline will force these means consumers pay higher prices for gasoline.
|
PAGE 9 Keystone XL: A Tar Sands Pipeline to Increase Oil Pricesshows that in addition to the higher well-to-wheel emissions
Why Are Gasoline Prices Lower in the Rocky of tar sands, the destruction of the Boreal forest substantially
Mountain States? increases the carbon impacts of tar sands production.53 The
Gasoline prices in the Rocky Mountain states of Idaho, study estimates the elimination of peatlands from tar sands
Montana, Utah, and Colorado are lower than those in the extraction will release up to 175 million metric tons of carbon
rest of the country. In fact, in the first months of 2012, dioxide (CO2) and reduce carbon sequestration by up to 26
these states enjoyed the lowest gasoline prices in the million metric tons a year.54 The debate about the Keystone
country—up to 50 cents below the national average.a XL tar sands pipeline is not just a question about a single
Refineries in the Rocky Mountains rely on imports of piece of standalone infrastructure. Ultimately, it is a question
Canadian crude and production from North Dakota. When about our energy future, our water, and our climate. Tar sands
the cost of the crude oil dropped for these refineries, so producers hope to increase the rate at which they extract this
did the price of the gasoline they produced.b dirty fuel many times over in coming decades. By increasing
the price of tar sands crude, Keystone XL facilitates this goal by
Rocky Mountain states were able to sell gasoline at dramatically increasing the financial incentives for investment
lower prices than were other parts of the country in tar sands production on the backs of American consumers.
because their refineries were able to buy crude at
substantially lower prices. While oil prices in the Rockies Tar sands expansion is inconsistent with our nation’s
were still high by historical standards—averaging $88 per commitment to addressing climate change. The United
barrel in 2011—they were substantially below the world States should not approve infrastructure projects that enable
market price of $111 per barrel.c If Keystone XL moves the continued expansion of a resource that gives ground on
forward, oil prices in the Rockies will increase along many of the country’s hard won accomplishments in fighting
with prices in the Midwest as refineries in both regions climate change. The fact that Keystone XL will increase
compete with higher international oil prices at the Gulf
gasoline prices in many parts of the United States and
Coast. Refineries will no longer be able to afford to offer
decrease the country’s dedicated oil supplies give one more
consumers discounts for gasoline.
reason that Keystone XL is not in the national interest.
a
EIA, Gasoline and Diesel Fuel Update, April 23, 2012, http://www.eia.gov/petroleum/gasdiesel/
b
EIA, Retail gasoline prices in the Rocky Mountains fall as U.S. average prices rise – Today in Energy,
Feb. 12, 2012, http://www.eia.gov/todayinenergy/detail.cfm?id=4990
c
EIA, 2011 Brief: Brent crude oil averages over $100 per barrel in 2011, Jan. 12, 2012,
http://www.eia.gov/dnav/pet/pet_pri_rac2_dcu_r40_a.htm
Canadian Consumers Will Not Benefit From
Keystone XL
Tar Sands Oil is No Bargain Keystone XL will not bring lower gasoline prices to
Clearly, the Keystone XL tar sands pipeline will not ease Canadian consumers either. In fact, in its testimony
consumers’ pain at the pump. However, Keystone XL’s impact before Canada’s National Energy Board, TransCanada’s
representative predicted that Keystone XL would increase
on U.S. gasoline prices is not the tar sands pipeline’s most
oil prices in Ontario and Western Canada, in addition to the
critical flaw. Although the scope and subject of this brief
United States.
is to evaluate Keystone XL’s likely impact on U.S. gasoline
prices, the larger issue is that the pipeline would lead to the Q: So, first of all, this “strategy” as you call it, would
expansion of tar sands crude extraction in Alberta, Canada. be intended to raise the crude price not only in PADD II
Tar sands crude, or bitumen, is a dirty fuel source. Its [U.S. Midwest] but also in Ontario; right?
extraction is significantly more destructive than conventional
crude, processing it is more energy intensive and burning it Mr. Wise (representing TransCanada): “Yes, it would raise it
emits significantly more greenhouse gases. in Ontario and in Western Canada.” National Energy Board
Hearing, September 17, 2009 a
Continued expansion of the tar sands undermines many
of the initiatives the United States has been successfully While the impacts of higher oil prices in Canada are outside
promoting to reduce carbon emissions and intensity. The the scope of this report, higher crude oil costs in Canada
Environmental Protection Agency (EPA ) projects that will likely increase pressure on gasoline prices for Canadian
consumers, who paid an average of $4.89 a gallon for
replacing 900,000 bpd of conventional oil with the same
gasoline in 2012.b Tar sands are not the answer to high
amount of tar sands from Keystone XL would increase U.S.
gasoline prices in either the United States or Canada.
annual carbon emissions by 27 million metric tons—the
equivalent of adding 6 million cars on the road.52 a
National Energy Board Hearing, Volume 3, September 17, 2009, Lines 3721-3722, https://www.neb-one.
gc.ca/ll-eng/Livelink.exe/fetch/2000/90464/90552/418396/550305/570526/570650/A1L3V6_-_Vol.3-Thu
Sep17.09?nodeid=570651&vernum=0&redirect=3
In addition to the increased carbon emissions from getting b
Average Canadian gasoline prices from January 1, 2012 to May 1, 2012 were $1.29 a liter or $4.89 a
gallon; during that time, American and Canadian dollars have been roughly at parity. Natural Resources
tar sands out of the ground, the environmental destruction Canada, Average Retail Fuel Prices in Canada, May 2, 2011, http://www2.nrcan.gc.ca/eneene/sources/
of the Boreal forest in Alberta due to tar sands extraction is pripri/prices_byfuel_e.cfm; Bank of Canada, Monthly and Annual Exchange Rates, May 2, 2012, http://
www.bankofcanada.ca/rates/exchange/exchange-rates-in-pdf/.
creating significant additional carbon emissions. A new study
in the Proceedings of the National Academy of the Sciences
|
PAGE 10 Keystone XL: A Tar Sands Pipeline to Increase Oil PricesOil Demand Reduction more efficient; supporting policies that result in better public
transportation and community planning; and reducing oil
Is the Best Energy Policy
demand in aviation, rail, marine, and other non-highway
Fortunately, the better option for reducing how much transportation equipment, as well as in industrial processes
consumers pay at the pump is reducing the number of times and building heat.
they have to visit the pump. The United States has already
made great strides to reduce both the price Americans pay for The United States has already taken a major step in the
every mile they travel as well as the number of miles they have right direction. In 2011, the EPA and the U.S. Department of
to travel to get where they need to go. Even as gasoline prices Transportation proposed new rules for passenger cars and
reach record highs, fuel efficiency standards have ensured light trucks that will result in new vehicles with nearly double
that the price drivers pay per mile have not. At the same time, the fuel efficiency of today’s fleet. 55 This measure alone will
in part due to smart growth and public transit initiatives, reduce U.S. dependence on oil by 1.7 million barrels per
in recent years the number of vehicle miles travelled has day by 2030. That is more than two-times what Keystone XL
declined. The United States can do even more today to reduce would carry at full capacity.56 Not only that, they are expected
the impact expensive oil such as tar sands has on our economy to save U.S. car owners $4,400 over the life of their vehicles.57
over the next two decades. In the process, U.S. citizens could
reap the economic bounty as our nation manufactures and In the long term, the Keystone XL tar sands pipeline
exports clean solutions to oil dependence. represents the wrong direction for a country at an energy
crossroads. The national debate surrounding Keystone XL
Adopting a series of oil savings policies would reduce U.S. is about being mindful of the sort of energy future we want
oil consumption and imports by 5.7 million bpd in 20 years for our country. There is a different route that can reduce
(see table 3: The United States Can Dramatically Reduce Its our dependence on oil and its rising prices. This route saves
Dependence on Oil With An Oil Savings Plan). That is more American consumers hundred of billions of dollars at the
oil than Canada is expected to produce in the future and pump. It is a route that takes us to millions of new jobs
more than twice as much as it produces now. These measures and clean air benefits, making our nation a leader in the
include continuing ongoing efforts to make our vehicles international clean energy market.
Table 3: The United States Can Dramatically Reduce Its Dependence on Oil With An Oil Savings Plan
Clean Energy Potential Oil Savings in
Description
Measures 2030 (million bbl/d)
Automobile Efficiency, New-vehicle fuel economy and emissions standards reach 54.5 miles per gallon (mpg) and
Carbon Pollution 163 gCO2 per mile in 2025 and then improve at about 2 percent per year through 2030. Plug-in
2.0
Standards, and Vehicle electric vehicles reach at least 15 percent of new sales by 2030. Existing standards for model
Electrification year 2016 are included in the baseline.
Truck Efficiency and
Fuel-efficiency and emission standards for new medium- and heavy-duty trucks increase from
Carbon Pollution 0.7
about 6 mpg to 10 mpg by 2030; SmartWay retrofits are applied to existing on-road trucks.
Standards
Natural gas displaces approximately 4 billion gallons of diesel fuel in heavy trucks; biofuels
Cleaner Fuels for Vehicles production as projected by the U.S. Energy Information Administration (EIA) are included in 0.3
the baseline and therefore excluded here.
Better community planning and greater public transit investments reduce the rate of increase
Reformed Transportation in light-duty vehicle miles traveled to achieve a 30 percent reduction from EIA light-duty
1.1
Investment mileage forecast by 2030. Freight-truck vehicle miles traveled drops by 5 percent from 2030
forecast levels.
Fuel-efficient replacement tires and motor oil are used in existing automobiles; oil
consumption by non-road vehicles is reduced by an average of 30 percent through air travel
Other 1.6
and equipment-efficiency improvements; efficiency of oil-heated buildings and industrial
processes is improved to cut consumption in those sectors by 10 percent.
Total Potential Oil
Saved 5.7
|
PAGE 11 Keystone XL: A Tar Sands Pipeline to Increase Oil PricesEndnotes
14 With a gasoline yield of 40.8 percent, a 42 gallon barrel of
1 TransCanada, Western Canadian Crude Supply and Markets. crude will produce approximately 17.1 gallons of gasoline. EIA,
February 12, 2009. Application to the National Energy Board Refining District Texas Gulf Coast Refinery Yield of Finished
(February 2009), Appendix 3-1, at 28, https://www.neb-one.gc.ca/ll- Motor Gasoline, http://www.eia.gov/dnav/pet/hist/LeafHandler.
eng/livelink.exe?func=LL.getlogin&NextURL=%2Fll-eng%2Flivelink. ashx?n=PET&s=MGFRY3B3&f=M.
exe%3Ffunc%3Dll%26objId%3D549324%26objAction%3DOpen.
15 From March 2011 to February 2012, Midwestern (PADD II) and
2 In 2008, the U.S. consumed 9 million bpd of gasoline and 3.9 million Texas Gulf refineries had gasoline yields of 50.4 percent and 40.8
bpd of diesel. EIA, International Energy Statistics, http://www.eia. percent respectively. This yield difference results in 79,700 bpd
gov/cfapps/ipdbproject/iedindex3.cfm?tid=5&pid=65&aid=2&cid=r less gasoline for 830,000 bpd product processed. EIA, Crude Input
egions&syid=2006&eyid=2009&unit=TBPD. U.S. Energy Information Qualities, April 30, 2012, http://www.eia.gov/dnav/pet/pet_pnp_
Administration, Increasing Distillate Production at U.S. Refineries – crq_dcu_nus_m.htm.
Past Changes and Future Potential, Oct. 2010, pg. 9-13, ftp://ftp.eia.
doe.gov/features/distillateprod.pdf. 16 International Business Times, “Gas Prices Rising 2012: Diesel Exports
May Drive Them Higher”, March 29, 2012, http://www.ibtimes.com/
3 In 2008, non-U.S. markets used 20.9 million bpd of diesel and 12.3 articles/321578/20120329/gas-prices-rising-2012-america-diesel-
million bpd of gasoline. EIA, International Energy Statistics, http:// fuel.htm.
www.eia.gov/cfapps/ipdbproject/iedindex3.cfm?tid=5&pid=65&aid
=2&cid=regions&syid=2006&eyid=2009&unit=TBPD. 17 National Energy Board, Total Crude Exports 2011, http://www.
neb-one.gc.ca/clf-nsi/rnrgynfmtn/sttstc/crdlndptrlmprdct/2011/
4 U.S. Energy Information Administration, Increasing Distillate ttlcrdlxprt2011.xls.
Production at U.S. Refineries – Past Changes and Future Potential,
Oct. 2010, pg. 9, ftp://ftp.eia.doe.gov/features/distillateprod.pdf. 18 Canadian Association of Petroleum Producers (CAPP), Crude Oil,
Forecast, Market & Pipelines, June 2011, pg. 28, http://www.capp.
5 In 2000, Gulf refineries produced 45 percent of U.S. gasoline output. ca/forecast/Documents/190838-2011-2025_CAPP_Crude_Oil_
Their exports totaled less than 10 percent of their output and were Forecast__Markets_Pipeline_Report.pdf.
comprised primarily of coke, residual fuel oil and other refinery
byproducts. EIA, Refiner and Blender Net Production, July 28, 2011, 19 Western Canadian export pipeline capacity is over 4.2 million bpd.
http://www.eia.gov/dnav/pet/pet_pnp_refp_dc_r30_mbblpd_a. By 2015, the Canadian Association of Petroleum Producers expects
htm; EIA, Export, Gulf Coast (PADD 3), July 28, 2011, http://www. local Western Canadian refinery capacity to have increased to over
eia.gov/dnav/pet/pet_move_exp_dc_R30-Z00_mbblpd_a.htm. 0.6 million bpd. To exceed its existing pipeline capacity, western
Canadian provinces would need to reach 4.8 million bpd – a figure
6 http://www.eia.gov/energyexplained/index.cfm?page=diesel_prices they are not anticipated to reach after 2025. To fill Keystone XL’s
830,000 bpd, western Canada’s production would need to exceed
7 Ibid. 5.6 million bpd, including 500,000 bpd of conventional crude
and 5.1 million bpd of tar sands. CAPP, Crude Oil, Markets, &
8 EIA Texas Gulf Coast refinery yields 2002-2011, http://www.eia.gov/ Pipelines, June 2010, pg. 27; EnSys Energy & Systems, Inc. Keystone
dnav/pet/hist/LeafHandler.ashx?n=PET&s=MGFRY3B3&f=A. XL Assessment – Final Report. p. 30. December 23, 2010, http://
www.keystonepipeline-xl.state.gov/clientsite/keystonexl.nsf/
9 Gulf Coast refineries historically provided the majority of gasoline AssmtDrftAccpt.pdf.
on the U.S. market. This position eroded as Gulf Coast refineries
configured their operations to maximize diesel production 20 NRDC, Keystone XL Pipeline: Undermining U.S. Energy Security
and refined product exports – in 2011, the Midwest produced and Sending Tar Sands Overseas, January 2012, pg. 2, http://www.
more gasoline than the Gulf Coast. EIA, Refinery & Blender Net nrdc.org/energy/files/kxlsecurity.pdf.
Production, Jul 28, 2011, http://www.eia.gov/dnav/pet/pet_pnp_
refp_dc_nus_mbbl_m.htm. 21 EIA, Export, Gulf Coast (PADD 3), July 28, 2011, http://www.eia.gov/
dnav/pet/pet_move_exp_dc_R30-Z00_mbblpd_a.htm.
10 U.S. Energy Information Administration, Increasing Distillate
Production at U.S. Refineries – Past Changes and Future Potential, 22 The U.S. exported 1.6 million bpd of gasoline and diesel in the
Oct. 2010, pg. 9, ftp://ftp.eia.doe.gov/features/distillateprod.pdf. fourth quarter of 2011—of that, Texas Gulf refineries accounted
for 920,000 bpd, or 55 percent ,Communication with U.S. Energy
11 The Gulf Coast exported 1.85 million bpd of refined products in Information Administration.
2011, of which over 1 million bpd was diesel and gasoline. These
exports comprised 22 percent of PADD 3’s 4.47 million bpd total 23 In 2011, PADD 2 refineries processed 4.1 million bpd. During
gasoline and diesel production. EIA, Exports, Gulf Coast (PADD 3), the same time, their exports of finished petroleum products
Jan. 30, 2012, http://www.eia.gov/dnav/pet/pet_move_exp_dc_ averaged 45,000 bpd. EIA, Refiner and Blender Net Production,
R30-Z00_mbblpd_m.htm. July 28, 2011, http://www.eia.gov/dnav/pet/hist/LeafHandler.
ashx?n=PET&s=MTTRPP22&f=M. EIA, Exports, Midwest (PADD 2),
12 In 2011, Gulf Coast refinery gasoline yields were only 41.0 percent in July 28, 2011, http://www.eia.gov/dnav/pet/pet_move_exp_dc_
Texas Gulf Coast and 41.6 percent in all of PADD 3, vs. 50.6 percent R20-Z00_mbblpd_m.htm.
in the Midwest (PADD 2), and between 46 percent and 48 percent
elsewhere (PADD 1, 4, and 5), EIA, Refinery Yield, http://www.eia. 24 Of the 45,000 bpd exported from PADD 2 refineries in 2011, only
gov/dnav/pet/PET_PNP_PCT_A_EPM0F_YRY_PCT_A.htm. 9,000 bpd included gasoline or diesel, with the remaining primarily
comprised of coke, residual fuel oil and asphalt. EIA, Exports,
13 With a gasoline yield of 51.2 percent, a 42 gallon barrel of crude Midwest (PADD 2), July 28, 2011, http://www.eia.gov/dnav/pet/
will produce approximately 21.5 gallons of gasoline. EIA, Refining pet_move_exp_dc_R20-Z00_mbblpd_m.htm.
District Minnesota-Wisconsin-North Dakota–South Dakota Refinery
Yield of Finished Motor Gasoline, http://www.eia.gov/dnav/pet/
hist/LeafHandler.ashx?n=PET&s=MGFRY2B3&f=M.
|
PAGE 13 Keystone XL: A Tar Sands Pipeline to Increase Oil Prices25 In 2011, PADD 2 refineries produced 3.2 million bpd of gasoline exe/fetch/2000/90464/90552/418396/550305/556487/549220/B-
and diesel. During the same time, their exports gasoline and 1f_-_Supply_and_Markets_(Tab_3)_incl._Appendix_3.1_-_
diesel exports averaged 9,000 bpd. EIA, Refiner and Blender Net A1I9R7?nodeid=549324&vernum=0.
Production, July 28, 2011, http://www.eia.gov/dnav/pet/hist/
LeafHandler.ashx?n=PET&s=MTTRPP22&f=M. EIA, Exports, 35 TransCanada Keystone Pipeline GP Ltd., Western
Midwest (PADD 2), July 28, 2011, http://www.eia.gov/dnav/pet/ Canadian Crude Supply and Markets, Feb. 12, 2009, pg.
pet_move_exp_dc_R20-Z00_mbblpd_m.htm. 29 https://www.neb-one.gc.ca/ll-eng/livelink.exe/fet
ch/2000/90464/90552/418396/550305/556487/549220/B-
26 Bill Klesse, Bank of America, Merrill Lynch Refining Conference, 1f_-_Supply_and_Markets_(Tab_3)_incl._Appendix_3.1_-_
March 6, 2012. A1I9R7?nodeid=549324&vernum=0.
27 Bloomberg, Western Canadian Select Crude Spot Oil, April 27, 2012, 36 Keystone XL’s 830,000 bpd would add to existing 4.2 million
http://www.bloomberg.com/quote/USCRWCAS:IND; Bloomberg, bpd of pipeline capacity, creating over 5 million bpd of pipeline
Latin American Maya Crude Spot Oil, April 27, 2012, http://www. capacity. In 2010, Canada exported less than 1.9 million bpd.
bloomberg.com/quote/LACRMAUS:IND. Canadian Association of Petroleum Producers, Crude Oil, Forecast,
Markets, Pipelines, June 2011, ii, http://www.capp.ca/forecast/
28 TransCanada Keystone Pipeline GP Ltd., Western Documents/190838-2011-2025_CAPP_Crude_Oil_Forecast__
Canadian Crude Supply and Markets, Feb. 12, 2009, pg. Markets_Pipeline_Report.pdf.
26 https://www.neb-one.gc.ca/ll-eng/livelink.exe/fet
ch/2000/90464/90552/418396/550305/556487/549220/B- 37 Western Canadian production is expected to reach 4.6 million bpd
1f_-_Supply_and_Markets_(Tab_3)_incl._Appendix_3.1_-_ in 2025, Ibid.
A1I9R7?nodeid=549324&vernum=0.
38 EnSys, Keystone XL Assessment Prepared for Department of Energy,
29 TransCanada Keystone Pipeline GP Ltd., Western Final Report, Dec. 23, 2010, pg. 58.
Canadian Crude Supply and Markets, Feb. 12, 2009, pg.
28 https://www.neb-one.gc.ca/ll-eng/livelink.exe/fet 39 Ibid.
ch/2000/90464/90552/418396/550305/556487/549220/B-
1f_-_Supply_and_Markets_(Tab_3)_incl._Appendix_3.1_-_ 40 Ibid.
A1I9R7?nodeid=549324&vernum=0.
41 EnSys, Keystone XL Assessment Prepared for Department of Energy,
30 TransCanada, Western Canadian Crude Supply and Final Report, Dec. 23, 2010, pg. 113-114.
Markets: Supplemental Report. June 18, 2009. Application
to the National Energy Board, Appendix 1-A, at 9. 42 EIA, “What we pay for in a regular gallon of gasoline,” March 11,
https://www.neb-one.gc.ca/ll-eng/livelink.exe/fet 2011, http://www.eia.gov/todayinenergy/detail.cfm?id=470.
ch/2000/90464/90552/418396/550305/556487/549220/B-
1f_-_Supply_and_Markets_(Tab_3)_incl._Appendix_3.1_-_ 43 EIA, International Petroleum (Oil) Prices, Weekly (Monday) Retail
A1I9R7?nodeid=549324&vernum=0. Diesel Prices, Selected Country, Prices Excluding Taxes, January 1,
1996-Present, http://www.eia.gov/emeu/international/oilprice.
31 TransCanada Keystone Pipeline GP Ltd., Western html,
Canadian Crude Supply and Markets, Feb. 12, 2009, pg.
26 https://www.neb-one.gc.ca/ll-eng/livelink.exe/fet 44 In February 2012, Midwestern and Rocky Mountain refineries
ch/2000/90464/90552/418396/550305/556487/549220/B- processed 4.1 million bpd of crude, of which 2.2 million bpd was
1f_-_Supply_and_Markets_(Tab_3)_incl._Appendix_3.1_-_ sourced from Canada. EIA, PAD District Imports by Country of
A1I9R7?nodeid=549324&vernum=0. Origin, April 27, 2012, http://www.eia.gov/dnav/pet/pet_move_
impcp_a2_r10_ep00_ip0_mbbl_m.htm; EIA, Refinery & Blender Net
32 Bloomberg, Western Canadian Select Crude Spot Oil, April 27, 2012, Input, April 27, 2012, http://www.eia.gov/dnav/pet/pet_pnp_inpt_
http://www.bloomberg.com/quote/USCRWCAS:IND; Bloomberg, dc_nus_mbbl_m.htm,
Latin American Maya Crude Spot Oil, April 27, 2012, http://www.
bloomberg.com/quote/LACRMAUS:IND. 45 EIA, Regional differences for cost of crude oil to refiners widened
in 2011, April 6, 2011, http://www.eia.gov/todayinenergy/detail.
33 Bloomberg, Western Canadian Select Crude Spot Oil, April 27, 2012, cfm?id=5730.
http://www.bloomberg.com/quote/USCRWCAS:IND; Bloomberg,
Latin American Maya Crude Spot Oil, April 27, 2012, http://www. 46 Ibid.
bloomberg.com/quote/LACRMAUS:IND.
47 Ibid.
34 TransCanada estimated that the $3 a barrel discount that tar
sands received relative to Mexican Maya in the Gulf Coast cost 48 EIA, Refinery utilization rates react to economics in 2011, March 20,
tar sands producers $1.8 billion a year. Keystone XL was expected 2012, http://www.eia.gov/todayinenergy/detail.cfm?id=5470.
to eliminate that discount as well as increase prices for tar sands
in the Midwest by another $3.55 by diverting tar sands supplies 49 EIA, Potential Impacts of Reductions in Refinery Activity on
away—netting an additional $1.6 billion. Tar sands are now Northeast Petroleum Product Markets, Feb. 2012, http://www.eia.
selling at a $18 to $43 a barrel discount. According to Purvin & gov/analysis/petroleum/nerefining/update/.
Gurtz’s analysis, eliminating that discount increase revenue at the
Gulf Coast by between $10.8 billion and $25.8 billion a year. The 50 EIA, Retail gasoline prices in the Rocky Mountains fall as U.S.
additional $3.55 per barrel price premium for tar sands in the average prices rise – Today in Energy, Feb. 12, 2012, http://www.eia.
Midwest would be expected to remain similar in both scenarios – gov/todayinenergy/detail.cfm?id=4990
netting an additional $1.6 billion a year for producers. TransCanada,
Western Canadian Crude Supply and Markets: Supplemental
Report. June 18, 2009. Application to the National Energy Board,
Appendix 1-A, at 5. https://www.neb-one.gc.ca/ll-eng/livelink.
|
PAGE 14 Keystone XL: A Tar Sands Pipeline to Increase Oil Prices51 EIA, Reductions in Northeast Refining Activity: Potential
Implications for Petroleum Product Markets, Dec. 2011,
http://www.eia.gov/analysis/petroleum/nerefining/prelim/.
52 Environmental Protection Agency, Comments regarding the Draft
Environmental Impact Statement for Keystone XL, June 16, 2010, pg.
2, http://www.sierraclub.org/environmentallaw/tarsands/pipeline-
keystone-xl/state-dept-permit-process/EPA%20Comments%20
on%20DEIS%2010-7-16.pdf.
53 Rebecca Rooney, Oil sands mining and reclamation cause massive
loss of peatland and stored carbon, Proceedings of the National
Academy of Sciences, Nov. 3, 2011, http://www.pnas.org/content/
early/2012/03/06/1117693108.full.pdf+html?sid=ef516cad-3bdf-
43c3-9093-bd598712f3f7.
54 Rebecca Rooney, Oil sands mining and reclamation cause massive
loss of peatland and stored carbon, Proceedings of the National
Academy of Sciences, Nov. 3, 2011, http://www.pnas.org/content/
early/2012/03/06/1117693108.full.pdf+html?sid=ef516cad-3bdf-
43c3-9093-bd598712f3f7.
55 U.S. Environmental Protection Agency, EPA and DOT Propose Next
Phase in Historic National Program for Light-duty Vehicles, Nov. 16,
2011.http://www.epa.gov/otaq/climate/regulations.htm.
56 Ibid.
57 Ibid.
|
PAGE 15 Keystone XL: A Tar Sands Pipeline to Increase Oil PricesYou can also read


