Australian 2 - Rural Bank
←
→
Page content transcription
If your browser does not render page correctly, please read the page content below
2021   Australian
       agriculture
       outlook
Executive summary
                Cattle                                                Cropping                                           Dairy
                Softening restocker                                   Australia is in a good                             Lower cost of production
                demand and global                                     position to capitalise on                          will promote supply growth
                pressures to see prices                               increased production and                           and aid profitability.
                ease in 2021.                                         strong prices.

                Horticulture                                          Sheep                                              Wool
                Key challenges are being                              Improved seasonal                                  Conditions for increased
                managed. Increased                                    conditions to support                              production and a recovery
                supply expected to be met                             sheep producers despite                            in prices will support
                with strong demand.                                   lower lamb prices.                                 Australian wool producers.

 When we celebrated the start of a new decade in January no one could           RCEP will likely provide non-tariff advances in trade relationships
 have predicted the year to come. The second half of 2020 has been just         between the listed countries. For Australia it’s an opportunity to deepen
 as eventful as the first for agriculture, with second waves of COVID-19,       ties with alternative markets, decreasing our reliance on China.
 escalating trade tensions between Australia and China, the United
                                                                                The COVID-19 pandemic appears far from over, however there
 States presidential election and widespread rainfall interrupting harvest.
                                                                                are promising signs for Australia as restrictions ease and domestic
 Rural Bank’s Australian Agriculture Outlook looks at the driving forces        foodservice demand returns. There are broader economic concerns as
 affecting agricultural markets, focusing on the future of supply, demand       a result of the pandemic, which include the level of business investment,
 and price. Examining what lies ahead in the next six months, the Outlook       the rate of easing restrictions, future outbreaks, the new US President,
 covers agriculture by commodity, providing farmers with expert analysis        the movement of the Australian dollar, labour shortages and a reduced
 of the current environment and importantly, what could come next.              amount of air freight. Food security concerns driven by COVID-19
                                                                                will likely continue to cause commodity price fluctuations which could
 In our 2020 mid-year Outlook we highlighted three key themes
                                                                                provide mixed fortunes for Australian agriculture.
 which would shape agriculture in the second half of 2020 – seasonal
 conditions, trade relations and COVID-19. As we look to 2021, all three        At the farm gate level, 2021 will largely be positive from a supply point
 themes remain at the centre of this Outlook report.                            of view aided by water availability, access to feed and restocking efforts
                                                                                from 2020. Highlights from the analysis include Australia’s winter
 Favourable seasonal conditions in 2020 led to an increase in supply for
                                                                                crop production, which is expected to be 15 per cent above average,
 many commodities. We expect this increase in supply to carry into 2021,
                                                                                providing a larger exportable surplus compared to 2020. Milk production
 particularly for grain, dairy, horticulture and red meat. Wet conditions
                                                                                is expected to reach nine billion litres for the first time in three years.
 are expected to continue into 2021, providing mixed fortunes for
                                                                                While supply of wool is expected to increase in 2021, uncertainty
 agriculture. Increased rainfall over the summer poses a quality concern
                                                                                around demand and price will likely remain.
 for southern grain growers while the wetter conditions decrease the
 reliance on supplementary feed for the livestock industry. Overall, a          As an agricultural specialist lender, Rural Bank understands that issues
 wetter start to 2021 will be a positive for most industries.                   impacting farm business’ performance can evolve quickly and farmers
                                                                                are operating in a sometimes-unpredictable environment – which is why
 Trade relations between Australia and China have been in the spotlight
                                                                                we want to support the industry with a regular expert forecast.
 for much of 2020 and we expect this to continue in 2021. From lobster
 to wine to barley to beef, there is an emerging pattern of scrutiny
 and disruption to exporters which has the potential to impact other
 industries. Uncertainty caused by trade disputes can be enough to
 decrease commodity prices suddenly and dramatically.

 In addition to our relationship with China, Australia will look to
 further its relationships with 15 countries in the Indo-Pacific
 region after signing the Regional Comprehensive
 Economic Partnership (RCEP). China is
 included in RCEP, as is Japan, our
 second largest trading partner.

2                                                                      AUSTRALIAN AGRICULTURE OUTLOOK 2021
Economic outlook
The global recession caused by COVID-19, including the deliberate The level of fiscal and monetary policy support given to our economy
shutdown of economies to manage the pandemic has been devastating has certainly mitigated potential impacts, as has the effectiveness of
around the world, and for Australia. Our 7.25 per cent fall in gross health policy in containing the pandemic locally. This has built a bridge
domestic product (GDP) in the first half of 2020 was severe. The from the pre-pandemic economy to a ‘COVID-safe’ economy. The
impact was most evident in the hospitality and services sector, with their October Federal Budget, with its record level of policy support via tax
dependence on tourism and mobility, but all sectors of the economy cuts, wage subsidies and incentives for businesses to invest, has driven
were adversely impacted to varying degrees. Despite this record fall for an uplift in consumer sentiment and business confidence, although
a six-month period, our experience was more benign than most regions the COVID-safe economy will most likely continue to see elevated
around the world, with only several countries in Asia (such as China, unemployment (perhaps around 6.5 to 7.5 per cent), and subdued
South Korea and Taiwan) and Scandinavia (Norway and Finland) growth. Fortunately, both the Federal Government and the Reserve
faring better. Bank of Australia (RBA) have committed to continue to provide this
policy support, until the unemployment rate is back well below six per
cent. The RBA has cut the official cash rate to a record low 0.1 per cent
Australian dollar exchange rate and will not lift the rate until we approach ‘full employment’.
0.85
The next stage beyond a COVID-safe economy to a ‘post pandemic
0.80
economy’ will presumably require a vaccine that is both effective and
0.75 made widely available, after which a more sustainable recovery from
the recession can be expected. Until then, the unknown factors
AUD/USD
0.70 ahead include:
0.65 • The level of business investment, encouraged by policy incentives;
0.60 • How our trading relationship with China and other key partners
0.55 develop in the wake of the United States (US) Presidential election;
0.50 • The rate of reopening borders, both domestically and internationally
(perhaps via ‘travel bubbles’);
May 16
Aug 16
Nov 16
Feb 17
May 17
Aug 17
Nov 17
Feb 18
May 18
Aug 18
Nov 18
Feb 19
May 19
Aug 19
Nov 19
Feb 20
May 20
Aug 20
Nov 20
• Further COVID-19 developments, including fresh outbreaks and/or
vaccine progress;
Source: RBA
• Market dynamics, including the Australian Dollar, commodity prices
and equity markets.
The size of the economic contraction and the rise in unemployment
Government debt is forecast to rise sharply, however when
ultimately was less than feared six months ago. The jobless rate peaked
considering the low cost of this debt, it appears an ideal time to
at 7.5 per cent before a modest improvement to just below seven per
leverage our sovereign AAA credit rating, which remains intact since
cent, although recovery has been uneven throughout the third quarter
the Federal Budget.
of this year. Nationally the fall in payroll jobs was around nine per cent to
May, but now is only around four per cent behind pre-pandemic levels.
However, the ‘two-speed economy’ emerges when contrasting Victoria
(due to their second wave of COVID-19) to other states and territories.
3 AUSTRALIAN AGRICULTURE OUTLOOK 2021
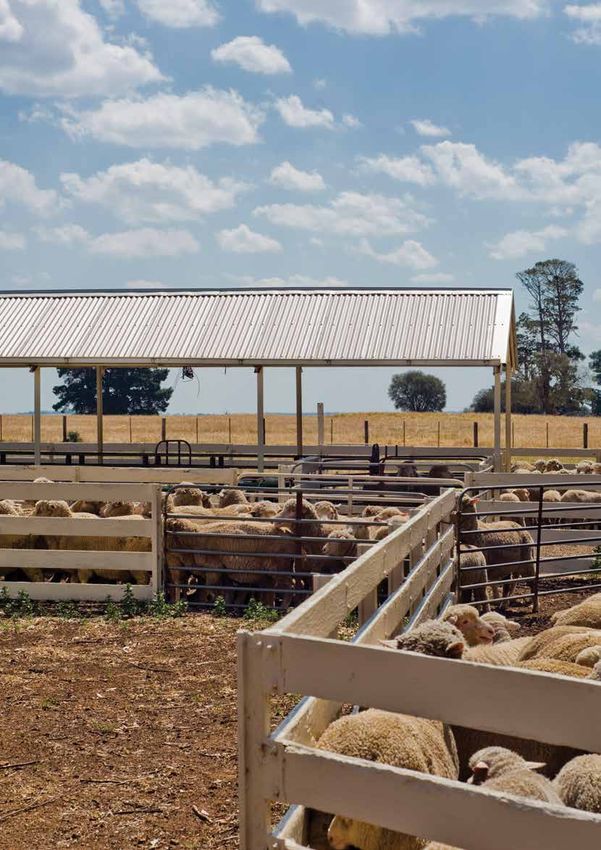
Cattle

    Australian cattle prices are expected to
    begin to ease in the first half of 2021
    from record highs once the strong
    restocker demand that underpinned
    prices in 2020 starts to soften. However,
    continued tight supply as herd rebuilding
    takes place will continue to provide a
    level of underlying support for prices.
    Donna Slevin, Rural Bank, Victoria

4                                        AUSTRALIAN AGRICULTURE OUTLOOK 2021
Cattle
Supply Price
Australian beef production to be lower than Eastern Young Cattle Indicator (EYCI) to begin
the first half of 2020 and remain well below to ease in 2021 from record highs.
average.
Demand Outlook
Restocker demand expected to soften Softening restocker demand and global
while consumer demand to improve but be pressures to see prices ease in 2021.
subdued.
Supply
Australian beef production is expected to remain below average in 2021 as
the effects of a 12 per cent decline in the national cattle herd over the last two Eastern Young Cattle Indicator forecast
1,000
years and producer intentions to retain stock keep supply tight. Beef production
is expected to be slightly lower year-on-year in the first half of 2021 due to 900
reduced slaughter rates, however this will be partially offset by heavier average 800
carcass weights. The national cattle herd is expected to begin to recover as herd 700
rebuilding activity from 2020 is expected to continue into the new year. 600
c/kg cwt
500
While Australian supply will remain tight, record high production in the US
400
and Brazil are expected to drive an increase in global beef production and
9.8
300
exports. Production growth in these countries is expected to translate to a more 5 YEAR
competitive global marketplace with Australian beef competing with cheaper 200 DECILE
Brazilian exports to China and US exports to Japan and South Korea. 100
0
Demand
Dec 15
Jun 16
Dec16
Jun 17
Dec 17
Jun 18
Dec 18
Jun 19
Dec 19
Jun 20
Dec 20
Jun 21
The outlook for beef demand remains uncertain to a large degree due to the
ongoing COVID-19 pandemic. It is likely that demand will be stronger in 2021
as Australia and most key export markets return closer to normal economic Monthly average EYCI values forecast at 68 per cent
confidence interval.
activity and foodservice trade, however lingering restrictions on foodservice
Source: Meat and Livestock Australia (MLA), Rural Bank
outlets will keep demand somewhat subdued compared to pre-COVID levels.
China will remain a key market for Australian beef unless there are further
impacts from the ongoing trade dispute between China and Australia.
However, China’s requirement for meat imports could begin to ease as China
rebuilds its pig herd as it recovers from the impacts of African Swine Fever Value of Australian beef exports
2,000
which may weaken demand for Australian beef. Brazil will continue to create
strong competition in China, while growth in Japan and South Korea will likely 1,800 2019
be captured by expanded US beef production. 1,600 2020
1,400
AUD (millions)
Price 1,200
Australian cattle prices are expected to begin to ease in the first half of 2021 1,000
as restocker demand slowly softens from the strong finish to 2020 which 800
underpinned the strength of Australian cattle prices. Restocker buyers will 600
remain active as many producers seek to continue rebuilding herds and utilise 400
paddocks which are generally still understocked, however demand is not 200
expected to be as strong as it was in late 2020 which could remove some 0
support for record high prices. Seasonal conditions will be an important factor Japan USA China South Indonesia Others
in the strength of restocker demand, particularly around the autumn break. Korea
The continuation of tight supply is expected to offer some support to high
January to September beef exports show year-on-year
prices and protect the market from a sharp decline that a competitive global
declines to all major markets except the US.
marketplace could otherwise cause as restocker demand eases. Source: Global Trade Atlas, Rural Bank
5 AUSTRALIAN AGRICULTURE OUTLOOK 2021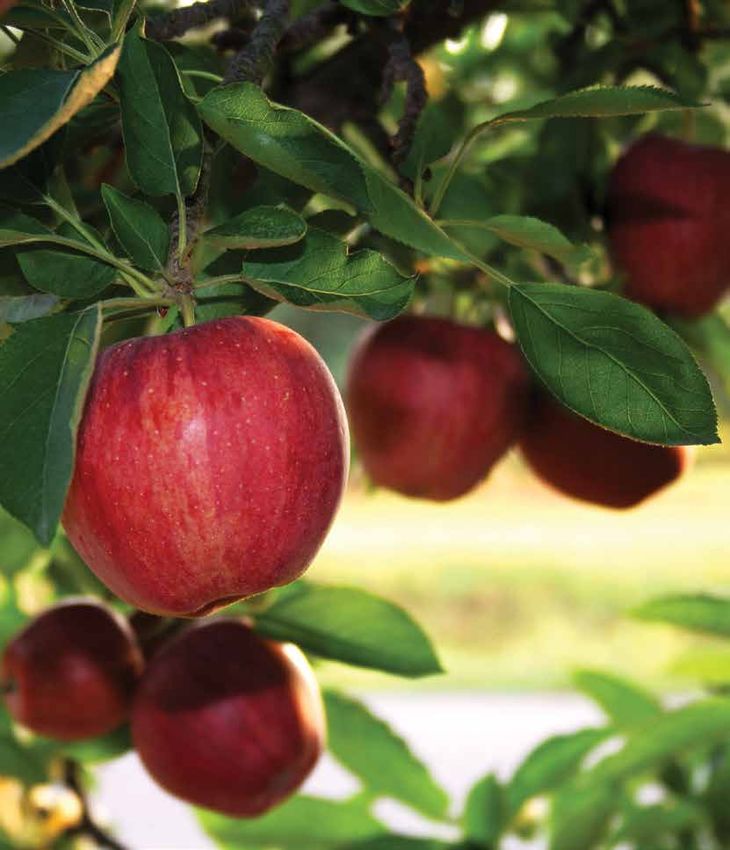
Cropping

    As harvest draws to a close, growers
    will direct focus towards grain prices
    which are expected to trend lower in the
    new year. Increased production will offer
    some the chance to store and market
    grain for a higher price, while others will
    elect to sell early to generate cashflow
    after a run of poor seasons. However,
    there are risks which will need to be
    managed such as quality concerns and
    uncertain export demand which may lead
    to softer grain prices.
    Greg Kuchel, Rural Bank, Victoria

6                                       AUSTRALIAN AGRICULTURE OUTLOOK 2021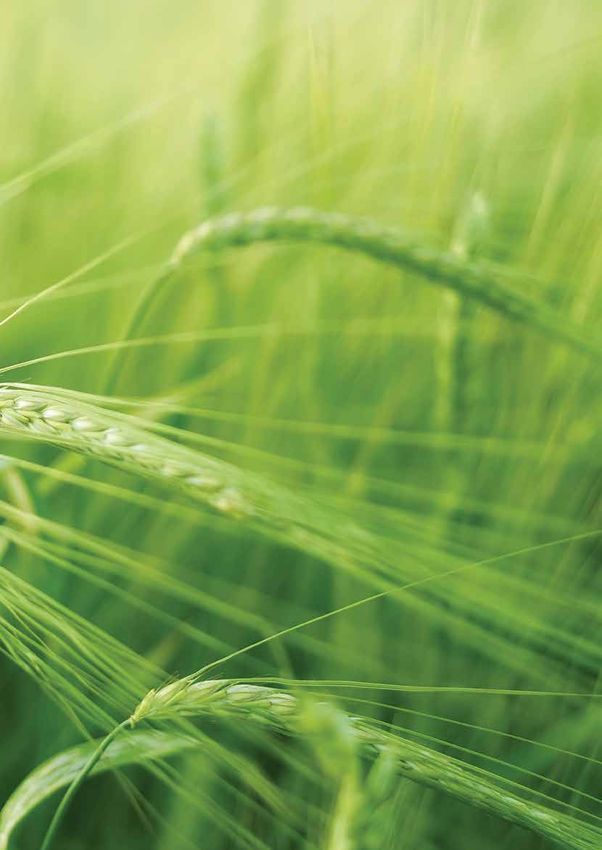
Cropping
                Supply                                                                      Price
                Australian winter crop production is likely to                              Prices are expected to remain relatively flat,
                be 15 per cent above average.                                               with some downside to cereal prices.

                Demand                                                                      Outlook
                Wheat export demand is forecast to remain firm                              Australia is in a good position to capitalise on
                for the next six months. Barley is expected to                              increased production and strong prices.
                find new homes outside of China.

 Cereals
 Supply
 Winter cereal production in Australia is above average with year-on-year      While Chinese tariffs on Australian barley imports have pressured local
 production increasing in all states, though to a lesser extent in Western     prices, there are positive signs for Australian barley export demand
 Australia. Aided by an increased planted area as well as improved             in coming months. Strong Chinese demand has diverted sales of
 seasonal conditions, wheat production is expected to increase 84 per          competing barley exporters such as Canada and weaker prices make
 cent year-on-year, and 25 per cent above five-year averages to almost         Australian barley an attractive option into Middle Eastern nations,
 28 million tonnes. Wet springtime conditions in the eastern states has        South-East Asia, Japan and South Korea. There have already been
 resulted in a drawn-out harvest and reduced supply of milling wheat           new crop barley sales into Saudi Arabia and Japan this year which are
 grades. Australian barley production is estimated to have risen eight per     expected to be maintained in coming months. Thailand is expected to
 cent year-on-year, six per cent above average despite a year-on-year          see further growth in barley demand following the trend seen in recent
 reduction in planted area.                                                    years, and there is also potential growth in India. While all available
                                                                               exportable surplus is not expected to be consumed, Australian barley
 Global wheat production is forecast to record a modest one per cent
                                                                               exports are likely to surpass five million tonnes. This means it is likely to
 increase in the coming year. Production declines in wheat producing
                                                                               fall short of the five-year average of 5.9 million tonnes.
 areas such as the European Union (EU), Ukraine, Argentina and the US
 have been offset by increases in major producing nations of Russia, China
                                                                               Price
 and India. Of note is the fact that three of the top five wheat exporting
 regions over the past five years in the EU, United States and Ukraine are     Prices are expected to remain relatively flat in coming months, though
 expecting production declines, which suggests the global balance sheet        current values are strong and sit in the top 70 to 80 per cent of prices
 may be tighter than at first glance.                                          seen in the past 10 years. In recent years of low production, domestic
                                                                               demand has driven cereal prices but improved supply this year means
 Demand                                                                        Australian wheat prices will more closely align with world markets.

 Improved seasonal conditions reducing demand for supplementary                Chicago Board of Trade (CBOT) wheat futures rallied to five-year highs
 feeding and increased production will see domestic demand ease, but           in October as markets factored in a reduced EU crop, poor planting
 Australia is well positioned to capitalise on firm wheat export demand,       conditions in the northern hemisphere and the potential for Russian
 particularly for high protein grades. A 10 per cent year-on-year decline      export quotas to increase, with Australian prices following the upwards
 in domestic feed demand is driven by improved seasonal conditions, a          trend.
 smaller herd size and a shift to restocking reducing supplemental feed
                                                                               Local prices have come under pressure late in the year as growers
 requirements.
                                                                               in drought affected areas have been keen sellers. With northern
 Being a staple product for food and stockfeed in many countries, global       hemisphere production risk and firm export demand providing a
 demand for cereals has been relatively unaffected by the impacts of           baseline, we expect prices to remain flat with potential downside of
 COVID-19. Export demand for wheat has been strong and is expected             around five per cent on current values, as growers satisfy cashflow
 to remain firm through to July 2021 when northern hemisphere crops            requirements and selling slows in coming months.
 are harvested. Poor production in the EU has diverted Russian wheat
                                                                               Barley prices lost close to 20 per cent of their value, or around $50 per
 to destinations in Northern Africa. This has opened opportunities for
                                                                               tonne to sit slightly below the 10-year price average following China’s
 Australian wheat into China and South East Asian nations where
                                                                               announcement of tariffs in May 2020 and have tracked sideways since.
 Australia has lost market share in recent years due to low production
                                                                               There is limited upside to barley prices in coming months with the
 and high prices. Concerns around potential Chinese restrictions on
                                                                               expectation of prices remaining flat to five per cent lower, with plentiful
 importing Australian wheat would be significant if they came to pass,
                                                                               supply and markets outside of China unwilling to pay a premium.
 however loss in demand should be readily picked up by other demand
 points in South Eastern Asia and the Middle East. Reduced competition
 from China would potentially see increased demand from predominantly
 feed wheat consuming South East Asian and Middle Eastern nations
 which will be particularly important given increased Australian
 production of lower protein wheat.

7                                                                      AUSTRALIAN AGRICULTURE OUTLOOK 2021
Cropping
Geelong APW1 wheat price forecast Port Adelaide feed barley price forecast
500 450
450 400
400 350
350
300
AUD/tonne
AUD/tonne
300
250
250
200
200
150
150
100
50
5 YEAR
DECILE 5.1 100
50
5 YEAR
DECILE 5.2
0 0
Dec 15
Jun 16
Dec16
Jun 17
Dec 17
Jun 18
Dec 18
Jun 19
Dec 19
Jun 20
Dec 20
Jun 21
Dec 15
Jun 16
Dec16
Jun 17
Dec 17
Jun 18
Dec 18
Jun 19
Dec 19
Jun 20
Dec 20
Jun 21
Monthly average Geelong APW1 wheat values forecast Monthly average Port Adelaide feed barley values forecast
at 68 per cent confidence interval. at 68 per cent confidence interval.
Source: Profarmer Australia, Rural Bank Source: Profarmer Australia, Rural Bank
Kwinana canola price forecast Brisbane chickpea price forecast
700 1,400
600 1,200
500 1,000
AUD/tonne
AUD/tonne
400 800
300 600
200 400
100
5 YEAR
DECILE 9.9 200
5 YEAR
DECILE 1.0
0 0
Dec 15
Jun 16
Dec16
Jun 17
Dec 17
Jun 18
Dec 18
Jun 19
Dec 19
Jun 20
Dec 20
Jun 21
Dec 15
Jun 16
Dec16
Jun 17
Dec 17
Jun 18
Dec 18
Jun 19
Dec 19
Jun 20
Dec 20
Jun 21
Monthly average Kwinana non-GM canola values forecast Monthly average Brisbane chickpea values forecast at
at 68 per cent confidence interval. 68 per cent confidence interval.
Source: Profarmer Australia, Rural Bank Source: Profarmer Australia, Rural Bank
Oilseeds Pulses
Australian canola production is 18 per cent above average following Year-on-year production of chickpeas is up 139 per cent, field peas
year-on-year growth of 46 per cent to 3.6 million tonnes as production nine per cent, lentils six per cent and faba beans six per cent. Lupins are
improved in all states except Western Australia. predominantly grown in Western Australia and production has declined
eight per cent after a relatively dry growing season.
Reduced production in the EU and Ukraine has put Australia in the
box seat to fill demand over Canada, Australia’s biggest competitor for Demand for lentils in particular has been strong in the past six months as
canola exports. More than 90 per cent of Canadian canola is genetically India reduced import tariffs from 30 to 10 per cent which was originally
modified (GM) which excludes it due to strict EU policies on GM crops, slated to revert back in August but have been extended to all product
with Australia forecast to export over two million tonnes of canola to arriving by 31 December, 2020. Further, there is speculation India may
European countries. reduce a 60 per cent tariff on chickpea imports.
Strong demand through harvest provided support for canola prices The impacts of COVID-19 on the Indian population and economic
in the top 80 to 90 per cent of values over the past ten years and downturn has seen increased demand for staple foods such as
encouraged early selling. Prices have already come back from highs at chickpeas and lentils, which has reduced supply and increased prices.
the beginning of harvest, and prices are expected to hover between flat Increased Indian demand created competition with Bangladesh and
to 10 per cent lower with much of the crop already sold. Pakistan, Australia’s largest consumers of pulses, and supported prices
towards the end of the year. However, prices for chickpeas and lentils are
In terms of global oilseed markets more broadly, dry conditions in
expected to decline in coming months as harvest selling satiates export
major soybean producing nations Argentina and Brazil combined with
demand and the approach of the Indian harvest around March is likely to
strong Chinese demand for US stocks has supported soybean prices.
see tariffs reimposed.
A reduction in Chinese demand would ease prices but reduced carry
out in the US should provide price support for soybeans, and flow on to
other oilseed markets until the 2021 South American harvest in March.
8 AUSTRALIAN AGRICULTURE OUTLOOK 2021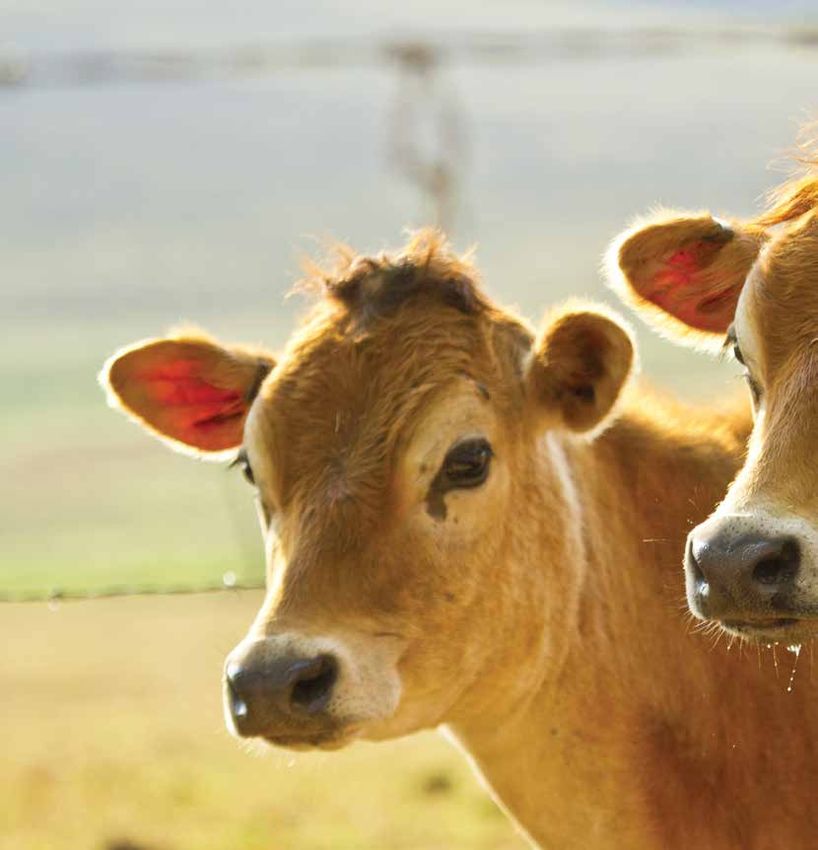
Dairy

    Milk supply will continue to climb higher relative
    to 2019/20 in most states led by Tasmania
    and Victoria. Supply will be driven by solid feed
    stocks heading into summer along with cheaper
    input costs for water and grain which will help
    to improve profitability in 2020/21. Global dairy
    prices are likely to face downward pressure
    from increased milk supply however this will
    be partially offset by importers prioritising food
    security. Domestic demand is expected to shift
    from supermarket to foodservices in Victoria,
    increasing demand for premium products such
    as soft cheese and butter.
    Josie Zilm, Rural Bank, Victoria

9                                      AUSTRALIAN AGRICULTURE OUTLOOK 2021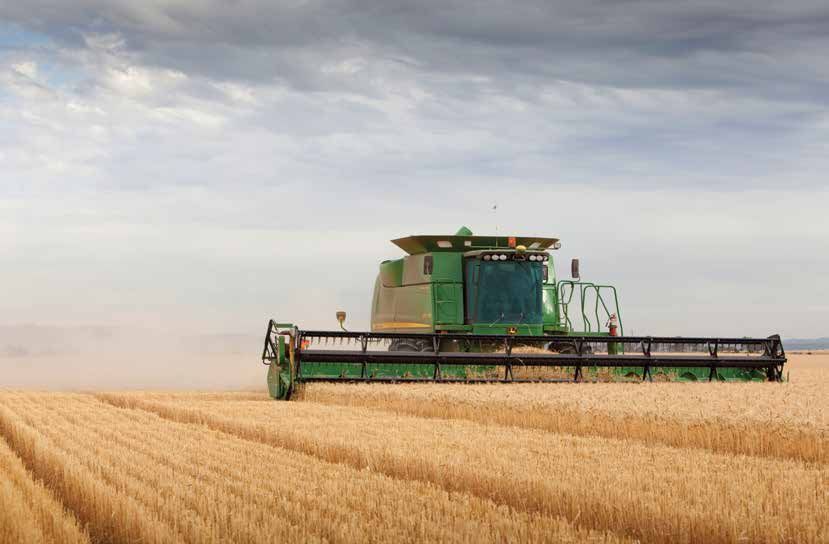
Dairy
Supply Price
Milk supply to increase by 3–4 per cent. Global milk production is expected to increase
keeping prices balanced.
Demand Outlook
Food security concerns will continue to support A lower cost of production will promote supply
demand for milk powder in the short term. growth and aid profitability.
Supply
Australian milk production is forecast to increase three to four per cent yoghurt as opposed to single serve consumption through foodservice
in 2020/21, pushing production above nine billion litres for the first time channels. As consumption via foodservice channels increases,
in three years. Tasmania is on track to achieve record milk production demand for premium dairy products such as soft cheeses and butter
in 2020/21 exceeding 950 million litres, eclipsing the record set in is likely to follow.
2019/20.
Increasing milk supply in Australia will provide a higher exportable
Large feed stocks combined with wet conditions over summer are surplus, which is likely to lead to growth in export value of four to five
expected to be conducive to increased summer milk supply across per cent for 2020/21.
southern states. In Northern Victoria, lower water prices will assist
Demand for milk powder is expected to peak in early 2021 before
farmers to grow fodder over summer, increasing supply relative to
tapering off, as China looks to increase its stockpile. Demand for
2019/20. Gippsland, South West Victoria and Tasmania are expected to
cheese from Japan, Australia’s largest export market, remains
make the most of their pasture-based systems decreasing the need for
sluggish, a combination of increased local milk production and a lack
supplementary feed and boosting supply and profitability.
of foodservice demand. As a result, cheese imports are expected to
Offshore, milk supply is expected to increase in the EU, New Zealand be flat in 2020/21.
and the US. Overall global milk supply is expected to be slightly higher
driven by improved season conditions and the removal of voluntary supply Price
reductions in response to COVID-19. Governments are expected to Australian milk processors appear unlikely to offer step ups in the
manage the flow of stored supply of milk powder and cheese to protect first half of 2021 due to improved seasonal conditions, increased
price in 2021. milk production and a balanced global market.
Demand In international markets prices are likely to remain supported until
early 2021, primarily driven by demand from Asia. Increased supply
Domestic demand appears set to change slightly in 2021 as COVID-19
from both the southern and northern hemisphere will put downward
restrictions ease, particularly in Victoria. This is expected to divert some
pressure on prices for the remainder of the financial year.
demand away from supermarkets, where consumers have become
accustomed to buying larger quantities of products like butter and
Cheddar price forecast Skim milk powder price forecast
8,000 6,000
7,000
5,000
6,000
4,000
5,000
AUD/tonne
AUD/tonne
4,000 3,000
3,000
2,000
2,000
1,000
5 YEAR
DECILE 7.2 1,000
5 YEAR
DECILE 8.8
0 0
Dec 15
Jun 16
Dec16
Jun 17
Dec 17
Jun 18
Dec 18
Jun 19
Dec 19
Jun 20
Dec 20
Jun 21
Dec 15
Jun 16
Dec16
Jun 17
Dec 17
Jun 18
Dec 18
Jun 19
Dec 19
Jun 20
Dec 20
Jun 21
Monthly average global dairy trade (GDT) cheddar prices Monthly average GDT skim milk powder prices forecast at
forecast at 68 per cent confidence interval. 68 per cent confidence interval.
Source: Global Dairy Trade, Rural Bank and USDA
10 AUSTRALIAN AGRICULTURE OUTLOOK 2021Horticulture
Favourable seasonal conditions over the
past six months will ensure strong supply
for both fruit and vegetables across most of
Australia, with domestic demand continuing
to recover from COVID-19. The lack of
seasonal workers remains a worry for many
growers coming into harvest, though the
recently announced Seasonal Worker
Programme has helped to ease some of
these concerns. Export demand remains
more difficult to predict due to various
logistical challenges, though government
assistance should see high value exports
remain viable for producers.
John Reilly, Rural Bank, Western Australia
11 AUSTRALIAN AGRICULTURE OUTLOOK 2021Horticulture
Supply Price
Favourable seasonal conditions are likely to Higher supply will likely lead to softer prices in
lead to increased production in the first half the first half of 2021.
of 2021.
Demand Outlook
Export and domestic demand remains robust. Key challenges are being managed. Increased
supply expected to be met with strong demand.
The impact of COVID-19 on the fruit and vegetable industry has been Fruit price index forecast
significant. Many perishable horticultural products which normally rely 120
heavily upon air freight were unable to be exported due to prohibitive
costs. Australian airfreight capacity is currently down 80 per cent 110
on pre-COVID levels. The Australian government has set up the
Index 100=2011–12
100
International Freight Assistance Mechanism (IFAM) in order to keep
international supply chains open. However, exports are still facing an
90
uphill battle with airfreight prices remaining high in addition to an overall
decrease in availability and capacity, along with a lack of connecting 80
services to key markets.
70
Summer fruit exports such as cherries and avocados that rely almost
exclusively on airfreight for exports are vulnerable to the shortage of 60
airfreight with exporters admitting they would be in a more precarious
Dec 15
Jun 16
Dec16
Jun 17
Dec 17
Jun 18
Dec 18
Jun 19
Dec 19
Jun 20
Dec 20
Jun 21
position without IFAM. The funding is expected to conclude by June
2021 despite airfreight prices unlikely to return to pre-COVID levels in
the near future. Fruit and vegetable exporters will need to prepare for
Monthly average fruit price index forecast at 68 per cent
this, with the potential for reduced export profitability and an increase of confidence interval.
produce going through the domestic market, which will impact domestic
supply and prices.
Across the horticulture industry, producers are expected to require at
least an additional 26,000 workers to harvest their crops this summer
according to a report from Ernst and Young. The Australian government Vegetable price index forecast
has recently restarted the Seasonal Worker Programme which should 140
help fill employment gaps with workers from nine approved Pacific
130
Island countries. While this programme will provide some relief, it is
highly unlikely that this will solve the forecast worker shortage in its 120
Index 100=2011–12
entirety. The labour shortage could potentially result in more expensive, 110
lower quality domestic fruit and vegetables with growers unable to
100
prepare crops properly and less produce harvested in a timely and
efficient manner. 90
80
70
60
Dec 15
Jun 16
Dec16
Jun 17
Dec 17
Jun 18
Dec 18
Jun 19
Dec 19
Jun 20
Dec 20
Jun 21
Monthly average vegetable price index forecast at 68 per cent
confidence interval.
Source: Australian Bureau of Statistics (ABS), Rural Bank and
Ausmarket Consultants.
12 AUSTRALIAN AGRICULTURE OUTLOOK 2021Horticulture
Fruit
Supply Prices
Australian fruit production is expected to increase following improved Following strong domestic demand, early season mango prices were
growing conditions across much of Australia. The forecast La Niña up 50 per cent, we are likely to see prices begin to soften over the
weather pattern is characterised by above average rainfall and more coming months due to increased supply, though given the higher
volatile weather conditions, particularly in the northern states, which starting point, price will likely remain above last year’s average price
may lead to quality and yield issues if heavy rainfall occurs in summer for the corresponding period.
months.
Australian table grape prices have remained resilient throughout
The Australian mango season is expected to see strong production COVID-19 with a 5.7 per cent increase in sales by value during this
numbers despite some challenging weather events including high winds period. Strong export demand has helped to support prices with over
and fire which has seen production forecasts downgraded slightly in $270 million worth of table grapes exported to China in 2019/20,
some regions. a 24.8 per cent increase over the previous year.
Table grape production is expected to reach a record 240,000 MT China receives over 43 per cent of all Australian table grape
this season, an increase of 15,000 MT in comparison to 2019/20. exports which opens the table grape industry to an elevated level of
High production has been driven by excellent growing conditions and concentration risk given the recent political uncertainty surrounding
additional plantings over the last five years. Lower water prices are Australian agricultural exports to China. Overall table grape prices
expected to aid both supply and profitability in 2021. The only should begin to ease from November and December. As harvest begins
challenge will be the industry’s capacity to harvest the entire crop in earnest, prices are expected to remain higher than last season due to
with estimates that almost 15,000 seasonal workers will be required growing export demand throughout Asia and continued impact from the
to complete harvest. lack of seasonal workers.
Bananas will continue to increase in yield and volume due to warmer Banana prices are anticipated to fall in coming months with prices likely
weather and favourable growing conditions, though if there is a dry to remain below the seasonal average due to the forecast stronger than
period towards the end of 2020 and beginning of 2021then supply usual production.
may reduce. Avocados and limes are among fruit categories also
expected to see increased production over the warmer months.
Demand
Demand for fruit, particularly immune boosting fruit has increased,
as consumers look to prioritise their health during the uncertainty of
COVID-19. This is a trend that has been seen both domestically and
internationally in the short term, though it remains to be seen if it will
continue over the long term.
Mango producers are seeing high demand both domestically and from
various export markets. Producers are expected to focus on specific
markets this year with China, Japan, New Zealand and South Korea
expected to receive the majority of exports.
Table grapes are forecast to be in strong demand with most of the
increased supply expected to be exported. A total of 168,000 MT
of produce (70 per cent of production) is anticipated to be exported
throughout the 2020/21 season, primarily to China, Japan and
South East Asia.
13 AUSTRALIAN AGRICULTURE OUTLOOK 2021Horticulture
Vegetables Nuts
Supply Supply
Vegetable production over the next six months is anticipated to increase Australia is heading towards a record production year in 2020/21 for
throughout Australia following improved seasonal conditions and partially almonds, macadamias and walnuts. Almond production is expected to
reduced input costs. Water prices are significantly lower in comparison reach 120,000 tonnes as a result of expanding plantations reaching
to last year as areas that were impacted by drought have seen solid maturity and coming into full production. Macadamia production is
rainfall over the previous six months. Water prices within the River Murray expected to reach 50,000 tonnes due favourable seasonal conditions in
allocation have reduced from almost $950 per ML in June 2019 to as 2020 in contrast to a very dry 2019. Walnut production is likely to reach
little as $250 per ML in October 2020 with prices expected to remain 13,800 tonnes in 2020/21, due entirely to new trees coming into full
low given strong water storage across the country. The reduction in production. Favourable seasonal conditions across Eastern Australia
water cost has been partially offset by rising DAP fertiliser prices with in 2020 has helped lower water prices which will improve profitability
costs expected to trend upwards until March 2021, though they should relative to 2019/20.
remain well below the October 2018 when prices hit record levels.
Global supply of almonds is expected to be higher in 2020/21 due to
Victoria, South Australia, and New South Wales all benefited from good a 17.6 per cent increase in production in California, the world’s largest
rainfall and mild temperatures with carrots, potatoes, asparagus, broccoli, producer of almonds. The expected rise is largely due to increased
and cauliflower all expecting improved crops in comparison to last year. plantings reaching majority, something that has aided production growth
since 2014/15.
Demand
Domestic demand for Australian vegetables is anticipated to return
Demand
to normal in coming months as consumers continue to balance Domestic and international demand for nuts is likely to remain strong
consumption between home and foodservices in line with easing in 2021 as consumer behaviour, driven by COVID-19, moves towards
restrictions, particularly in Victoria. healthy foods. Demand for almonds is expected to receive a boost
from softening prices driven by increased supply. This will potentially
In export markets, the Indonesia-Australia Comprehensive Economic
be opening up almonds to price sensitive consumers at a time where
Partnership (IA-ECP) led to a strong increase in export demand from
consumer spending is heavily analysed. Freighting nuts around the
Indonesia, especially for potatoes. This trend has continued into 2020/21
world will likely remain an ongoing issue for exporters due to COVID-19
with year-to-date export value trending 11.6 per cent higher compared to
slowing down distribution networks.
2019/20. The value of Australian potato exports is expected to increase
by around five per cent in the first half of 2021, driven by demand from Competition on the export market particularly for almonds will likely be a
Indonesia, Malaysia, and Hong Kong. Carrot producers are also expected key factor in 2021 as record supply from California and Australia floods
to begin exporting to Indonesia in 2021 with the import quota increasing markets in China, India and Europe. Australia is likely to lose market
to 5,000 tonnes per year and tariffs reducing to 10 per cent (from 25 per share to the US in China as prices decrease. However, as demonstrated
cent) making the market increasingly viable. late in 2020, Australian almond exports have managed to diversify
away from China, expanding exports to India, Germany, the Netherlands,
Carrots continue to remain one of Australia’s largest vegetable exports by
Vietnam and New Zealand. It’s likely that demand from these alternative
volume with the United Arab Emirates (UAE) the largest overall importer
markets will increase in 2021 as exportable surplus increases.
of Australian carrots. Exports of carrots to the UAE totalled $23 million
for the 2019/20 season, a 10.5 per cent decline on the previous year, Macadamia export demand is likely to increase further in 2021 driven
with total carrot exports declining by over 5.4 per cent. This decline was by a relatively tight supply in relation to demand from countries such as
primarily caused by supply chain disruptions and reduced production. UAE China and Vietnam. Australian macadamia exports to China were up
export demand remains high given their low level of domestic production 21.1 per cent by volume as of September 2020. Most of the increased
and increasing consumer demand for fresh vegetables. production in 2020/21 will likely be exported to China to satisfy
growing demand.
Australian onion exports fell by more than 22 per cent in the 2019/20
season. Export demand over the summer is expected to rebound
Prices
though not to the record levels seen in 2018/19 season thanks to the
strong production coming out of the Netherlands, one of the world’s Almond prices are likely to come under downward pressure in 2021
largest onion exporters. Australian onion prices are currently 17 cents as a result of record global supply. In 2020 Australia’s average export
p/kg lower than the corresponding period last year and should remain price declined by approximately 17.8 per cent however compared to
slightly below the season average. the five-year average prices were only 5.9 per cent lower. Export price
could potentially fall a further five to 10 per cent in 2021 in response to
Prices increased production, tempered by strong underlying demand.
Vegetable prices will likely continue to soften over the next few months Macadamia prices are likely to be well supported in 2021 despite
as supply remains strong following favourable conditions over the increasing production. Strong demand from export markets is likely to be
growing season. Carrot prices are sitting slightly above last season the major factor that could see the average export price rise by up to five
and should remain steady over the coming summer months, though per cent in 2021.
increased supply may see prices fall towards the back end of summer.
Broccoli prices are expected to increase through to March in line with
seasonal price trends. However, prices are expected to remain lower
than the corresponding period last year due to the strong supply coming
out of Victoria.
14 AUSTRALIAN AGRICULTURE OUTLOOK 2021Sheep
Australian sheep producers are well
placed heading into 2021 with improved
seasonal conditions allowing for flock
rebuilding to occur. While export demand
is expected to remain steady, the increase
in supply following a good lambing year
in 2020 will likely see lamb prices trend
lower year-on-year compared to the
strong start to 2020.
Tony Williams, Rural Bank, New South Wales
15 AUSTRALIAN AGRICULTURE OUTLOOK 2021Sheep
Supply Price
Australian lamb production to increase year-on- Lamb prices to trend lower year-on-year, while
year but mutton production to remain tight. mutton prices to be well supported at high levels.
Demand Outlook
Sheepmeat demand to remain steady and Improved seasonal conditions to support sheep
subdued compared to pre-COVID levels. producers despite lower lamb prices.
Supply
Australian lamb production in the first half of 2021 is likely to return Eastern States
to above average after being well below average in 2020, driven by Trade Lamb Indicator forecast
an improved supply of lambs and expected heavier carcass weights. 1,000
Some of those lambs will be retained for breeding as producers seek to 900
rebuild depleted flocks. Retention of breeding stock for flock rebuilding 800
will keep Australian mutton production tight well into 2021. Rebuilding
700
efforts that begun in 2020 are expected to see the national sheep flock
600
recover by almost four per cent by the middle of 2021 after falling to c/kg cwt
500
the lowest level in more than a century.
400
New Zealand sheepmeat production and exports are expected to decline
7.5
300
5 YEAR
in the first half of 2021 as drought and a long-term decline in the sheep 200 DECILE
flock has led to a lower lamb supply in 2020. A decline in New Zealand 100
supply would support increased export opportunities for the anticipated
0
increase in Australian sheepmeat export volumes in 2021.
Dec 15
Jun 16
Dec16
Jun 17
Dec 17
Jun 18
Dec 18
Jun 19
Dec 19
Jun 20
Dec 20
Jun 21
Demand
Demand for Australian sheepmeat is expected to remain steady into
Monthly average ESTLI values forecast at 68 per cent
the first half of 2021 as most major markets, including the domestic confidence interval
market, have progressed into recovery from COVID-19. Export demand Source: MLA, Rural Bank
has remained relatively resilient to the impacts of COVID-19 after
the initial shock of outbreaks in early 2020, however lingering
restrictions on foodservice outlets, weaker economic sentiment and
uncertainty of further outbreaks will keep demand subdued compared
to pre-COVID levels.
The US has been the strongest growth market in 2020 but could be Value of Australian sheepmeat exports
600
affected by longer and more severe impacts of COVID-19. Chinese
2019
demand is expected to remain firm as the impacts of African Swine
500 2020
Fever continue to drive meat imports, although a recovery in Chinese
pork production could see this requirement decline. Exports to the 400
AUD (millions)
Middle East have shown signs of recovery but will remain subdued by
reduced air freight capacity and tourism to the region until significant 300
international air travel resumes.
200
Price
100
The Eastern States Trade Lamb Indicator (ESTLI) is forecast to spend
the first half of 2021 lower than the record highs of the same period in 0
2020 due to an expected increase in supply and steady export demand. Lamb Mutton Lamb Mutton Lamb Mutton
These market conditions are likely to see the ESTLI trend along the US China MENA
lower forecast range towards 700c/kg. Improved lamb supply also
means the upwards trend in prices towards a winter peak is unlikely to
January to September sheepmeat exports show year-on-year
be as extreme as 2018 and 2019. growth in export value to the US.
Source: Global Trade Atlas, Rural Bank
Mutton prices should remain well supported by tight supply and firm
demand with little indication that either of these factors will soften in
the first half of 2021. This could see the national mutton indicator price
continue to trend around the 600c/kg range.
16 AUSTRALIAN AGRICULTURE OUTLOOK 2021Wool
The first half of 2021 is expected
to see the Australian wool market
slowly recover from a challenging
year in 2020. Improved seasonal
conditions will aid flock rebuilding
and drive increased supply which will
place some pressure on wool prices.
This is expected to be offset by slow
improvements in demand which could
lead to a steady recovery in prices in
the first half of 2021.
Mark Pain, Rural Bank, QLD and Northern Rivers NSW
17 AUSTRALIAN AGRICULTURE OUTLOOK 2021Wool
Supply Price
Australian wool supply is expected to increase Wool prices to remain below average but should
in 2021 but remain below average. steadily recover from 2020 lows as demand improves.
Demand Outlook
Demand is expected to remain subdued by the Conditions for increased production and a recovery
impacts of COVID-19 but should slowly recover. in prices will support Australian wool producers.
Supply
Australian wool production in the first half of 2021 is expected to Disruptions to trade access to China would pose a severe risk to
increase year-on-year but remain below average. Increased production Australian wool growers as China has accounted for 82 per cent of
is likely to be driven by favourable seasonal conditions in Eastern the value of wool exports in 2020. However, action from China to limit
Australia in late 2020 which are expected to lead to an increase in Australian wool imports is unlikely due to China’s reliance on Australia
average wool cuts. In addition to increased production, the supply as a supplier of raw wool for milling.
of wool to auctions will be higher year-on-year as producers offload
stocks held on-farm from 2020. Improved seasonal conditions will also Price
aid rebuilding of the national flock. However the relative strength of Australian wool prices are expected to steadily recover in the first half
sheepmeat prices compared to wool is expected to continue seeing of 2021, continuing the trend from September 2020. The increased
some producers favour meat breeds as they rebuild flocks. This may demand for finer wool seen towards the end of 2020 is likely to continue
result in fine wool production remaining relatively tight over the and the premium over medium and broader wool is expected to widen.
longer-term. An upward trend in prices will likely include some volatility as offerings
could fluctuate as producers respond to price movements. The extent
Demand and speed of a recovery in wool prices will largely depend on how quickly
The Australian wool market is expected to receive support by retail demand recovers in the US and Europe, adding to already improved
strengthening consumer demand in China where its more advanced demand in China. A recovery in these markets in early 2021 could allow
recovery from COVID-19 has led to more favourable economic the Eastern Market Indicator to trend along the upper forecast range and
sentiment. The economic impacts of resurgent COVID-19 outbreaks return above 1,300c/kg by June 2021.
in the US and Europe are expected to weaken demand for woollen
apparel in the short-term. However, demand should slowly recover in
the new year if these outbreaks are managed and these economies
can reopen, although the timing of a recovery towards the end of
the northern hemisphere winter may subdue any gains for demand.
Greater confidence from wool buyers will largely depend on economic
recovery from the impacts of COVID-19 and a clearer timeline on
a COVID-19 vaccine being widely distributed to instil confidence in
consumer retail spending.
Eastern Market Indicator forecast Value of Australian wool exports
2,500 2,000
1,800
2,000 1,600 2019
1,400 2020
AUD (millions)
c/kg clean
1,500 1,200
1,000
1,000 800
0.7
600
5 YEAR
500 DECILE 400
200
0 0
China India Italy Czech South Others
Dec 15
Jun 16
Dec16
Jun 17
Dec 17
Jun 18
Dec 18
Jun 19
Dec 19
Jun 20
Dec 20
Jun 21
Republic Korea
Monthly average EMI values forecast at 68 per cent January to September wool exports show year-on-year
confidence interval declines in export value to all markets.
Source: Australian Wool Exchange (AWEX), Rural Bank Source: Global Trade Atlas, Rural Bank
18 AUSTRALIAN AGRICULTURE OUTLOOK 2021About the research
The Australian Agriculture Outlook 2021 provides a forecast for
domestic and international supply, demand, and price dynamics
for agricultural products. Significant effort has been taken to
secure the most recent data available.
The price forecasts presented in this report have been
calculated using an Auto-Regressive Integrated Moving Average
model. The model projects a range of values based on trend,
volatility, cyclical and seasonal patterns in the historic data.
The forward estimates relate to the December 2020 –June
2021 period, future market conditions may cause actual prices
to move across and outside of the forecast range.
All prices represent Australian Dollars unless otherwise noted.
Glossary
ABS Australian Bureau of Statistics
ASF African Swine Fever
AWEX Australian Wool Exchange
AUD Australian Dollar
CPI Consumer Price Index
EMI Eastern Market Indicator
ESTLI Eastern States Trade Lamb Indicator
EYCI Eastern Young Cattle Indicator
GDP Gross Domestic Product
GDT Global Dairy Trade
MENA Middle East and North Africa
MLA Meat and Livestock Australia
MS Milk solids
RBA Reserve Bank of Australia
US United States
This report is intended to provide general information on a particular subject or subjects and is not an exhaustive treatment of such subject(s). The information herein is believed
to be reliable and has been obtained from public sources believed to be reliable. Rural Bank, a Division of Bendigo and Adelaide Bank Limited, ABN 11 068 049 178 AFSL/
Australian Credit Licence 237879, makes no representation as to or accepts any responsibility for the accuracy or completeness of information contained in this report. Any
opinions, estimates and projections in this report do not necessarily reflect the opinions of Rural Bank and are subject to change without notice. Rural Bank has no obligation to
update, modify or amend this report or to otherwise notify a recipient thereof in the event that any opinion, forecast or estimate set forth therein, changes or subsequently becomes
inaccurate. This report is provided for informational purposes only. The information contained in this report does not take into account your personal circumstances and should not
be relied upon without consulting your legal, financial, tax or other appropriate professional.
©
Copyright Bendigo and Adelaide Bank Ltd ABN 11 068 049 178 (153525 –1535249) (12/20)
19 AUSTRALIAN AGRICULTURE OUTLOOK 2021For report enquiries For more detailed and in depth insights or customised reports email: insights@ruralbank.com.au For banking enquiries Rural Bank products are available through Elders and Bendigo Bank branches. To find out more about Rural Bank’s range of specialist farm finance products and services contact your local Rural Bank Agribusiness Relationship Manager, call 1300 660 115 or visit ruralbank.com.au Subscribe Visit ruralbank.com.au/subscribe to receive future research and analysis to support you in making informed business decisions on your farm. www.ruralbank.com.au
You can also read