Comparative models disentangle drivers of fruit production variability of an economically and ecologically important long lived Amazonian tree
←
→
Page content transcription
If your browser does not render page correctly, please read the page content below
www.nature.com/scientificreports
OPEN Comparative models disentangle
drivers of fruit production
variability of an economically
and ecologically important
long‑lived Amazonian tree
Christina L. Staudhammer1*, Lúcia Helena O. Wadt2, Karen A. Kainer3 &
Thiago Augusto da Cunha4
Trees in the upper canopy contribute disproportionately to forest ecosystem productivity. The large,
canopy-emergent Bertholletia excelsa also supports a multimillion-dollar commodity crop (Brazil
nut), harvested almost exclusively from Amazonian forests. B. excelsa fruit production, however is
extremely variable within populations and years, destabilizing local harvester livelihoods and the
extractive economy. To understand this variability, data were collected in Acre, Brazil over 10 years
at two sites with similar climate and forest types, but different fruit production levels, despite
their proximity (~ 30 km). One site consistently produced more fruit, showed less individual- and
population-level variability, and had significantly higher soil P and K levels. The strongest predictor
of fruit production was crown area. Elevation and sapwood area also significantly impacted fruit
production, but effects differed by site. While number of wet days and dry season vapor pressure
prior to flowering were significant production predictors, no climatic variables completely captured
annual observed variation. Trees on the site with higher available P and K produced nearly three times
more fruits, and appeared more resilient to prolonged drought and drier atmospheric conditions.
Management activities, such as targeted fertilization, may shield income-dependent harvesters from
expected climate changes and production swings, ultimately contributing to conservation of old
growth forests where this species thrives.
The influence of canopy emergent trees on tropical forest structure and function is immense. They support
wildlife, serve as physical substrates for other biota, shape microclimates, and contribute disproportionately to
forest carbon stocks1. In basin-wide analyses of hyperdominance in unflooded Amazonian forests, large trees
contributed disproportionately larger amounts to total biomass and productivity2. Their belowground influence
on water and nutrient cycling may be just as critical. While understory trees can have deep roots, tall trees pref-
erentially tap water from layers below one meter d epth3, suggesting that canopy trees also play a disproportional
role in accessing the deep soil water that mitigates seasonal Amazonian d roughts4.
Bertholletia excelsa is one of the top 20 most dominant Amazonian species in terms of forest carbon stor-
age and p roductivity2 and can live for centuries5. It represents 1.31% of the total aboveground biomass of the
unflooded Amazonian forests, ranking 3rd and 4th of all species in terms of aboveground biomass and woody
productivity, respectively2. Radio-carbon dating of B. excelsa individuals suggests lifespans > 1000 years5, and
reproductive output is estimated to initiate in the first two centuries6, and last until individuals near senescence.
But B. excelsa’s critical ecological role is only the tip of the iceberg, because this canopy-emergent tree also sus-
tains a multimillion-dollar commodity crop known as Brazil nuts. Harvested almost solely from mature tropical
forests, the 10–25 nuts (botanically seeds) remain inside a globose woody fruit that falls to the ground where it
1
Department of Biological Sciences, University of Alabama, P.O. Box 870344, Tuscaloosa, AL 35487, USA. 2Centro
de Pesquisa Agroflorestal de Rondônia (Embrapa Rondônia), BR 364, km 5,5, Caixa Postal 127, Porto Velho,
Rondônia CEP 76815‑800, Brazil. 3School of Forest Resources and Conservation, and Center for Latin American
Studies, University of Florida, P.O. Box 110410, Gainesville, FL 32611‑0410, USA. 4Universidade Federal do Acre,
Rodovia BR 364, Km 04, Distrito Industrial, Rio Branco, Acre, Brazil. *email: cstaudhammer@ua.edu
Scientific Reports | (2021) 11:2563 | https://doi.org/10.1038/s41598-021-81948-4 1
Vol.:(0123456789)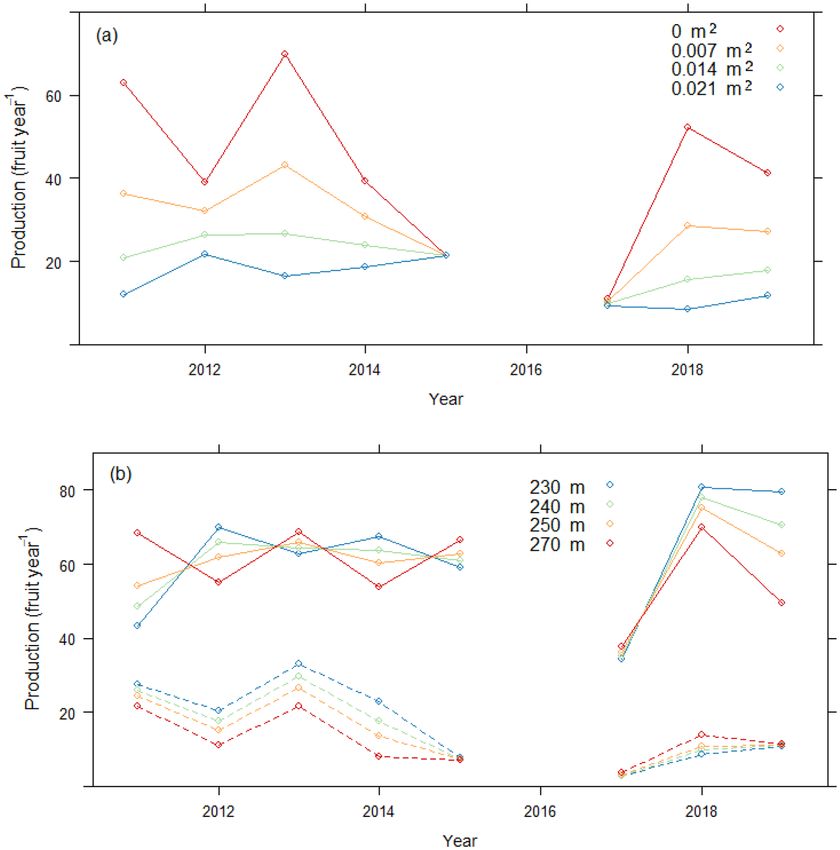
www.nature.com/scientificreports/
Figure 1. Distribution of annual production by site and year. Boxes outline interquartile range, vertical lines
extend to 1.5 × interquartile range, with outliers individually marked. Solid and dashed lines join annual mean
and proportion of trees producing fruit by site, respectively. In each site, n = 129 trees were observed per year
except in 2011, when 124 trees were observed in Cachoeira and 128 in Filipinas, and in 2017–2018, when 128
trees were observed in Cachoeira.
remains until extraction, almost exclusively by agoutis (Dasyprocta sp.) or humans. This single species supports
food security, cultural heritage, and livelihoods of thousands of Amazonian residents, triggering conservation of
standing Brazil nut-rich forests in Brazil, Bolivia and P eru7. At current harvest intensities, the longstanding col-
lection of B. excelsa seeds does not seem to compromise future generations, as suggested by most research6,8,9 (but
see10). Notwithstanding, B. excelsa fruit production varies by year and fluctuates greatly in individual t rees11,12,
leading to research focused on variability and suggesting that silvicultural interventions and best management
practices (e.g., liana c utting13) could potentially increase productivity. In recent years, interest in the causes and
mechanisms of variable fruit production and options for its control have been heightened by alterations in nut
market prices14, intensive deforestation in the lower Amazon basin, and growing understanding of the extent to
which this valuable resource remains untapped in other parts of Brazil nut-rich A mazonia15.
We aim to understand what drives fruit production variation of canopy-emergent trees by comparing two B.
excelsa populations, Filipinas and Cachoeira, in the Acre River Valley of the western Brazilian Amazon. While
both sites are located in sustainable use reserves and are only ~ 30 km apart, Cachoeira has historically produced
three times as many fruits as Filipinas. By comparing these sites over a 10-year period and supplementing annual
tree and fruit production data with soil and climate data, we partitioned variability into site-specific, tree-specific
and climate-induced effects. We hypothesized that fruit production at these sites would show similar patterns over
time, and common driving variables. Using a generalized linear mixed model, we accounted for the non-normal
nature of the production response with a generalized Poisson distribution in a repeated measures framework.
Elucidation of driving factors that control seed production can answer questions about the fate of long-lived
species. For B. excelsa in particular, such knowledge could provide greater stability for communities of harvesters
and the Brazil nut extractive economy.
Results
At site level, there were large differences in average production and production variability (Fig. 1). While both
sites had trees that produced large fruit numbers (> 850 fruit year−1), Cachoeira’s trees produced on average
nearly three times as many fruits as those in Filipinas over the 10-year period. The distribution of production
by tree was very skewed, especially in Filipinas, with the median far lower than the mean in all years. Filipinas
experienced its highest production and lowest variability in 2013, whereas Cachoeira’s highest production year
was 2018 and variability was fairly constant over time.
We found that population variability (CVp) and individual variation in number of fruits (CVi) were higher
in Filipinas (0.497 and 1.162, respectively) compared to Cachoeira (0.192 and 0.670). Overall synchrony of
fruiting in Cachoeira and Filipinas was minimal (S = 0.068 and 0.223, respectively), confirming that this species
does not exhibit masting b ehavior11. While patterns of productivity revealed that 12% and 5% of trees followed
a strict pattern of alternating years of high and low production at Cachoeira and Filipinas, respectively, 70% of
trees had this pattern in 5 of the possible 7 annual transitions in both sites. On average, tree-level AR(1) coef-
ficients showed a weak high-low alternating pattern in Cachoeira (− 0.17) and no pattern in Filipinas (− 0.06).
Scientific Reports | (2021) 11:2563 | https://doi.org/10.1038/s41598-021-81948-4 2
Vol:.(1234567890)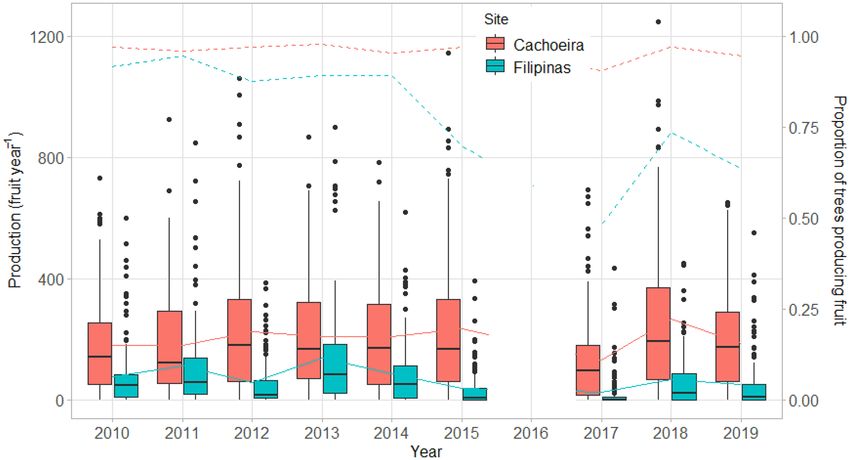
www.nature.com/scientificreports/
Figure 2. Cumulative precipitation from dry season prior to flowering through flowering, by production year,
June–November, 2008 through 2017, corresponding to 2010–2019 production years.
Variable Cachoeira Filipinas Pr > F(1,2)
pH (H2O) 4.41 4.17 0.222
Organic material (g kg−1) 12.57 13.38 0.756
N (g kg−1) 0.96 0.78 0.339
P (mg dm−3) 5.16 3.83 < 0.0001
K (mg dm−3) 55.48 35.03 0.034
Na (mg dm−3) 1.97 1.21 0.225
Ca (cmolc dm−3) 0.17 0.09 0.290
Mg (cmolc dm−3) 0.33 0.19 0.060
H Al (cmolc dm−3) 4.14 3.85 0.711
t (cmolc dm−3) 2.73 2.4 0.521
Fe (mg dm−3) 127.4 241.3 0.214
Mn (mg dm−3) 41.98 35.75 0.783
Cu (mg dm−3) 0.86 0.86 0.995
Clay content (g kg−1) 173.9 133.2 0.467
Particulate density (mg m−3) 2.58 2.65 0.444
Porosity (%) 47.86 50.36 0.477
Table 1. Average soil characteristics by site, and results of F-test for location effects.
Climate and soils. During the study, rainfall was variable, with large differences in cumulative precipitation
during the dry-season and flowering period (Fig. 2). In particular, precipitation during the dry season prior to
flowering (DPF: June–August) corresponding to production years 2012–2014 and 2019 was much lower than
the long-term average (1901–2019), while precipitation during DPF of production year 2011 was much higher.
Cumulative precipitation of 2011 production year continued to be very high for the dry season through flower-
ing (DTF: June–November) period, whereas DTF precipitation in production years 2013, 2017, and 2019 was
very low.
Spearman correlation analysis revealed that few climate variables had high correlations with fruit produc-
tion, especially in Filipinas. While no correlation met the p < 0.05 (|r|≥ 0.68) threshold of significance, increased
minimum (nighttime) temperatures during both DPF and DTF in Cachoeira were associated with lower produc-
tion values (r = −0.4), and higher precipitation was associated with lower production during DPF in Filipinas
(r = −0.37).
Few soil characteristics differed by site (Table 1). Only phosphorous and potassium were significantly different
by site (p < 0.05), with higher values in Cachoeira. While Cachoeira’s sodium and calcium were > 60% higher,
and iron ~ 50% lower, these differences were not significant.
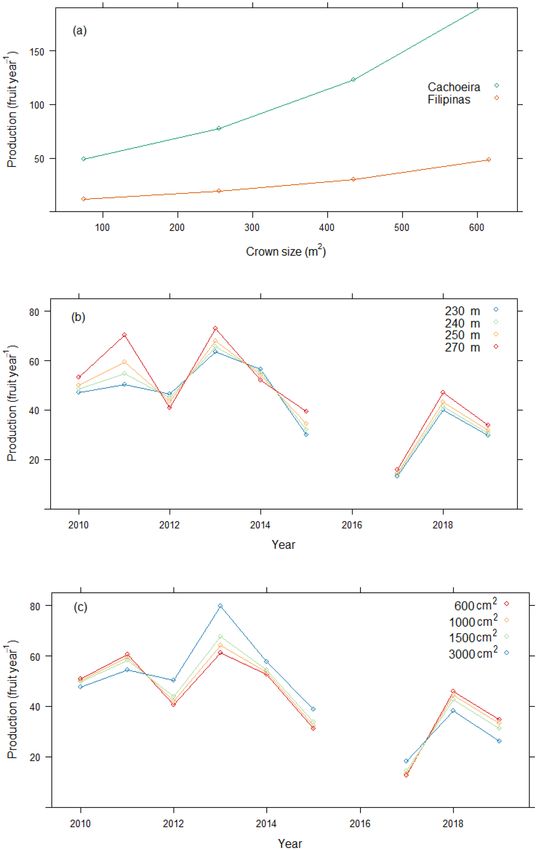
Models of fruit production. When considering all trees in both sites (Model 1), production was signifi-
cantly higher with larger crowns and better crown form (Table 2). Crown size was a better predictor of produc-
tion than tree diameter and was the most important predictor after year and site (Fig. 3a). The effect of competi-
tion from neighboring trees was not a significant predictor. While elevation was significant, in agreement with
Thomas et al.16, its effect was only evident in 2011, when the highest elevation trees produced more than the low-
Scientific Reports | (2021) 11:2563 | https://doi.org/10.1038/s41598-021-81948-4 3
Vol.:(0123456789)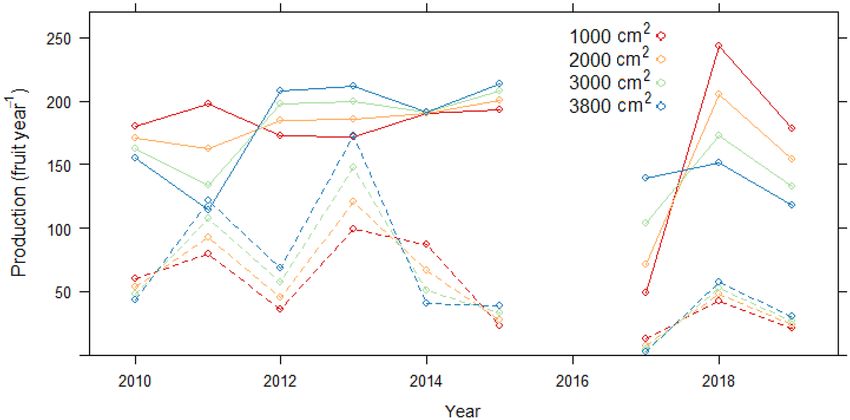
www.nature.com/scientificreports/
Model 4a Cachoeira large Model 4b Filipinas large
Effect Model 1 Year Model 2 Climate Model 3a Small trees Model 3b Large trees trees trees
Year 64.26**** 22.07**** 36.46**** 10.18**** 40.32****
Site 104.84**** 115.47**** 104.97**** 36.13****
Year × site 39.32**** 16.98**** 16.34****
Crown size 26.53**** 26.84**** 19.49**** 15.98**** 6.02* 8.83**
Crown form 8.62*** 8.6*** 6.69**
Elevation 0.64 0.34 4.08* 1.51
Elevation × year 2.25* 3.07**
Elevation × site 0.14
Elevation × year × site 2.36*
Sapwood area 0.05 0.01 3.14 0.00 0.11 0.02
Sapwood area × year 3.57*** 1.77 4.8**** 2.05*
Sapwood area × site 0.00
Sapwood area × year × site 2.9**
VAP (DTF) 248.6****
VAP × site 25.12****
VAP × sapwood area 5.03*
Wet days (DPF) 30.91****
BA growth 13.71***
BA growth × year 2.36*
BA growth × site 7.78**
Table 2. F-values and statistical significance from models of annual production, using (1) year as the indicator
of annual conditions, and (2) climate variables instead of year, (3a) small trees only (< 100 cm DBH), (3b) large
trees only (≥ 100 cm), (4a) large trees in Cachoeira, and (4b) large trees in Filipinas. Models 3–5 use year as
the indicator of annual conditions (Full model statistics available in SI Table S1). VAP vapor pressure, DTF
dry season through fruiting, DPF dry season prior to fruiting, BA basal area. *p < 0.05; **p < 0.01; ***p < 0.001;
****p < 0.0001.
est (Fig. 3b). Similarly, while sapwood area also was associated with production, it was only significant in 2013,
when trees with > 3000 cm2 sapwood area produced significantly more than those with < 1000 cm2 (Fig. 3c).
When using climate variables instead of year as a predictor (Model 2), site and crown size and form continued
to be highly significant predictors of fruit production, but elevation was not (Table 2). The best fit model included
vapor pressure (VAP) during DTF and number of wet days during DPF. However, the AIC indicated far less
support for this model versus that of Model 1 (with year). Fruit production was marginally higher as number
of wet days during DPF increased, and generally lower as VAP increased. Like the year variable, VAP interacted
with sapwood area and site in predicting production. In Cachoeira, the effect of VAP was more pronounced,
especially in trees with smaller sapwood areas (Fig. 4). In Filipinas, this effect was dampened.
Because previous work has shown that B. excelsa growth and reproduction trade-offs seem to exist only in
small trees and not larger trees that have structural potential to maximize production17, we disentangled tree
size in Models 3a and b, respectively. Similar to Model 1, year, site, and crown size were the strongest predictors
in models of both small (those with diameter at breast height [DBH] < 100 cm, measured at 1.3 m above ground
level and large (DBH ≥ 100 cm) tree production. Basal area growth in the year previous to fruit production was
also a very strong predictor, but as expected, only for smaller trees. Significantly higher production in smaller
trees in 2011, 2013, 2018 and 2019 was observed in those trees that were growing more slowly. This apparent
and expected small-tree tradeoff between production and growth was weaker in all other years, especially in the
driest (2015, 2017), when production seemed completely independent of growth (Fig. 5a). In Filipinas, smaller
trees growing at higher elevations had significantly lower production during 2012–2014, whereas differences
among elevations in other years were not significant (Fig. 5b). Similarly, Cachoeira’s smaller trees growing at
higher elevations also tended to demonstrate lower production, but only significantly so in 2019. In contrast, in
2011, Cachoeira’s small-tree production was higher for high elevation trees, but was only significant for those
growing at extreme ends of the elevation distribution.
Production in large trees (Model 3b) was more than twice as high as in smaller trees. Again year, site, and
crown size were the strongest predictors (Table 2). There was a weakly positive effect of elevation on fruit produc-
tion. Like Model 1, production was significantly different by sapwood area, but this effect depended on year and
site (Fig. 6). During 2017, Cachoeira’s large trees produced significantly more fruit when sapwood areas were
larger; however, the opposite was true during 2011 and 2018 (Fig. 6). High uncertainty in Filipinas effected no
significant differences by sapwood values for any year.
When focusing solely on large trees by site, the best fitting models (Models 4a and b) were much simpler,
with very few significant effects (Table 2). Crown size was the most important predictor, after year, for both
sites. Whereas elevation was not a significant predictor in either site, its inclusion in the Filipinas model led to
Scientific Reports | (2021) 11:2563 | https://doi.org/10.1038/s41598-021-81948-4 4
Vol:.(1234567890)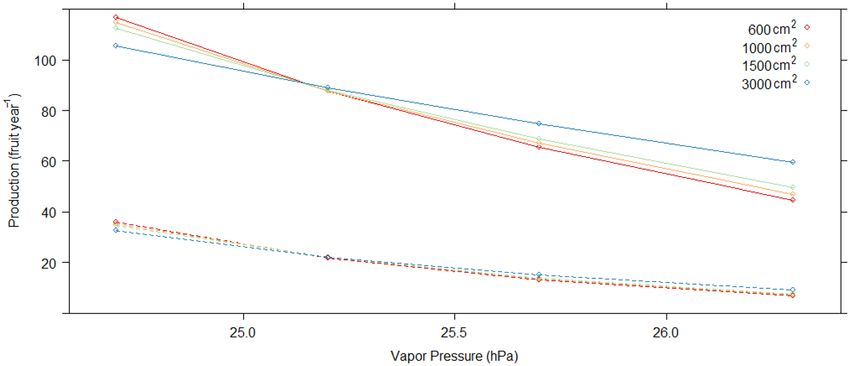
www.nature.com/scientificreports/
Figure 3. Model 1 marginal mean values of annual fruit production: (a) by site and crown size ( m2), (b) by year
and four values of elevation (m), and (c) by year and sapwood area ( cm2).
a lower (better) AIC statistic. For both sites, sapwood area had a significant association with fruit production,
which varied by year. Similar to Model 3b, in 2017, Cachoeira’s large trees with larger sapwood areas pro-
duced significantly more than those with smaller sapwood areas, whereas in all other years, sapwood was not
Scientific Reports | (2021) 11:2563 | https://doi.org/10.1038/s41598-021-81948-4 5
Vol.:(0123456789)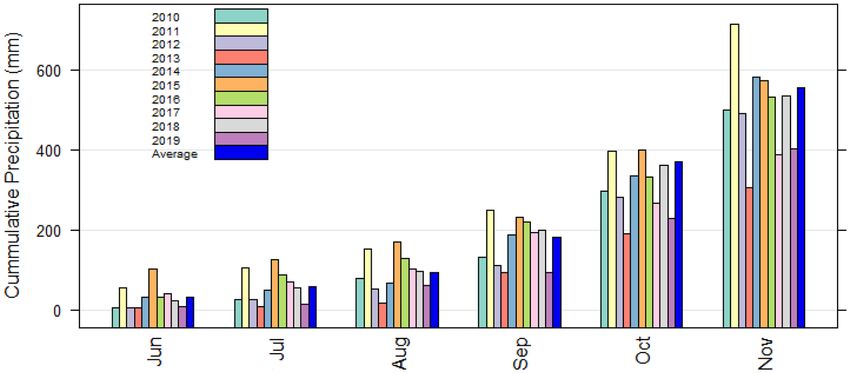
www.nature.com/scientificreports/
Figure 4. Model 2 marginal mean values of annual fruit production by vapor pressure (hPa) during dry season
through flowering (DTF) at four values of sapwood area ( cm2). Solid lines = Cachoeira, dashed lines = Filipinas.
Figure 5. Model 3a marginal mean values of annual fruit production of small trees (DBH< 100 cm): by
four values of (a) basal area growth ( m2 year−1), and (b) elevation (m). Solid lines = Cachoeira, dashed
lines = Filipinas.
significantly associated with production. The only significant differences in Filipinas occurred in 2013, when
higher production values were associated with larger sapwood areas (similar to Fig. 6).
Scientific Reports | (2021) 11:2563 | https://doi.org/10.1038/s41598-021-81948-4 6
Vol:.(1234567890)www.nature.com/scientificreports/
Figure 6. Model 3b marginal mean values of annual fruit production of large trees (DBH ≥ 100 cm) by four
values of sapwood area (cm2). Solid lines = Cachoeira, dashed lines = Filipinas.
Discussion
We set out to disentangle the manifold and interacting drivers of fruit production of large, long-lived tropical
canopy trees. We used two B. excelsa populations as models given the critical importance of this single species
to ecosystem processes, Amazonian livelihoods, and tropical biodiversity conservation. Our findings uncovered
that over 10 years, one site (Cachoeira) consistently generated production levels that were threefold higher than
that of the other site (Filipinas). Fruit production variation at Cachoeira was also relatively constant at both indi-
vidual and population levels compared to Filipinas. Yet as anticipated in the tropics (versus temperate regions)
where low climate variability minimizes resource v ariation18, neither population exhibited masting behavior as
indicated by synchrony (S).
Given that we hypothesized that fruit production would show similar patterns over time, and common driving
variables, we expected weather and weather cues to play important roles in fruit production. Because our research
sites are only ~ 30 km apart, we assumed that each population and individual tree experienced approximately the
same weather and climatic cues. Our climate model indicated that more wet days during the narrow 3-month
dry season prior to flowering resulted in increased fruit production. Furthermore, the model also indicated that
when drier atmospheric conditions (represented by VAP) were present and extended beyond the dry season into
the flowering period, fruit production tended to be reduced. Still, models that used the simple “year” variable to
explain fruit production variation (versus multiple specific, albeit remote climate variables) had better statistical
fit. This leads us to question what overall weather conditions might have caused the extremely low and highly
variable production levels of 2017; in Filipinas, more than half of the trees did not produce any fruits (Fig. 1).
Local Brazil nut harvesters also characterized 2017 as an exceptional nadir in production – a sentiment echoed
in popular media across the Amazon basin19.
The year 2015 was a “Very Strong” El Niño year, which followed immediately on a “Weak” one (2014)20.
These years relate to our 2017 production because of > 15-month fruit maturation lag times. Such El Niño events
yield sunny, dry conditions in our study region. Over the 10-year study, VAP for 2017 production was the low-
est ranked (26.27 hPa), and 2016 was the second lowest (25.37 hPa) (SI Table S2), signaling back-to-back years
of persistent low atmospheric moisture. While increases in solar radiation can boost forest p roductivity21,22,
23
persistent dry conditions and higher accompanying temperatures induce tree s tress , and ultimately higher
mortality24. As a canopy emergent, B. excelsa crowns are exposed to greater radiation levels and higher evapora-
tive demand. Hence, they are predicted to be particularly sensitive to drought due to hydraulic stress25, potentially
exacerbated by increased water column tension in such exceptionally tall t rees23. Still, such large trees access
stored groundwater via deep roots more than previously a ssumed26, and fluctuations in water supply can be
moderated by internal storage in stems, roots and leaves27. It is unknown, however, the extent to which two suc-
cessive El Niño years may have impacted groundwater recharge and storage, and aggravated overall tree stress.
There is evidence that canopy trees are resilient to normal Amazonian dry seasons due to deep roots that access
water stored from wet season precipitation3,28; yet they are more vulnerable to extended tropical droughts, as
demonstrated by the higher rates of large tree, drought-related mortality29. Corlett23 suggested that this tall tree
vulnerability can be attributed to the physiological challenges of transporting water from drying soil through
lengthy water conduits to exposed leaves. B. excelsa demonstrates drought avoidance by losing leaves during
the dry period, but only for a few days in our study r egion30, where deciduousness is unexceptional and average
rainfall falls short of ~ 2000 mm expected for evergreen tropical f orests31. Finally, drought inducement experi-
ments have demonstrated that lower rainfall levels over time negatively affect tropical tree fruit production.
Throughfall exclusion over a 4-year period had a cumulative negative effect on fruit production (− 12%) of a
sub-canopy tropical Rubiaceae, but differences were only significant in 1 year32.
Delayed rainy season onset also may have influenced the extremely low 2017 fruit production. In our region,
the rainy season typically begins in September, yet the key 6-month rainfall (DTF; June through November)
Scientific Reports | (2021) 11:2563 | https://doi.org/10.1038/s41598-021-81948-4 7
Vol.:(0123456789)www.nature.com/scientificreports/
period that influenced 2017 production was the lowest in our 10-year data set. Moreover, of the entire 117-year
CRU data set, the 2017 DTF period was the 16th lowest on record (SI Table S2), indicating that rainy season
onset was delayed beyond norms. Since 1979, there has been a delay in dry season end dates (or rainy season
onset) and an increase in dry season length for southern A mazonia33. Grogan and S chulze34 reported that delayed
rainy season onset had a negative effect on tropical canopy tree growth, but they did not track fecundity. Finally,
negative correlations between fruit production and minimum temperatures during both DPF and DTF (dry
season prior to, and through flowering, respectively), particularly in Cachoeira, are consistent with other tropi-
cal studies that have showed clear negative effects of high nighttime temperatures on tropical tree g rowth22. In
sum, evidence suggests that dry, and perhaps warming, conditions may have produced cascading effects that
compromised 2017 fruit production at both sites (Table S2). Still, Cachoeira responded better than Filipinas not
only in 2017, but across all years, as indicated by highly significant site effects across models.
Given these results, we explored the role that site differences might play in fruit production. Previous stud-
ies have detected subtle differences in demographic structures at our sites, indicating the presence of smaller B.
excelsa individuals in the Filipinas population, but without a clear attribution to ecological or socioeconomic
factors9. While Cachoeira has a longer history of disturbance (i.e., low-intensity timber harvest), which could
influence the dominance of B. excelsa, we lack evidence that this disturbance influences production. Despite close
proximity, our sites are located in different watersheds, and are characterized by slightly different forest types
and soil characteristics. Specifically, Cachoeira’s significantly higher levels of P and K (Table 1) are informative,
as soil P has been positively linked to higher levels of B. excelsa production11,17. Costa35 showed that B. excelsa
can be productive in acidic, less fertile soils, while suggesting that Ca is a key macronutrient for this species.
Site quality has been used extensively to explain and predict productivity across diverse forest types for
decades36, and inclusion of more site variables (such as depth to water table) would likely yield improved explana-
tions for Cachoeira’s comparatively superior production. Notwithstanding, individual tree differences, regardless
of site, offer further fruit production insights. As with almost all trees, B. excelsa reproductive status and fruit
production levels are explained by DBH12,16,37–39, with the most productive trees in the 100–150 cm DBH range11.
Moreover, DBH for these trees is correlated with crown s ize17, which was a significant and positive explanatory
variable for all our production models, although less so for large trees (≥ 100 cm DBH) in Cachoeira versus Filipi-
nas (Table 2, Models 4a & b). Large crowns of individual trees imply greater photosynthetic capacity and sturdy
physical structures that support carbohydrate and nutrient demands of the large B. excelsa fruits. Large-diameter
trees with big crowns produce more fruits. Furthermore, these trees are tall; all exhibit dominant or co-dominant
canopy positions, suggesting fairly unlimited access to light. Notably, while basal area growth was a significant
predictor of fruit production in trees < 100 cm DBH, it was not in large trees (Table 2, Models 3a-b). This finding
corroborates a previous analysis which suggested that once healthy B. excelsa individuals attain sizeable girth and
maturity, they allocate resources more equitably to both fruit production and basal area i ncrement17.
Sapwood area of individual trees also was implicated in fruit production variation in our models, but varied
by site and year, and seemed specific to large trees (Table 2). While sapwood area did not explain fruit production
in most years, in 2017, Cachoeira trees with large sapwood areas produced significantly more fruit than those
with small areas (Models 3b and 4a, Fig. 6). Year 2017 production bore witness to two successive El Niño years
and an abnormally delayed rainy season. Further evidence of the positive effect of sapwood on fruit produc-
tion under dry conditions came from our climate model. Model 2 revealed that higher VAP levels (drier air)
limited fruit production, but this was mitigated when trees had more sapwood area, particularly in Cachoeira
(Fig. 4). Sapwood mitigation of drought was also evident in Filipinas in 2013. After 2017, this was the second
driest 6-month June–November (DTF) in our data, and in Filipinas, trees with large sapwood areas produced
significantly more fruits than those with small. In sum, the more sapwood, the more likely any individual tree
could continue producing fruits even in the face of a drier atmosphere.
Sapwood plays a key role in tree-water relations, and it is unsurprising that sapwood area was positively cor-
related to B. excelsa fruit production (r = 0.37), regardless of year or site. When dry conditions were sustained
over abnormally long periods, however, sapwood area seemed to be a key trait that differentiated fruit produc-
tion. In their study of biomass growth of tropical canopy trees, van der Sande et al.40 reported that sapwood area
strongly explained aboveground biomass growth. While sapwood assures water and nutrient transport from
roots, for large trees, sapwood capacity to store water may be most important. Goldstein et al.41 reported that
canopy trees with larger sapwood areas maintained maximum transpiration rates for a longer fraction of the
day, noting that water stored in stem tissues can reach canopy leaves more quickly than soil water, which can
take days to ascend to tropical tree crowns.
In both our study sites, favorable climate and site conditions have supported viable B. excelsa populations and
related fruit production over generational timeframes. Our 10-year data, however, permitted linkage of annu-
ally disparate weather conditions with individual B. excelsa tree fruit production. Individual tree level research
facilitates close-up examination of the biological unit that responds directly to weather and site interactions40,
illuminating more nuanced understanding of how site-level resources are internally allocated to produce a seed
crop in any given year. In both sites, persistent dry conditions (two consecutive low rainfall years) coupled with
delayed rainy season onset seemed to have had cumulative negative effects on 2017 fruit production. Given that
B. excelsa individuals can live for centuries, isolated low fruit production years are unlikely to result in long-term
population declines, but they certainly affect short-term harvester incomes. For example, the weather anomaly
that seemed key to low 2017 harvests was a concerning event that reverberated throughout Amazonia. Of
potentially greater concern, however, is the extent to which long-term climatic changes might modify B. excelsa
mortality. Using 14 years of data, Bertwell et al.6 found no evidence that isolated years of drought threatened pop-
ulation stability, but undoubtedly the possibility of tree mortality increases after multiple years of low rainfall42.
That fruit production was also linked to soil characteristics opens a door for potential individual tree nutrient
manipulation to enhance production. Our study also showed that sapwood area was positively correlated with
Scientific Reports | (2021) 11:2563 | https://doi.org/10.1038/s41598-021-81948-4 8
Vol:.(1234567890)www.nature.com/scientificreports/
fruit production, and that in dry years, larger sapwood areas seemed to guard against low fruit production of the
largest and presumably most productive trees. Is it possible (and even advisable) to attempt to delay heartwood
formation to produce more drought resistant individuals?
On a much larger scale, the importance of maintaining economically viable B. excelsa populations on the
landscape cannot be overemphasized. Contemporary significance of Brazil nut fruit production to Amazo-
nian economies and conservation of biodiversity and sociocultural values has been highlighted by analysis of
estimated Brazil nut rents across the Brazilian A mazon43, though much of these Brazil nut-rich forests remain
unharvested. Detailed examination of the Amazonian state of Rondônia, for example, reveals that ~ 7.5 million
ha (~ 1/3 of the state) are demarcated for sustainable use (i.e., Indigenous Territories, Extractive Reserves)15, and
if fully exploited, could yield more Brazil nuts than are currently harvested in all of Amazonia. With fairly steady
increases in Brazil nut prices over the last decades, Indigenous Amazonians (who occupy 27% of the Brazilian
Amazon44), increasingly are breaking into Brazil nut markets. While continued monitoring is necessary to ensure
sustainable harvests and Brazil nut populations, spatially explicit models that uncover associations between B.
excelsa distributions and human presence in the Amazon historically, and into the future16,45, are encouraging.
Furthermore, recent projections suggest that B. excelsa and its Dasyprocta sp. disperser are resilient to climate
change itself, although the co-occurrence of B. excelsa and its pollinators was projected to diminish by almost 80%
by Year 2 09046. Significant contemporary threats to Brazil nut sustainability also undoubtedly include felling of
reproductively mature trees6 and conversion of Brazil nut-rich forests to other u ses47,48. Disentangling the drivers
of fruit production contributes to better scientific understanding of climatic, site-specific and endogenous factors
that control fruit and seed production of long-lived, canopy trees. The B. excelsa case also highlights factors that
sustain this important species on the conservation landscape, while providing potential pathways to increase
productivity of extant trees that economically support both local families and a thriving extractive industry.
Materials and methods
Study sites. The study was conducted in: Filipinas (− 10.7770°, − 68.6644°) located in Extractive Reserve
Chico Mendes, and Chico Mendes Agro-Extractive Settlement Project (informally known as Cachoeira)
(− 10.8282°, − 68.3916°)49. Annual average rainfall at these two sites is 1770–1880 mm, with a pronounced dry
season from June to August when average rainfall is < 50 mm per m onth50. Censuses of all B. excelsa individu-
als ≥ 10 cm DBH revealed statistically similar size distributions (Kruskal–Wallis P = 0.84), with population densi-
ties of 1.35 and 1.82 trees ha−1 in Filipinas49 and Cachoeira, respectively. (See Supplemental Information [SI] for
further details.) Modeling studies from these two populations reveal that trees in Cachoeira on average reach
reproductive maturity (40 cm DBH) far earlier than those of Filipinas (83 versus 167 years)6, suggesting that
despite smaller diameters, populations in Filipinas could be older.
Sampled populations and field measurements. From the censuses, a stratified sample of reproduc-
tively mature B. excelsa adults (50–219 cm DBH) was selected in each site across 10 DBH classes (nine 10-cm
DBH classes and one of trees ≥ 150 cm DBH), roughly in proportion to the population. We excluded trees with
overlapping crowns or fruitfall areas, and those that died or were affected by road construction or pasture expan-
sion, leaving 129 sample trees well-distributed spatially across each study landscape.
Tree DBH was assessed annually, while other tree attributes were assessed once during the study, including:
crown position, area and form, tree location and elevation, competition from neighboring trees, and sapwood
area (see SI). Each year during 2010–2015 and 2017–2019, fruit production of each tree was measured after
fruitfall in February. While ground counts do not reflect absolute counts of total fruit production due to some
removal by scatterhoarding Dasyprocta sp., these errors are estimated to be small (~ 5%; L.H.O. Wadt, unpub-
lished data) and thus not considered.
Supplementary data. Because onsite weather data were not available in our remote study areas, we
obtained data from the Climate Research Unit (CRU; version TS v4.0351). CRU data are generated on a 0.5° grid,
and have been evaluated and applied in studies of vegetation-climate interactions and tropical rainforest climates
(e.g.,52). Monthly climate data through 2018 were extracted from four grid points closest to Cachoeira and Fil-
ipinas (http://wps-web1.ceda.ac.uk/submit/form?proc_id=Subsetter), including: average, minimum, maximum
and range of temperature (°C), total precipitation (mm), number of wet days, percentage cloud cover, potential
evapotranspiration (PET; mm/day), and vapor pressure (VAP; the partial pressure of water vapor in the atmos-
phere; hPa). Using linear interpolation, climate variables were estimated for each site; however, site-specific
values of all variables were extremely close. Soil data were available from an independent study, collected in two
600 m2 plots in each site, yielding measures of key soil nutrients and structural characteristics. Because soil data
were not tied to particular trees, only site-level comparisons were possible (see SI for details).
Statistical analyses. Fruiting patterns. Following Kainer et al.11, we quantified fruit production variabil-
ity at the individual level (CVi) and population level (CVp), and the mean individual fruiting synchrony (S).
We also tested for bi-annual patterns in production (high years followed by low ones) with the autocorrelation
coefficient at a lag of 1 year (AR(1)).
Relationship between fruit production and climate. Because the Brazil nut reproductive cycle could be influ-
enced by weather conditions more than two years previous to fruitfall, we initially explored correlative relation-
ships between fruit production and climate variables over various time periods including up to a 3-year lag.
Based on these preliminary findings and Brazil nut phenology research and regional seasonal climatic variation,
however, we focused on the 3-month dry season, which occurs annually from June–August, as this is a critical
Scientific Reports | (2021) 11:2563 | https://doi.org/10.1038/s41598-021-81948-4 9
Vol.:(0123456789)www.nature.com/scientificreports/
period for successful fruit development. We defined the dry season prior to flowering (DPF) as the 3-month dry
season immediately prior to when Brazil nut in Acre is observed to initiate flowering (L.H.O. Wadt; unpublished
data), which occurs ~ 21 months prior to fruitfall (e.g., June–August 2010 DPF relates to fruit production col-
lected in February 2012). We also hypothesized that weather during flowering immediately after this period
could play an important role. The dry season through flowering (DTF) period was defined to include the June–
August dry season and extend through the flowering period ending in November (e.g., for 2012 fruit production,
DTF is June–November 2010). We summarized climate variables, summing total precipitation and averaging all
other variables during these critical periods of fruit development for each annual production cycle. The Spear-
man correlation between annual fruit production and each climate variable was computed as a preliminary step
in testing hypotheses relating production to climate.
Fruit production models. Two types of models were estimated with tree-level variables: one with year, and
another with climate variables. Mixed model analyses were conducted, utilizing a repeated measures framework.
Because data contained more zeroes than would be expected under a Poisson distribution, we modeled annual
fruit production per tree with a Generalized Poisson distribution, which is similar to that of the negative bino-
mial, but includes heavier tails53. This model was implemented via the SAS procedure PROC GLIMMIX (SAS/
STAT(R), Version 9.4). Random effects were included to account for data taken in multiple years on the same
tree. We compared and tested various correlation structures, including compound-symmetric, unstructured,
and autoregressive, to obtain optimal model fit.
First, our base model (Model 1) was estimated with predictor variables included for: site, year of fruitfall,
DBH, crown size, vine loading, crown position, crown form, and elevation. Interactions between year and site,
and the other explanatory variables were also included. Previous analyses have shown a strong correlation
between crown size and DBH; thus, models were formulated separately using each of these variables. Second, to
test hypotheses about climate, year was dropped, and Model 2 included explanatory variables for climate over
the corresponding DPF and DTF periods. We standardized all predictors prior to model fitting, and utilized a
modified backwards-stepwise model selection method, dropping non-significant variables and monitoring the
AIC and Generalized Chi-square/DF statistic. Variables were eliminated from the model unless their removal
resulted in an increase in the AIC, or a divergence of the Chi-square/DF statistic from 1.0. Where effects were
significant (P < 0.05), marginal means were generated, holding all other variables in the model at their average
values. Comparisons among effects levels were made via the Tukey-test. Where interactive effects were significant,
tests of simple e ffects54 were applied to test each individual effect.
To further disentangle drivers, models were then estimated with data subsetted in two ways. Because trade-
offs between growth and production are different for smaller versus larger B. excelsa reproductive a dults17, we
first compared models for small (< 100 cm) versus large (≥ 100 cm DBH) trees (Models 3a and 3b). We then
compared models by site, splitting data for Cachoeira versus Filipinas (Models 4a and 4b). All tree-level variables
were included along with interactions with year as above, using the same modeling and model selection criteria.
Received: 8 June 2020; Accepted: 12 January 2021
References
1. Lindenmayer, D. B. & Laurance, W. F. The ecology, distribution, conservation and management of large old trees. Biol. Rev. 92,
1434–1458 (2017).
2. Fauset, S. et al. Hyperdominance in Amazonian forest carbon cycling. Nat. Commun. 6, 1–19 (2015).
3. Stahl, C. et al. Depth of soil water uptake by tropical rainforest trees during dry periods: does tree dimension matter?. Oecologia
173, 1191–1201 (2013).
4. Staal, A. et al. Forest-rainfall cascades buffer against drought across the Amazon. Nat. Clim. Change 8, 539–543 (2018).
5. Vieira, S. et al. Slow growth rates of Amazonian trees: consequences for carbon cycling. Proc. Natl. Acad. Sci. U. S. A. 102,
18502–18507 (2005).
6. Bertwell, T. D., Kainer, K. A., Cropper, W. P., Staudhammer, C. L. & de Oliveira Wadt, L. H. Are Brazil nut populations threatened
by fruit harvest?. Biotropica 50, 50–59 (2018).
7. Ortiz, E. G. In Tapping the Green Market: Certification & Management of Non-Timber Forest Products Vol. 6174 (eds Shanley, P. et
al.) (Earthscan Publications Ltd., London, 2002).
8. Zuidema, P. A. & Boot, R. G. A. Demography of the Brazil nut tree (Bertholletia excelsa) in the Bolivian Amazon: impact of seed
extraction on recruitment and population dynamics. J. Trop. Ecol. 18, 1–31 (2002).
9. Wadt, L. H. O., Kainer, K. A., Staudhammer, C. L. & Serrano, R. O. P. Sustainable forest use in Brazilian extractive reserves: natural
regeneration of Brazil nut in exploited populations. Biol. Conserv. 141, 332–346 (2008).
10. Peres, C. A. et al. Demographic threats to the sustainability of Brazil nut exploitation. Science (80–). 302, 2112–2114 (2003).
11. Kainer, K. A., Wadt, L. H. O. & Staudhammer, C. L. Explaining variation in Brazil nut fruit production. For. Ecol. Manag. 250,
244–255 (2007).
12. Zuidema, P. A. Ecology and Management of the Brazil Nut Tree (Bertholletia excelsa). (PROMAB Scientific Series 6, 2003).
13. Kainer, K. A., Wadt, L. H. O. & Staudhammer, C. L. Testing a silvicultural recommendation: Brazil nut responses 10 years after
liana cutting. J. Appl. Ecol. 51, 655–663 (2014).
14. Barros, B. Quebra de safra gera disparada dos preços da castanha-do-pará. Agronegócios | Valor Econômico. https://valor.globo
.com/agronegocios/noticia/2017/05/18/quebra-de-safra-gera-disparada-dos-precos-da-castanha-do-para.ghtml (2017).
15. Wadt, L. H. O., Santos, L. M. H., Maroccolo, J. F., Rego, D. S. G. & Emidio, K. Panorama geral da produção extrativista de castanha-
da-amazônia no Estado de Rondônia.—Portal Embrapa (2019).
16. Thomas, E. et al. NTFP harvesters as citizen scientists: Validating traditional and crowdsourced knowledge on seed production of
Brazil nut trees in the Peruvian Amazon. PLoS ONE 12, e0183743 (2017).
17. Staudhammer, C. L., Wadt, L. H. O. & Kainer, K. A. Tradeoffs in basal area growth and reproduction shift over the lifetime of a
long-lived tropical species. Oecologia 173, 45–57 (2013).
18. Kelly, D. & Sork, V. L. Mast seeding in Perennial plants: why, how, where?. Annu. Rev. Ecol. Syst. 33, 427–447 (2002).
Scientific Reports | (2021) 11:2563 | https://doi.org/10.1038/s41598-021-81948-4 10
Vol:.(1234567890)www.nature.com/scientificreports/
19. Silva, R. & Viudes, P. Pesquisa aponta queda de 70% na produção de castanha-da-amazônia. Embrapa Noticias. https: //www.embra
pa.br/busca-denoticias/-/noticia/26131296/pesquisa-aponta-queda-de-70-na-producao-de-castanha-da-amazonia (2017).
20. NOAA. NOAA’s Climate Prediction Center. Historical El Nino/La Nina episodes (1950–present). https://origin.cpc.ncep.noaa.gov/
products/analysis_monitoring/ensostuff/ONI_v5.php; accessed: 4th September 2019.
21. Wright, S. J., Carrasco, C., Calderón, O. & Paton, S. The El Nino southern oscillation, variable fruit production, and famine in a
tropical forest. Ecology 80, 1632–1647 (1999).
22. Clark, D. B., Clark, D. A. & Oberbauer, S. F. Annual wood production in a tropical rain forest in NE Costa Rica linked to climatic
variation but not to increasing CO2. Glob. Change Biol. 16, 747–759 (2010).
23. Corlett, R. T. The impacts of droughts in tropical forests. Trends Plant Sci. 21, 584–593 (2016).
24. Nepstad, D. C., Tohver, I. M., Ray, D., Moutinho, P. & Cardinot, G. Mortality of large trees and lianas following experimental
drought in an Amazon forest. Ecology 88, 2259–2269 (2007).
25. Bennett, A. C., Mcdowell, N. G., Allen, C. D. & Anderson-Teixeira, K. J. Larger trees suffer most during drought in forests world-
wide. Nat. Plants 1, 1–5 (2015).
26. Pierret, A. et al. Understanding deep roots and their functions in ecosystems: an advocacy for more unconventional research. Ann.
Bot. 118, 621–635 (2016).
27. Scholz, F. G., Phillips, N. G., Bucci, S. J., Meinzer, F. C. & Goldstein, G. Hydraulic capacitance: biophysics and functional significance
of internal water sources in relation to tree size. 341–361 (2011). https://doi.org/10.1007/978-94-007-1242-3_13.
28. Ivanov, V. Y. et al. Root niche separation can explain avoidance of seasonal drought stress and vulnerability of overstory trees to
extended drought in a mature Amazonian forest. Water Resour. Res. 48, W12507 (2012).
29. Phillips, O. L. et al. Drought–mortality relationships for tropical forests. New Phytol. 187, 631–646 (2010).
30. Evangelista, J. S., Correa, M. F., Reis, S. F., Fonseca, F. L. & Wadt, L. H. O. Comportamento fenológico de Bertholletia excelsa Bonpl.
e Carapa guianensis Aubl. durante oito anos, na Amazônia Sul-Ocidental (2014).
31. Guan, K. et al. Photosynthetic seasonality of global tropical forests constrained by hydroclimate. Nat. Geosci. 8, 284–289 (2015).
32. Brando, P. M. et al. Effects of partial throughfall exclusion on the phenology of Coussarea racemosa (Rubiaceae) in an east-central
Amazon rainforest. Oecologia 150, 181–189 (2006).
33. Fu, R. et al. Increased dry-season length over southern Amazonia in recent decades and its implication for future climate projec-
tion. Proc. Natl. Acad. Sci. U. S. A. 110, 18110–18115 (2013).
34. Grogan, J. & Schulze, M. The impact of annual and seasonal rainfall patterns on growth and phenology of emergent tree species
in Southeastern Amazonia, Brazil. Biotropica 44, 331–340 (2012).
35. Costa, M. G., Tonini, H. & Mendes Filho, P. Atributos do Solo Relacionados com a Produção da Castanheira-do-Brasil (Bertholletia
excelsa). Floresta e Ambient. 24, e20150042 (2017).
36. Smith, D. M., Larson, B. C., Kelty, M. J. & Ashton, P. M. S. The Practice of Silviculture: Applied Forest Ecology (Wiley, New York,
1997).
37. Tonini, H., Kaminski, P. E. & da Costa, P. Relação da produção de sementes de castanha-do-Brasil com características morfomé-
tricas da copa e índices de competição. Pesqui. Agropecuária Bras. 43, 1509–1816 (2008).
38. Tonini, H. & Pedrozo, C. Â. Variações anuais na produção de frutos e sementes de Castanheira-do-Brasil (Bertholletia excelsa
Bonpl., Lecythidaceae) em florestas nativas de Roraima. Rev. Árvore 38, 133–144 (2014).
39. Neves, E. S., Guedes, M. C. & Rodrigues, E. G. Relação da produção de frutos de castanha-da-amazônia (Bertholletia excelsa Bonpl.)
com variáveis das próprias castanheiras, em capoeira e floresta da Resex Cajari. Biota Amaz. 5, 31–37 (2015).
40. van der Sande, M. T., Zuidema, P. A. & Sterck, F. Explaining biomass growth of tropical canopy trees: the importance of sapwood.
Oecologia 177, 1145–1155 (2015).
41. Goldstein, G. et al. Stem water storage and diurnal patterns of water use in tropical forest canopy trees. Plant Cell Environ. 21,
397–406 (1998).
42. Brienen, R. J. W. et al. Long-term decline of the Amazon carbon sink. Nature 519, 344–348 (2015).
43. Strand, J. et al. Spatially explicit valuation of the Brazilian Amazon Forest’s Ecosystem Services. Nat. Sustain. 1, 657–664 (2018).
44. Crisostomo, A. C. et al. Indigenous Lands in the Brazilian Amazon: carbon stocks and barriers to deforestation. https://ipam.org.br/
wp-content/uploads/2015/04/indigenous_lands_in_the_brazilian_amazon-1.pdf (2015).
45. Thomas, E., Alcázar Caicedo, C., McMichael, C. H., Corvera, R. & Loo, J. Uncovering spatial patterns in the natural and human
history of Brazil nut (Bertholletia excelsa) across the Amazon Basin. J. Biogeogr. 42, 1367–1382 (2015).
46. Sales, L. P., Rodrigues, L. & Masiero, R. Climate change drives spatial mismatch and threatens the biotic interactions of the Brazil
nut. Glob. Ecol. Biogeogr. https://doi.org/10.1111/geb.13200 (2020).
47. Cronkleton, P., Guariguata, M. R. & Albornoz, M. A. Multiple use forestry planning: Timber and Brazil nut management in the
community forests of Northern Bolivia. For. Ecol. Manag. 268, 49–56 (2012).
48. Kainer, K. A., Wadt, L. H. O. & Staudhammer, C. L. The evolving role of Bertholletia excelsa in Amazonia: contributing to local
livelihoods and forest conservation. Desenvolv. Meio Ambient. 48, 477–497 (2018).
49. Wadt, L. H. O., Kainer, K. A. & Gomes-Silva, D. A. P. Population structure and nut yield of a Bertholletia excelsa stand in South-
western Amazonia. For. Ecol. Manag. 211, 371–384 (2005).
50. Zoneamento Ecologico-Econômico do Acre (ZEE), F. I. Documento Sintese—Escala 1:250.000 (2010).
51. Harris, I., Jones, P. D., Osborn, T. J. & Lister, D. H. Updated high-resolution grids of monthly climatic observations—the CRU
TS3.10 Dataset. Int. J. Climatol. 34, 623–642 (2014).
52. Esquivel-Muelbert, A. et al. Compositional response of Amazon forests to climate change. Glob. Change Biol. 25, 39–56 (2019).
53. Joe, H. & Zhu, R. Generalized Poisson distribution: the property of mixture of Poisson and comparison with negative binomial
distribution. Biom. J. 47, 219–229 (2005).
54. Winer, B. J. Statistical Principles in Experimental Design (McGraw-Hill Book Company, New York, 1962).
Acknowledgements
This research was supported by CNPq (The National Council for Scientific and Technological Development) of
Brazil, Special Visiting Research (PVE) Fellowship. We thank Embrapa technicians and Universidade Federal
do Acre research interns for their superior field assistance. We are most grateful to families in Cachoeira and
Filipinas, who graciously shared their forest homes.
Author contributions
L.W. and K.K. conceived the ideas/methodology; all authors collected data; T.C. collected and analyzed tree
cores; C.S. and T.C. analyzed data; C.S. and K.K. led manuscript writing. All authors contributed to manuscript
and approved for publication.
Competing interests
The authors declare no competing interests.
Scientific Reports | (2021) 11:2563 | https://doi.org/10.1038/s41598-021-81948-4 11
Vol.:(0123456789)www.nature.com/scientificreports/
Additional information
Supplementary Information The online version contains supplementary material available at https://doi.
org/10.1038/s41598-021-81948-4.
Correspondence and requests for materials should be addressed to C.L.S.
Reprints and permissions information is available at www.nature.com/reprints.
Publisher’s note Springer Nature remains neutral with regard to jurisdictional claims in published maps and
institutional affiliations.
Open Access This article is licensed under a Creative Commons Attribution 4.0 International
License, which permits use, sharing, adaptation, distribution and reproduction in any medium or
format, as long as you give appropriate credit to the original author(s) and the source, provide a link to the
Creative Commons licence, and indicate if changes were made. The images or other third party material in this
article are included in the article’s Creative Commons licence, unless indicated otherwise in a credit line to the
material. If material is not included in the article’s Creative Commons licence and your intended use is not
permitted by statutory regulation or exceeds the permitted use, you will need to obtain permission directly from
the copyright holder. To view a copy of this licence, visit http://creativecommons.org/licenses/by/4.0/.
© The Author(s) 2021
Scientific Reports | (2021) 11:2563 | https://doi.org/10.1038/s41598-021-81948-4 12
Vol:.(1234567890)You can also read