Savanna tree evolutionary ages inform the reconstruction of the paleoenvironment of our hominin ancestors - Nature
←
→
Page content transcription
If your browser does not render page correctly, please read the page content below
www.nature.com/scientificreports
OPEN Savanna tree evolutionary
ages inform the reconstruction
of the paleoenvironment of our
hominin ancestors
T. Jonathan Davies1,2*, Barnabas H. Daru3, Bezeng S. Bezeng1, Tristan Charles‑Dominique4,5,
Gareth P. Hempson6,7, Ronny M. Kabongo1, Olivier Maurin8, A. Muthama Muasya4,
Michelle van der Bank1 & William J. Bond4,7*
Ideas on hominin evolution have long invoked the emergence from forests into open habitats
as generating selection for traits such as bipedalism and dietary shifts. Though controversial,
the savanna hypothesis continues to motivate research into the palaeo-environments of Africa.
Reconstruction of these ancient environments has depended heavily on carbon isotopic analysis of
fossil bones and palaeosols. The sparsity of the fossil record, however, imposes a limit to the strength
of inference that can be drawn from such data. Time-calibrated phylogenies offer an additional tool
for dating the spread of savanna habitat. Here, using the evolutionary ages of African savanna trees,
we suggest an initial tropical or subtropical expansion of savanna between 10 and 15 Ma, which
then extended to higher latitudes, reaching southern Africa ca. 3 Ma. Our phylogenetic estimates
of the origin and latitudinal spread of savannas broadly correspond with isotopic age estimates and
encompass the entire hominin fossil record. Our results are consistent with the savanna hypothesis
of early hominin evolution and reignite the debate on the drivers of savanna expansion. Our analysis
demonstrates the utility of phylogenetic proxies for dating major ecological transitions in geological
time, especially in regions where fossils are rare or absent or occur in discontinuous sediments.
The emergence of savannas and other tropical grassy biomes has been a topic of intense research interest, not
least because it coincides with early hominin evolution. The savanna hypothesis of human evolution suggests
that the transition from a predominately arboreal lifestyle in forest to one in open habitats favoured an upright
posture and selected for bipedalism along with a shift in diet that necessitated travel over greater distances
across the landscape1. The early support for the savanna hypothesis waned, in part, due to confusion as to the
definition of prehistoric savannas—as open grassland or as a grassland-tree mosaic—nonetheless, it continues
to influence thinking about the selective landscape that shaped human evolution, and generate large interest
in the palaeo-environments of Africa where our ancestors e merged2–6. However, while our understanding of
hominin evolution is continually updated by new fossil finds, the palaeontological reconstruction of the ancient
African environment has been greatly limited by the sparse record of fossil bones and palaeosols that capture
the signature of these past ecosystems7.
1
Department of Botany and Plant Biotechnology, African Centre for DNA Barcoding, University of Johannesburg,
Johannesburg 2006, South Africa. 2Departments of Botany, Forest and Conservation Sciences, Biodiversity
Research Centre, University of British Columbia, Vancouver, BC V6T, 1Z4, Canada. 3Department of Life
Sciences, Texas A&M University-Corpus Christi, Corpus Christi, TX 78412, USA. 4Department of Biological
Sciences, University of Cape Town, Rondebosch 7701, South Africa. 5Xishuangbanna Tropical Botanical Garden,
Chinese Academy of Sciences, Center for Integrated Conservation, Community Ecology and Conservation,
Menglun 666303, Yunnan, China. 6School of Animal, Plant and Environmental Sciences, University of the
Witwatersrand, Wits 2050, South Africa. 7South African Environmental Observation Network, National Research
Foundation, Pretoria 0083, South Africa. 8Royal Botanic Gardens, Kew Richmond, Surrey TW9 3DS, UK. *email:
j.davies@ubc.ca; william.bond@uct.ac.za
Scientific Reports | (2020) 10:12430 | https://doi.org/10.1038/s41598-020-69378-0 1
Vol.:(0123456789)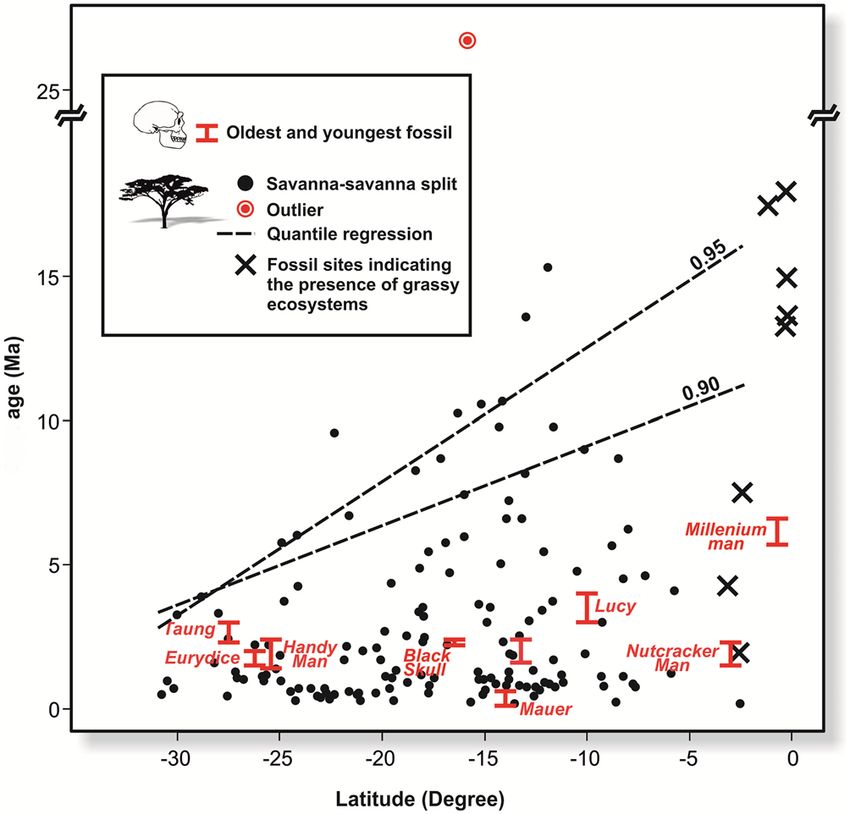
www.nature.com/scientificreports/
The origin and spread of savannas is thought to be closely linked to the attributes of the C4 grasses that
dominate the herbaceous l ayer8,9. An influential hypothesis for the spread of the savanna biome suggests that C 4
grasses likely first evolved when atmospheric CO2 decreased below a threshold of 500 ppm, which was thought
to have occurred in the Late Miocene, appearing first at the equator with warm growing season temperatures
and progressively moving to higher latitudes with cooler climates10,11. Low CO2 concentrations and high tem-
peratures during the growing season would have favoured the C 4 photosynthetic pathway, a C O2 concentrating
mechanism, allowing C4 grasses to thrive relative to C3 plants11. Subsequent studies suggested that pCO2 fell below
the threshold favouring C 4 photosynthesis in the Oligocene, leading to rejection of the physiological model for
a late Miocene origin of savannas12–14. However, new proxies support a steep decline in pCO2 from ~ 7 Ma15,16
which again raises the question of whether the timing of savanna origins along a latitudinal gradient is rooted
in C3 versus C4 photosynthetic physiology.
Much of the evidence for a shift from forests to savannas comes from analyses of carbon isotopes in fossil
soils and fossil bones. For example, it is possible to estimate tree cover in savannas from the ratio of C 13 to C
12 in
current and fossil soil carbon2. Similarly, the dietary mix of fossil hominins can be traced from carbon isotope
analysis17. Other proxies for reconstructing ancient habitats include pollen, alkanes, and rates of dust deposi-
tion into lakes or marine cores3,5,6,18. Together, these proxies are providing increasingly detailed reconstructions
of environmental conditions and their variability over the past few million years. However, sites with suitable
temporal continuity are few and largely restricted to East Africa. Fossil sites elsewhere in Africa are patchily
distributed in space and time, and therefore provide only snapshots of environmental conditions in the past3,19.
Dated phylogenetic trees reconstructed using molecular sequence data and calibrated from the fossil record,
offer an alternative source of information, and insights deeper in time. For example, the phylogenetic structure
of modern species assemblages can reveal insights into historical biogeography, while the timing of lineage diver-
sification and evolutionary radiations may be linked to shifts in dominant habitat types and c limates20,21. New
ecological opportunity brought about by dispersal to a new environment, the acquisition of a key innovation, or
extinction of a competitor, might trigger adaptive radiations. The appearance of new clades sharing a particular
adaptive trait can therefore capture important ecological shifts that might not be detectable in the fossil record22,23.
It would seem reasonable to use phylogenetic methods to date the origin of savannas by dating the origin of
C4 grasses from C 4 grasses24 have placed their evolutionary origin in the
3 ancestors, yet phylogenetic analyses of C
Oligocene, ca. 30 Ma ago, and more than 20 Ma before isotopic evidence supporting the spread of s avannas10,19.
Diverse proxies indicate a steep decline in C ligocene12, consistent with the physiological argu-
O2 in the early O
ments for the advantages of the C4 CO2 concentration mechanism. However, environmental conditions favour-
ing selection for C 4 photosynthesis were not the same as those favouring the assembly and spread of C 4 grassy
biomes25: the evolution of the C 4 pathway was a necessary but not sufficient prerequisite. The C 4 pathway appears
to have been a preadaptation to the more seasonal, open environments which were to emerge later. The phylogeny
of the grasses that define the biome does not, therefore, allow us to date the key ecological transition from closed
forests to open grassy ecosystems.
Rather than focus on the age of taxa that define a habitat, the dating of lineages that have diversified within
that habitat might better capture information on its origins. For example, epiphytes or lianas, rather than trees,
can be used as markers of closed forest: trees create the closed canopy, but epiphytes and lianas that are restricted
to forest, provide a much better indicator of the presence and extent of forest habitat26. Predicated on the reason-
able assumption that speciation rates correlate with available area27, lineage diversification within a habitat may
provide an indicator of its geographical extent. Thus, by dating the radiation of clades tightly associated with a
particular biome, we may infer its likely a ge28. Knowledge on the ecology of radiating clades can additionally
provide insights into the environmental context that favoured important ecological and evolutionary transitions.
For example, in the Cerrado, a South American C4 savanna, the evolution of fire-resistance arose multiple times
independently within the last 4 to 10 Ma, and suggests a relatively recent, fiery, origin of Cerrado v egetation29.
Here we use the evolutionary relationships between savanna and forest trees to explore the origins of African
savanna.
Results
Using a well-sampled, time-calibrated phylogenetic tree of the woody flora, we examine the timing of 139 evo-
lutionary splits between savanna trees in Africa as a marker for the age of the savanna biome. Because we are
interested in capturing the oldest diversifications, as these will most closely align to the age of the biome, we
focus on these older dates. We then project the distribution of branching times on to a map of southern Africa
to explore the geographic arrangement in the timing of expansion of the savanna biome across latitudes.
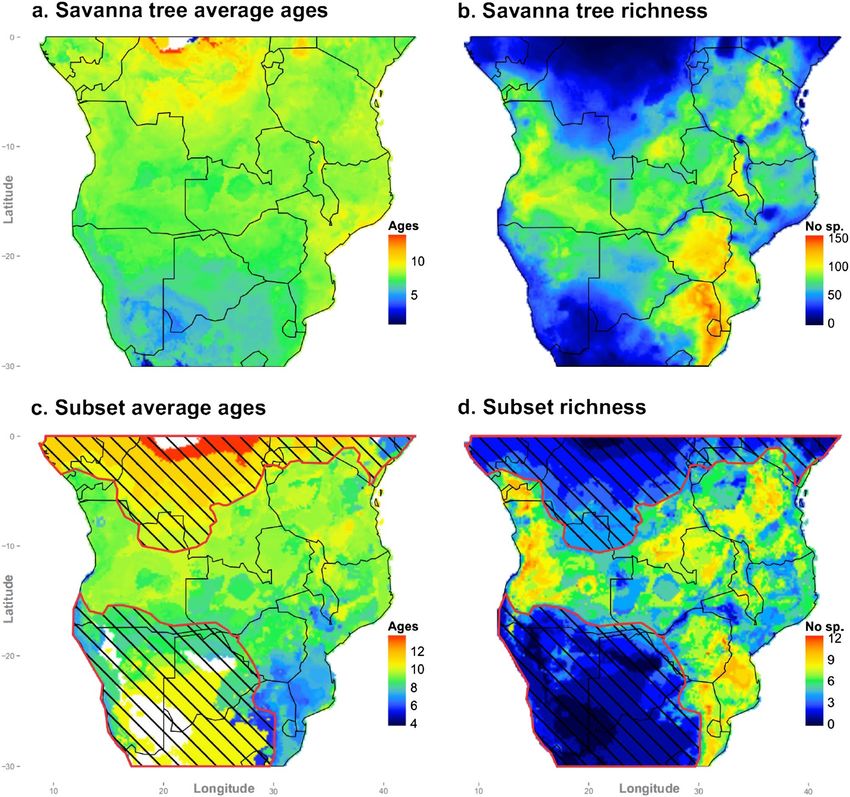
Our results provide unique phylogenetic evidence supporting a latitudinal gradient in the spread of savanna
across Africa (Fig. 1). The phylogenetic signature of savanna expansion indicates a southerly progression from
more tropical latitudes over several millions of years (slope = 0.28 [s.e. = 0.11], t = 2.59, p < 0.02, from the quantile
linear regression on the top 10% oldest savanna tree ages; Fig. 2). One obvious outlier (see Fig. 2), representing
the evolutionary split between Bolusanthus speciosus and Pericopsis angolensis within Fabaceae, was excluded
from the quantile regression. Divergence times for this sister pair were likely overestimated because of the
relatively poor sampling of closely related species within these clades (see ref.30). In contrast, we observed no
obvious gradient in divergence times across latitude for forest trees (slope = 0.08 [s.e. = 0.14], t = 0.55, p = 0.58,
from the quantile linear regression on the top 10% oldest forest tree ages; see Supplementary Figure S1, which
shows the latitudinal trend in evolutionary splits in forest sister taxa, excluding divergences older than 25 Ma
for comparison with Fig. 2). If the latitudinal trend indicating younger ages at higher latitudes was simply a
sampling artefact (e.g. a greater sampling of taxa at high latitudes more finely splitting evolutionary branch
lengths separating sister species), such bias should be equally apparent in forest and savanna trees. The quantile
Scientific Reports | (2020) 10:12430 | https://doi.org/10.1038/s41598-020-69378-0 2
Vol:.(1234567890)www.nature.com/scientificreports/
Figure 1. Geographical distribution of splits between savanna sister tree species. (a), distribution of mean ages
in millions of years for savanna tree evolutionary splits (Supplementary Table 1); (b), species richness of savanna
trees; (c), distribution of savanna tree sister ages estimated from the 90th quantile of evolutionary splits fit to
the regression in Fig. 2; and (d), richness of savanna tree species used for the estimation in (c). Hatched areas
correspond to low diversity regions not supporting savanna vegetation (in the south) and under-sampling in
the north. Maps were generated in the R statistical computing environment (version 3.2.0; https://www.r-proje
ct.org/) using the R library ggplot2 (version 1.0.1; https://ggplot2.tidyverse.org/).
regression through the top 5% oldest ages reveals a similar distinction between latitudinal trends in forest and
savanna tree ages (slope = 0.46 [s.e. = 0.14], t = 3.38, p < 0.01 and slope = 0.18 [s.e. = 0.21], t = 0.86, p = 0.39, for
savanna and forest trees, respectively), and suggests an older age of savanna trees at the equator, although this
estimate is informed by only few divergence times.
In Supplementary Figures S2 and S3 we show data for savanna and forest sister taxa, respectively, calculating
mean latitude from ranges truncated at 15° North and excluding evolutionary splits between sister taxa older
than 25 Ma (see above). Results are qualitatively similar to those truncating species distributions at the equator,
supporting a strong latitudinal gradient in evolutionary splits between savanna trees, with older ages at lower
latitudes, but little evidence for any latitudinal trend among forest species.
We found biome membership was significantly phylogenetically conserved (D = 0.59, and D = 0.57, for forest
and savanna biome membership, respectively, where D = 1 indicates random phylogenetic structure and D = 0
matches to a Brownian motion model of trait e volution31, indicating that evolutionary transitions between biome
type are relatively rare. Thus even if biomes shifted geographically, the composition of lineages that comprise
them may have changed little.
Scientific Reports | (2020) 10:12430 | https://doi.org/10.1038/s41598-020-69378-0 3
Vol.:(0123456789)www.nature.com/scientificreports/
Figure 2. Quantile regression of savanna tree evolutionary splits across latitudes. The dashed lines indicate the
90th and 95th quantiles of divergence times between savanna trees (see “Methods” section), and is referenced to
the age of hominin fossils at equivalent latitudes extracted from the literature (Supplementary Table 2). Latitude
indicates degrees south. The age and latitude of fossil sites indicating the presence of grassy ecosystems (data
from ref.32 and included in Supplementary Table 3) shown with X’s, and highlight the sparsity of fossil data at
higher latitudes.
Our analysis indicates a best estimate of tropical savanna age of ca. 10–15 Ma, while at 30° S the savanna biome
may date back to only ca. 3 Ma. Nonetheless, we recognise that there is uncertainty in our age estimates, reflecting
phylogenetic uncertainty in phylogenetic node calibrations. Supplementary Figures S4 and S5 show the 95%
Highest Posterior Density (HPD) intervals for divergence times between savanna trees (from ranges truncated
at the equator and 15° North, respectively). Fitted lines are through the 10% quantile of the mean HPD (black)
upper 95% HPD (red) and lower 5% HPD (blue). These figures suggest that tropical savanna could be as old as
20 + Ma, and as young as ~ 1–2 Ma. The latter estimate is highly implausible given current knowledge of the fossil
record, and both upper and lower extremes do not reflect the true distribution of evolutionary splits represented
by any single phylogenetic reconstruction (i.e. no one reconstructed phylogeny encompasses the plotted variation
in evolutionary splits), but rather sample the maximum and minimum estimates of evolutionary splits between
sister taxa across the entire posterior distribution of dated phylogenies, and we present them here simply to
bracket the bounds of age estimates, and to illustrate the robustness of the latitudinal gradient in savanna age.
Discussion
Using evolutionary divergence times between savanna trees, we infer a latitudinal gradient in the age of the
savanna biome in Africa. Our best estimates of subtropical savanna ages suggest a date of biome expansion
between 10 and 15 Ma, while more southerly savanna has origins that may be no older than 3–4 Ma. Our results
also match closely to fossil evidence supporting dates for the first appearance of grassy ecosystems at tropical
to subtropical latitudes around this time. In East Africa, earliest evidence of grasslands dates to between 15 and
17.5 Ma [see ref32 and citations therein], with a transition to C4 dominated grassland from 10 Ma33. While pockets
of C4 grassland may have existed prior to this latter date, there was a general transition towards an increasing
proportion of C4 to C3 grasses from 10 Ma to present34, which likely reflected a more extensive shift to C4 grass-
lands across East and Southern A frica32.
The large-scale vegetation change from forest to savanna would have triggered major evolutionary shifts in
faunal communities and perhaps facilitated hominin evolution of bipedalism (suggesting ground-living vs. tree-
climbing in apelike hominins), and larger brains, precipitating the development of speech, use of fire, stone tool
making, and hunting35. Although our analysis provides no direct evidence linking early hominin evolution to the
spread of savanna, it is notable that our savanna age estimates match closely to the hominin fossil record (Fig. 2),
which shows oldest lineages, with ages going back to 6–7 Ma, near the equator, and younger lineages arising at
higher latitudes, as suggested by the fossil deposits in South Africa from about 2 Ma and coincident with the
extraordinary recent discovery of at least 15 Homo naledi individuals in the Dinaledi Chamber, which, although
not yet geologically dated, appear to be younger than 1 Ma based on a phylogenetic ‘morphological clock’36.
Cerling et al.10 predicted that savannas arose earliest in the tropics and only later at higher latitudes from the
photosynthetic response of C 3 and C
4 plants to temperature and partial pressure of C
O2 (pCO2). With continued
decline of pCO2 from the Late Miocene, C4 grass photosynthesis would be favoured over C3 plants by lower grow-
ing season temperatures in cooler southern latitudes11. While there is some support for this pattern, the fossil
Scientific Reports | (2020) 10:12430 | https://doi.org/10.1038/s41598-020-69378-0 4
Vol:.(1234567890)www.nature.com/scientificreports/
record does not provide sufficient details to detect evidence for a latitudinal gradient in the spread of savannas
to southern Africa19. We here infer the age of African savanna by examining the evolutionary splits between
tree species that likely diverged in the savanna biome, and derive age estimates broadly consistent with Cerling
et al.’s10 original prediction on savanna spread.
Phylogenetic data offer a valuable source of information on past environments in Africa that complements
that from the fossil record. Fossils provide detailed point information, whereas phylogenetic data are spatially and
temporally extensive, but nonetheless rely on accurately dated and identified fossils for calibration. Importantly,
however, while we calibrate our phylogeny using the fossil record, the fossil calibrations are not restricted to
fossils from Africa but are informed by the global angiosperm fossil record and our Bayesian posterior distribu-
tion of node ages simultaneously integrates across multiple calibration points, providing more reliable estimates
than any single data point.
Phylogenetic approaches additionally allow us to step through evolutionary time (see ref.37), and thus infer
time sequence in the latitudinal expansion of savanna, independent from, although consistent with, isotopic
evidence. The timing of origin of lineages with particular adaptations, such as the underground lifeform of
trees in fire maintained s avannas38, can also reveal the ecological context within which early hominin evolution
played out. A natural extension would be to explore other signature clades, which, when calibrated using differ-
ent fossils, could provide independent lines of evidence. For example, different elements of the biota character-
izing the African savanna (e.g., spiny plants39, bovids40, carnivores41), have diversified since the mid Miocene,
contemporaneous with our tree ages. Our focus on trees here provides a broad-brush approach to the origin
and spread of savanna. With the addition of better resolved and dated phylogenies, we may gain further insights
into our prehistory.
Methods
Phylogenetic and spatial data. We focused on the woody plants of sub-Saharan Africa, and sample all
the major lineages of southern African trees, following recent taxonomic rearrangements (notably, the quintes-
sentially African genus Acacia is now recognised as polyphyletic and African Acacia are included in our data-
set as two separate genera, Senegalia and Vachellia, following ref.42). Phylogenetic relationships and divergence
times were extracted from the dated phylogenetic tree of Charles-Dominique and colleagues39, sampling over
1800 of the ca. 2000 woody taxa of sub-Saharan Africa. This phylogenetic hypothesis was generated using DNA
sequences for the core plant barcodes matK and rbcL using maximum likelihood (ML) and Bayesian inference.
The ML analysis was run in raxmlGUI43, enforcing topological constraint based on an APG III backbone in
Phylomatic44. Branch lengths were made proportional to time using BEAST45 assuming an uncorrelated log-
normal distribution for the molecular clock model and 20 secondary calibration points obtained from ref.46 as
minimum age constraints. Full details are provided in refs.38 and39.
Species range maps were obtained from ref.38, and represent outputs from MaxEnt47 species distribution
models fitted to point data from the African plants database (https://www.ville-ge.ch/cjb/) supplemented by
records from the Naturalis Biodiversity Center (https://www.naturalis.nl/) and the Global Biodiversity Infor-
mation Facility (GBIF; https://www.gbif.org). The MaxEnt presence-absence maps were estimated from the 19
WorldClim48 bioclimatic variables using the equal training sensitivity and specificity t hreshold49 and imposing
spatial filters to account for geographically restricted ranges, following ref.50.
Because our focus here was on the southward expansion of savanna from the tropics and geographical sam-
pling is increasingly sparse as we move to northern latitudes, we truncated species distributions at the equator.
We evaluate sensitivity of our analyses by changing this latitudinal threshold to match distribution data from
ref.39 (see below), but note that more northerly distributions have generally been less well sampled.
Taxa were coded as primarily associated with one of three broad habitat types: savanna, forest and fynbos,
using regional floras and expert knowledge (see ref. 38). Savannas were defined as tree–grass mixtures where C4
grasses form a near-continuous herbaceous layer which is absent from f orest51.
Statistical analysis. It is not straightforward to assess the directionality of an evolutionary split between
forest and savanna trees across the forest-savanna boundary without information on the ancestral state; there-
fore, we identified early lineage diversification events that likely occurred within the savanna biome by con-
sidering only splits in which both sister lineages were savanna trees and extracted their divergence times. The
phylogenetic positions of savanna sister pairs are shown in Supplementary Figures S6. We assume the sister pair
divergence most likely occurred within the habitat type in which they are both present (i.e., savanna species pairs
diverged in the savanna biome). The maximum age between sister pairs thus represents a minimum date for the
age of the biome. Younger divergences observed within this time frame would not invalidate the age estimate
for the biome, indeed we might predict multiple evolutionary splits between taxa that span the age of the biome
from its origin to the present day, but only the oldest split provides information on biome age (i.e. the biome
must be at least this old for us to observe an evolutionary divergence between taxa restricted to the biome). To
evaluate potential bias in sampling, we repeated the process for forest sister pairs. Because the forest habitat type
is ancient, we should not detect any strong trend in the age of forest sister pairs with latitude.
We explored the relationship between latitude (mean of the two species latitudinal distribution ranges) and
age of splits between savanna trees using quantile linear regression in the R package q uantreg52. When we had
data on the geographic distribution for only one of the species in a sister pair, we used the mean latitudinal
position of that species in our model. The quantile linear regression was performed on the top 10% and 5% of
oldest ages as the young splits are uninformative about the first spread of savannas (see above). We tested the
regression by Markov chain marginal bootstrapping (999 permutations) and used the model coefficients to infer
the timing of savanna establishment.
Scientific Reports | (2020) 10:12430 | https://doi.org/10.1038/s41598-020-69378-0 5
Vol.:(0123456789)www.nature.com/scientificreports/
We believe our approach, focussing on divergence times between sister taxa, has multiple strengths: (1) the
relative young age of the savanna has typically not provided sufficient time for tree species to radiate within
the biome, thus the sample size of such ‘savanna clades’ would be small. While some clades have radiated spec-
tacularly within some biomes in southern Africa, even these remarkable evolutionary events tend to play-out
over time spans that may be greater than the age of the savanna biome (e.g. see refs53 and54). (2) By focussing
on sister taxa we avoid the necessity of inferring ancestral states (i.e. biome affinity) for clades, which is not
straightforward and often associated with large uncertainty. (3) Our phylogeny, which is the largest reconstructed
phylogeny for African woody taxa, is obviously incomplete; woody taxa are not a monophyletic group, and as
we move towards the root of the phylogeny clades are more likely to include species that occur outside Africa,
and which are therefore not included in our sample. By contrast, we are fairly confident that the sister pairs
we identify represent true sister pairs. Nonetheless, we also recognise limitations to a sister-taxon approach.
Divergence times between extant sister pairs can be influenced by both speciation and extinction (extinction of
a sister taxon can draw back divergence times to the most recent common ancestor of extant taxa). Although for
our purposes, here, this distinction is not important unless the probability of a sister taxon going extinct varies
both across latitude and between forest and savanna trees. It is also possible that by focussing on sister taxa, we
miss information on diversification events deeper in the tree. However, if the signature of savanna-mediated
diversification was deeper in the phylogeny, we would not expect to see any latitudinal signature in sister taxa
ages, thus, this provides a reasonable null expectation to test in our analysis.
Our analysis additionally assumes that species present-day distributions provides a meaningful approxima-
tion of their historical origins. It has been suggested that the paleoclimate of southern Africa was been relatively
stable through the Q uaternary55, with larger climatic shifts, such as those associated with changes in the Ben-
guela Current upwelling s ystem56, occurring over the evolutionary time spans of our data, and are likely part of
the explanation for the patterns we observe. To explore evolutionary lability in biome affinity, we recoded each
biome type as a binary variable, estimated strength of phylogenetic niche conservatism in biome membership
using the D-statistic31, a measure of phylogenetic signal in a binary trait, and tested significance using permuta-
tions (n = 1000).
The geographical distribution of evolutionary split ages was projected by overlaying species distributions on a
0.1° × 0.1° grid, and weighting cells by the mean divergence time of overlapping species. The value of each map cell
therefore represents the average evolutionary age of the savanna sisters species with ranges that overlap with it.
Received: 3 March 2020; Accepted: 31 March 2020
References
1. Domínguez-Rodrigo, M. Is the “Savanna Hypothesis” a dead concept for explaining the emergence of the earliest hominins?. Curr.
Anthropol. 55, 59–81 (2014).
2. Cerling, T. E. et al. Woody cover and hominin environments in the past 6 million years. Nature 476, 52–56 (2011).
3. Potts, R. Hominin evolution in settings of strong environmental variability. Q. Sci. Rev. 73, 1–13 (2013).
4. Magill, C. R., Ashley, G. M. & Freeman, K. H. Ecosystem variability and early human habitats in eastern Africa. Proc. Natl Acad.
Sci. USA 110, 1167–1174 (2013).
5. Levin, N. E. Environment and climate of early human evolution. Annu. Rev. Earth Planet. Sci. 43, 405–429 (2015).
6. Uno, K. T., Polissar, P. J., Jackson, K. E. & deMenocal, P. B. Neogene biomarker record of vegetation change in eastern Africa. Proc.
Natl Acad. Sci. USA 113, 6355–6363 (2016).
7. Jacobs, B. F. Paleobotanical studies from tropical Africa: relevance to the evolution of forest, woodland, and savannah biomes.
Phil. Trans. R. Soc. B 359, 1573–1583 (2004).
8. Beerling, D. J. & Osborne, C. P. The origin of the savanna biome. Glob. Chang. Biol. 12, 2023–2031 (2006).
9. Bond, W. J. What limits trees in C4 grasslands and savannas?. Annu. Rev. Ecol. Evol. Syst. 39, 641–659 (2008).
10. Cerling, T. E. et al. Global vegetation change through the Miocene/Pliocene boundary. Nature 389, 153–158 (1997).
11. Ehleringer, J. R., Cerling, T. E. & Helliker, B. R. C
4 photosynthesis, atmospheric C O2, and climate. Oecologia 112, 285–299 (1997).
12. Beerling, D. J. & Royer, D. L. Convergent cenozoic C O2 history. Nat. Geosci. 4, 418–420 (2011).
13. Pagani, M., Zachos, J. C., Freeman, K. H., Tipple, B. & Bohaty, S. Marked decline in atmospheric carbon dioxide concentrations
during the Paleogene. Science 309, 600–603 (2005).
14. Pagani, M., Freeman, K. H. & Arthur, M. A. Late Miocene atmospheric CO2 concentrations and the expansion of C4 grasses.
Science 285, 876–879 (1999).
15. Bolton, C. T. et al. Decrease in coccolithophore calcification and C O2 since the middle Miocene. Nat. Commun. 7, 10284 (2016).
16. Herbert, T. D. et al. Late Miocene global cooling and the rise of modern ecosystems. Nat. Geosci. 9, 843–847 (2016).
17. Sponheimer, M. et al. Isotopic evidence of early hominin diets. Proc. Natl Acad. Sci. USA 110, 10513–10518 (2013).
18. Feakins, S. J. et al. Northeast African vegetation change over 12 my. Geology 41, 295–298 (2013).
19. Ségalen, L., Lee-Thorp, J. A. & Cerling, T. E. Timing of C 4 grass expansion across sub-Saharan Africa. J. Hum. Evol. 53, 549–559
(2007).
20. Pennington, R. T., Cronk, Q. C. B. & Richardson, J. A. Introduction and synthesis: plant phylogeny and the origin of major biomes.
Phil. Trans. R. Soc. B. 359, 1455–1464 (2004).
21. Pennington, R. T., Richardson, J. E. & Lavin, M. Insights into the historical construction of species-rich biomes from dated plant
phylogenies, neutral ecological theory and phylogenetic community structure. New Phytol. 172, 605–616 (2006).
22. Bytebier, B., Antonelli, A., Bellstedt, D. U. & Linder, H. P. Estimating the age of fire in the Cape flora of South Africa from an orchid
phylogeny. Proc. R. Soc. B 278, 188–195 (2010).
23. Crisp, M. D., Burrows, G. E., Cook, L. G., Thornhill, A. H. & Bowman, D. M. Flammable biomes dominated by eucalypts originated
at the Cretaceous-Palaeogene boundary. Nat. Comm. 2, 193 (2011).
24. Vicentini, A., Barber, J. C., Aliscioni, S. S., Giussani, L. M. & Kellogg, E. A. The age of the grasses and clusters of origins of C4
photosynthesis. Glob. Chang. Biol. 14, 2963–2977 (2008).
25. Scheiter, S. et al. Fire and fire-adapted vegetation promoted C4 expansion in the Late Miocene. New Phytol. 195, 653–666 (2012).
26. Ramírez, S. R., Gravendeel, B., Singer, R. B., Marshall, C. R. & Pierce, N. E. Dating the origin of the Orchidaceae from a fossil
orchid with its pollinator. Nature 448, 1042–1045 (2007).
Scientific Reports | (2020) 10:12430 | https://doi.org/10.1038/s41598-020-69378-0 6
Vol:.(1234567890)www.nature.com/scientificreports/
27. Losos, J. B. & Schluter, D. Analysis of an evolutionary species–area relationship. Nature 408, 847–850 (2000).
28. Linder, H. P. & Verboom, G. A. The evolution of regional species richness: the history of the southern African flora. Annu. Rev.
Ecol. Evol. Syst. 46, 393–412 (2015).
29. Simon, M. F. et al. Recent assembly of the Cerrado, a neotropical plant diversity hotspot, by in situ evolution of adaptations to fire.
Proc. Natl Acad. Sci. USA 106, 20359–20364 (2009).
30. Cardoso, D. et al. A molecular-dated phylogeny and biogeography of the monotypic legume genus Haplormosia, a missing African
branch of the otherwise American-Australian Brongniartieae clade. Mol. Phylogenet. Evol. 107, 431–442 (2017).
31. Fritz, S. A. & Purvis, A. Selectivity in mammalian extinction risk and threat types: a new measure of phylogenetic signal strength
in binary traits. Conserv. Biol. 24, 1042–1051 (2010).
32. Linder, H. P. East African Cenozoic vegetation history. Evol. Anthropol. 26, 300–312 (2017).
33. Retallack, G. J. Middle Miocene fossil plants from Fort Ternan (Kenya) and evolution of African grasslands. Paleobiology 18,
383–400 (1992).
34. Uno, K. T. et al. Late Miocene to Pliocene carbon isotope record of differential diet change among East African herbivores. Proc.
Natl. Acad. Sci. USA 108, 6509–6514 (2011).
35. Dart, R. A. Australopithecus africanus: the man-ape of South Africa. Nature 115, 195–199 (1925).
36. Dembo, M. et al. The evolutionary relationships and age of Homo naledi: An assessment using dated Bayesian phylogenetic meth-
ods. J. Hum. Evol. 97, 17–26 (2016).
37. Davies, T. J. & Buckley, L. B. Phylogenetic diversity as a window into the evolutionary and biogeographic histories of present-day
richness gradients for mammals. Phil. Trans. R. Soc. B 366, 2414–2425 (2011).
38. Maurin, O. et al. Savanna fire and the origins of the ‘underground forests’ of Africa. New Phytol. 204, 201–214 (2014).
39. Charles-Dominique, T. et al. Spiny plants, mammal browsers, and the origin of African savannas. Proc. Natl Acad. Sci. USA 113,
E5572–E5579 (2016).
40. Bibi, F. A multi-calibrated mitochondrial phylogeny of extant Bovidae (Artiodactyla, Ruminantia) and the importance of the fossil
record to systematics. BMC Evol. Biol. 13, 166 (2013).
41. Nyakatura, K. & Bininda-Emonds, O. Updating the evolutionary history of Carnivora (Mammalia): a new species-level supertree
complete with divergence time estimates. BMC Biol. 10, 12 (2012).
42. Kyalangalilwa, B., Boatwright, J. S., Daru, B. H., Maurin, O. & van der Bank, M. Phylogenetic position and revised classification of
Acacia s.l. (Fabaceae: Mimosoideae) in Africa, including new combinations Vachellia and Senegalia. Bot. J. Linn. Soc. 172, 500–523
(2013).
43. Silvestro, D. & Michalak, I. raxmlGUI: a graphical front-end for RAxML. Org. Divers. Evol. 12, 335–337 (2012).
44. Webb, C. O. & Donoghue, M. J. Phylomatic: tree assembly for applied phylogenetics. Mol. Ecol. Notes 5, 181–183 (2005).
45. Drummond, A. J., Suchard, M. A., Xie, D. & Rambaut, A. Bayesian Phylogenetics with BEAUti and the BEAST 1.7. Mol. Biol. Evol.
29, 1969–1973 (2012).
46. Bell, C. D., Soltis, D. E. & Soltis, P. S. The age and diversification of the angiosperms re-revisited. Am. J. Bot. 97, 1296–1303 (2010).
47. Phillips, S. J. et al. Maximum entropy modeling of species geographic distributions. Ecol. Model. 190, 231–259 (2006).
48. Hijmans, R. J., Cameron, S. E., Parra, J. L., Jones, P. G. & Jarvis, A. Very high resolution interpolated climate surfaces for global
land areas. Int. J. Climatol. 25, 1965–1978 (2005).
49. Liu, C., Berry, P. M., Dawson, T. P. & Pearson, R. G. Selecting thresholds of occurrence in the prediction of species distributions.
Ecography 28, 385–393 (2005).
50. Blach-Overgaard, A., Svenning, J. C., Dransfield, J., Greve, M. & Balslev, H. Determinants of palm species distributions across
Africa: the relative roles of climate, non-climatic environmental factors, and spatial constraints. Ecography 33, 380–391 (2010).
51. Ratnam, J. et al. When is a ‘forest’ a savanna, and why does it matter?. Glob. Ecol. Biogeogr. 20, 653–660 (2011).
52. Koenker, R. quantreg: Quantile Regression. R package version 5.05 (https://CRAN.R-project.org/package=quantreg, 2013).
53. Richardson, J. E. et al. Rapid and recent origin of species richness in the Cape flora of South Africa. Nature 412, 181–183 (2001).
54. Verboom, G. A. et al. Origin and diversification of the Greater Cape flora: ancient species repository, hot-bed of recent radiation,
or both?. Mol. Phylog. Evol. 51, 44–53 (2009).
55. Dynesius, M. & Jansson, R. Evolutionary consequences of changes in species’ geographical distributions driven by Milankovitch
climate oscillations. Proc. Natl Acad. Sci. USA 97, 9115–9120 (2000).
56. deMenocal, P. B. African climate change and faunal evolution during the Pliocene-Pleistocene. Earth Planet. Sci. Lett. 220, 3–24
(2004).
Acknowledgements
We thank the Government of Canada through Genome Canada and the Ontario Genomics Institute (2008-OGI-
ICI-03), and the University of Johannesburg (Analytical Facility) for financial support.
Author contributions
W.J.B. and T.J.D. designed the study, B.H.D., B.S.B, G.P.H., R.M.K., O.M., A.M.M. and M.v.d.B. helped with data
processing, and T.J.D., B.H.D. and T.C.-D. performed the analyses. W.J.B., B.H.D. and T.J.D. wrote the manuscript
with substantial contributions from all authors.
Competing interests
The authors declare no competing interests.
Additional information
Supplementary information is available for this paper at https://doi.org/10.1038/s41598-020-69378-0.
Correspondence and requests for materials should be addressed to T.J.D. or W.J.B.
Reprints and permissions information is available at www.nature.com/reprints.
Publisher’s note Springer Nature remains neutral with regard to jurisdictional claims in published maps and
institutional affiliations.
Scientific Reports | (2020) 10:12430 | https://doi.org/10.1038/s41598-020-69378-0 7
Vol.:(0123456789)www.nature.com/scientificreports/
Open Access This article is licensed under a Creative Commons Attribution 4.0 International
License, which permits use, sharing, adaptation, distribution and reproduction in any medium or
format, as long as you give appropriate credit to the original author(s) and the source, provide a link to the
Creative Commons license, and indicate if changes were made. The images or other third party material in this
article are included in the article’s Creative Commons license, unless indicated otherwise in a credit line to the
material. If material is not included in the article’s Creative Commons license and your intended use is not
permitted by statutory regulation or exceeds the permitted use, you will need to obtain permission directly from
the copyright holder. To view a copy of this license, visit http://creativecommons.org/licenses/by/4.0/.
© The Author(s) 2020
Scientific Reports | (2020) 10:12430 | https://doi.org/10.1038/s41598-020-69378-0 8
Vol:.(1234567890)You can also read