QUANTITATIVE ECOLOGICAL RISK ASSESSMENT OF SHORTFIN MAKO SHARK (ISURUS OXYRINCHUS): PROPOSED MODEL AND APPLICATION EXAMPLE
←
→
Page content transcription
If your browser does not render page correctly, please read the page content below
Duarte et al.: Quantitative ecological risk assessment of shortfin mako shark (Isurus oxyrinchus)
- 3691 -
QUANTITATIVE ECOLOGICAL RISK ASSESSMENT OF
SHORTFIN MAKO SHARK (ISURUS OXYRINCHUS): PROPOSED
MODEL AND APPLICATION EXAMPLE
DUARTE, H. O.1* – DROGUETT, E. L.2 – MOURA, M. C.3
1
Mechanical Engineering Department, Federal University of Pernambuco
Rua Acadêmico Hélio Ramos, s/n, Cidade Universitária, CTG
Departamento de Engenharia Mecânica, Curso de Engenharia Naval
50740-530 Recife-PE, Brazil
(e-mail: heitorod@gmail.com; phone: +55-(81)-2126-8230; fax: +55-(81)-2126-8231)
2
Mechanical Engineering Department, University of Chile
Av. Beauchef 581, West Building, Room 411, 7630000 Santiago, Chile
(e-mail: elopezdroguett@ing.uchile.cl; phone: +56-9- 9545-1449; fax: +56-22-978-0861)
3
Production Engineering Department, Federal University of Pernambuco
Rua Acadêmico Hélio Ramos, s/n, Cidade Universitária, CTG
Departamento de Engenharia de Produção
50740-530 Recife-PE, Brazil
(e-mail: marciocmoura@gmail.com; phone: +55-(81)-2126-7112; fax: +55-(81)-2126-8728)
*Corresponding author
e-mail: heitorod@gmail.com; phone: +55-(81)-2126-8230; fax: +55-(81)-2126-8231
(Received 31st Jan 2018; accepted 2nd May 2018)
Abstract. Most of the world’s catches of sharks are incidentally taken by tuna fishing gear, constituting
bycatches that increase the extinction risk of several species of shark. This not only alters ecosystem
functions by removing top predators, but may also hinder the industry production itself due to cutoff
measures set by authorities. This paper focuses on the female population abundance of a very important
bycatch species, the shortfin mako shark (Isurus oxyrinchus), and proposes a stochastic model for
quantitative risk assessment under varying harvest regimes and control measures. The proposed model
can be applied to any shortfin mako shark population by changing initial conditions and harvest
parameters. The flexibility of the model makes it practicable to simulate hundreds of scenarios, analyse
and compare the most relevant results such as the risk of extinction caused by a given harvest regime,
median time to extinction, expected minimum biomass, risk of low harvest, and risk reduction caused by
control measure; these outcomes are useful for rational decisions under uncertainty. We present an
application example as a means to demonstrate how the proposed model can be used to drive
management decisions for sustainable tuna harvest.
Keywords: stochastic model, probabilistic systems, sensitivity analysis, monte carlo simulation,
ecological modeling
Introduction
Fishes represent the only major food source still harvested from wild populations
(Ryman et al., 1995). In 2014, fish harvested from aquaculture amounted an estimated
first-sale value of U$160.2 billion (FAO, 2016). Tunas and tuna-like species are an
important food source, used mostly for canning and sashimi, and, because of their high
economic value and extensive international trade, are an important global commodity.
The total catch of tuna and tuna-like species was about 7.4 million tons, representing
9% of the global catch in 2013. Tuna fishing is undertaken by thousands of vessels in
APPLIED ECOLOGY AND ENVIRONMENTAL RESEARCH 16(3):3691-3709.
http://www.aloki.hu ● ISSN 1589 1623 (Print) ● ISSN 1785 0037 (Online)
DOI: http://dx.doi.org/10.15666/aeer/1603_36913709
2018, ALÖKI Kft., Budapest, HungaryDuarte et al.: Quantitative ecological risk assessment of shortfin mako shark (Isurus oxyrinchus)
- 3692 -
the Pacific, Indian and Atlantic oceans, using a range of gear types (e.g., longline)
(Clarke, 2008; FAO, 2016; Gilman and Lundin, 2008; Hamilton et al., 2011).
Most of the world’s catches of sharks are incidentally taken by various types of tuna
fishing gear, constituting bycatch that is either discarded at sea (without fins or dead) or
landed for sale (Carvalho et al., 2011). Bycatches increase the risk of extinction of
several species of shark and alters ecosystem functions by removing top predators
(Myers and Baum, 2007). Moreover, bycatches cause economical risk to the industry
because of conservation limits set by the International Commission for the Conservation
of Atlantic Tunas (ICCAT), i.e., a cutoff threshold at which fishing should stop, often
set at 20% of the unfished equilibrium abundance of relevant species such as the mako
shark (Smith et al., 1993). In other words, if mako shark population declines more than
80% of its unfished equilibrium abundance, tunas’ harvest must be forbidden. Thus, we
focus here on a shark species mainly because there has been increasing concern about
the status of some shark stocks and the population-level effects caused by their
exploitation (Anon, 2009, 2013; Carvalho et al., 2011; FAO, 1999; Myers and Baum,
2007).
The adult shortfin mako shark (SMA) (Isurus oxyrinchus) is an apex predator at the
top of the marine environment food web and it is not a prey to any marine animal.
These sharks are long lived, slow growing, reach sexual maturity late in their life
history, and produce few offspring (Levesque, 2007). They have a common total length
of 270 cm, maximum total length of 445 cm (Weigmann, 2016), maximum published
weight of 50.,8 kgs and maximum reported age of 32 years (Natanson et al., 2006).
This work focuses on the SMA for several reasons (Anon, 2009, 2013; Cosandey-
Godin and Morgan, 2011; Levesque, 2007): (i) its relatively high abundance and
presence in multiple and widespread fisheries; (ii) it is captured in great numbers in all
oceans and ranks as one of the most dominant species caught in pelagic longlines and
gillnets; (iii) it is considered an apex predator at the top of the marine environment food
web; (iv) female SMAs are being caught below the size of maturity; (v) unlike most
shark species, the SMA is economically important due to both its quality of meat and
fins; (vi) it is a valuable product of the pelagic longline swordfish and tuna fisheries;
(vii) failures in conservation management of SMA can be significant and costly.
Therefore, we propose a stochastic population model for Quantitative Ecological
Risk Assessment (QERA) of SMA bycatch that results from the industrial tuna fishing.
Our model is a useful tool for both conservation of SMA and the sustainable
management of tuna industry. Moreover, it is capable of describing the dynamics of
SMA population under varying conditions (harvest regime and control measures), for
evaluating the role of such conditions, and for producing meaningful conclusions that
can be used to drive conservation and management decisions. The model is thought to
be generic so that it can be applied to any SMA population (e.g., South Atlantic, North
Atlantic, North Pacific) by making minor changes in parameters and initial conditions.
We exemplify the application of the model for the SMA South Atlantic population
and describe means of evaluating risk of extinction and yield associated with alternative
decisions about harvest rates and cutoff threshold. The methodology, used for QERA in
both the model building and application example, is similar to the approach used in
(Duarte et al., 2013, 2014; Duarte and Droguett, 2015), but here it is specifically
tailored for solving the SMA case.
The remainder of the paper is organized as follows. First, we provide a brief
literature review. Second, we propose a model structure to describe the dynamics of the
APPLIED ECOLOGY AND ENVIRONMENTAL RESEARCH 16(3):3691-3709.
http://www.aloki.hu ● ISSN 1589 1623 (Print) ● ISSN 1785 0037 (Online)
DOI: http://dx.doi.org/10.15666/aeer/1603_36913709
2018, ALÖKI Kft., Budapest, HungaryDuarte et al.: Quantitative ecological risk assessment of shortfin mako shark (Isurus oxyrinchus)
- 3693 -
system in any ocean. Next, by means of an application example, we demonstrate how to
conduct a QERA of SMA bycatch implied by tuna fishing based on the proposed model.
Finally, we conclude remarks by presenting the model benefits and shortcomings.
Materials and Methods
Literature Review
Even though the SMA is physiologically unique, economically important, and
exploited in relatively large numbers (Levesque, 2007), there are few population models
for this species (Anon, 2009, 2013). These approaches aimed at diagnosing the
population status over the last 30 years by quantifying measures such as past and
current biomass, and abundance. Conversely, we aim at describing the population
dynamics under varying scenarios over time so that the proposed model can be a useful
tool for rational decisions under uncertainty.
There are some applications of stochastic models for risk assessment of marine fish
(Duarte et al., 2013; Fu et al., 2004; Hart and Cadrin, 2004; Smedbol and Stephenson,
2004) that have the goal of describing the population dynamics over time and under
predefined conditions by using past data for estimating the model parameters and
setting the initial conditions. They include uncertainty in parameters, and thus results
are given in terms of probability. However, at the best of authors’ knowledge, there is
no such approach tailored for mako shark populations.
Yet, our modelling approach is similar to the two models of herring (Fu et al., 2004;
Smedbol and Stephenson, 2004) in the following aspects: (i) it evaluates the risk of
extinction caused by harvest; (ii) includes uncertainty in parameters; (iii) has the
flexibility to include a cutoff measure; and (iv) includes low-frequency events that may
cause recruitment failure, which occurs when individuals at age 0 (pups) have poor
survival due to hypothetical events such as pollution, construction or any human impact
in breeding areas on the coast; or environmentally induced recruitment failure such as
hurricanes, earthquakes, tsunamis. The specific cause of recruitment failure remains a
mystery and there is no research about its effects in SMA, but we assume recruitment
failure may also occur with SMA as happens with other marine fishes (Payne et al.,
2009; Smedbol and Stephenson, 2004).
In spite of the similarities, our approach departs from the abovementioned works in
the following aspects: (i) the proposed model describes a population of a shark species,
which is the utmost difference because sharks and herrings have remarkably different
life histories; (ii) it models females only; (iii) it measures uncertainty about the future
harvest regime through a plausible range of scenarios; and (iv) it evaluates the risk
caused by conservative scenarios of harvest regime (Levesque, 2007). Then, in the next
section, we present the characteristics of the proposed model.
The Proposed Model
The proposed model only considers females because they are a key indicator to
control. In fact, females produce new individuals and keep the life cycle on. Thus,
keeping track of females is more effective to evaluate extinction risk. Furthermore, most
available data are given only for females, probably because of the same aforementioned
reason. Thus, hereafter, “population”, if not specified, refers to “female population”.
APPLIED ECOLOGY AND ENVIRONMENTAL RESEARCH 16(3):3691-3709.
http://www.aloki.hu ● ISSN 1589 1623 (Print) ● ISSN 1785 0037 (Online)
DOI: http://dx.doi.org/10.15666/aeer/1603_36913709
2018, ALÖKI Kft., Budapest, HungaryDuarte et al.: Quantitative ecological risk assessment of shortfin mako shark (Isurus oxyrinchus)
- 3694 -
Then, the purpose of the model is to describe the SMA female abundance over 100
years under varying conditions. Indeed, we consider: (i) a benchmark scenario (Scn-0)
that simulates the natural population dynamics under no harvest; (ii) varying harvest
scenarios with different harvest parameters and (iii) harvest scenarios with and without
a cutoff threshold for which no harvest occurs if abundance falls below it.
Now, let be the abundance of females in stage i; the total abundance of
female population; the survival rate (per year) of females in stage i; the
permanence rate (per year) of females in stage i; f the fecundity rate (pups per year);
the transition rate (per year) from stage j to stage i, where i is the line and j the column
in the matrix; is the harvest rate for stage i; is the abundance threshold for
cutoff; and is the frequency per year that recruitment failure occurs. Note that
; ; ; and . Then, the algorithm described
below constitutes our proposed generic model for SMA female abundance that can be
parameterized to describe the dynamics of the system in any ocean. It represents one
replication for simulating the population model and involves the following steps:
i) If , then make
(Eq.1)
If , then make
(Eq.2)
ii) Otherwise:
(Eq.3)
iii) Generate random number U from a uniform distribution.
If U < , then
(Eq.4)
Table 1 defines the model variables, parameters and initial conditions. The
estimation of parameters and the setting of initial conditions will be explained in next
APPLIED ECOLOGY AND ENVIRONMENTAL RESEARCH 16(3):3691-3709.
http://www.aloki.hu ● ISSN 1589 1623 (Print) ● ISSN 1785 0037 (Online)
DOI: http://dx.doi.org/10.15666/aeer/1603_36913709
2018, ALÖKI Kft., Budapest, HungaryDuarte et al.: Quantitative ecological risk assessment of shortfin mako shark (Isurus oxyrinchus)
- 3695 -
sections. Eq. 1 is a Lefkovitch matrix (Lefkovitch, 1965), which describes the natural
dynamics of the population. We consider a four-stage structure for SMA population:
pups, juveniles, mature adults, and post-reproductive adults. Eq. 2 models the effect of
harvest, which was considered in the simulation to reflect stage selectivity by the
fishery. Note that harvest strategies do not affect survival rates. Instead, for each
scenario, harvest was included by removing a certain proportion of the stage-specific
population every year, and a cutoff threshold was included to simulate a control
measure in which no harvest occurs if the abundance declines belowthat limit. Eq. 3
describes the Density Dependence (DD) effect, which represents a change in the
influence of any factor that affects population growth as the population density changes
(Forbes et al., 2010; Pauwels, 2002). The constants in Eq. 3 refer to the steady-state
population distribution, i.e., the proportion of individuals in each stage (16.9% age 0,
67.8% juveniles, 8.6% mature adults and 6.8% post-reproductive adults) when the
population dynamics reach a stationary state, which is based only on the stage matrix
for Scn-0 and is a result of eigenvalue analysis. For more details, see references
(Akçakaya et al., 1997; Akçakaya and Root, 2013; Burgman et al., 1993). Finally, Eq. 4
allows to include known and/or suspected variations in vital rates (survival and
fecundity) caused by low-frequency, high-consequence events such as recruitment
failure. This is modelled via Bernoulli trials (Burgman et al., 2012).
Note that, although the proposed model structure is thought to be generic, it can be
tailored to incorporate many realistic and case-specific features such as: (i) a stage-
structured SMA population (pups, juveniles, mature adults, and post-reproductive
adults); (ii) stage-specific initial abundance; (iii) uncertainty in parameters such as
survival and fecundity; (iv) Density Denpendency; (v) low-frequency events that may
cause recruitment failure; (vi) stage-specific annual harvest as a proportion of the stage-
specific abundance; and (vii) cutoff threshold for which no harvest occurs if abundance
is below it.
The four stages (pups, juveniles, mature adults, and post-reproductive adults)
considered for female individuals in the population are structured based on
characteristics such as weight, survival, fecundity and harvest rate. A summary of the
female SMA life history in our model is as follows (Fig. 1) (Levesque, 2007). Pups
(stage 0) are born at age 0. Those who survive until age 1 become juveniles (stage 1).
The juveniles, who survive until the age of 19-21, reach maturity and become mature
adults (stage 2). Mature adults who survive produce new pups until the age of 25-27
years, when they reach sexual mortality and become post-reproductive adults (stage 3).
Post-reproductive adults naturally die at an average age of 32 years. By doing so, we
can project the stage-specific population abundance using a Lefkovitch matrix (also
known as Stage matrix) (Lefkovitch, 1965).
The model also considers DD. Authors of fish case studies (Fu et al., 2004; Smedbol
and Stephenson, 2004) had reported difficulty for estimating the DD parameters. Most
assumed Ceiling-type DD (Akçakaya et al., 1999), according to which, on one hand,
vital rates are not affected until the population reaches the carrying capacity K that is the
level of abundance above which population tends to decline. On the other hand, other
types of DD increase vital rates at low density. Thus, Ceiling-type DD is more
conservative to assess extinction because production of new individuals is likely to be
underestimated at low density and, hence, the risk of extinction will be overestimated
(Burgman et al., 1993).
APPLIED ECOLOGY AND ENVIRONMENTAL RESEARCH 16(3):3691-3709.
http://www.aloki.hu ● ISSN 1589 1623 (Print) ● ISSN 1785 0037 (Online)
DOI: http://dx.doi.org/10.15666/aeer/1603_36913709
2018, ALÖKI Kft., Budapest, HungaryDuarte et al.: Quantitative ecological risk assessment of shortfin mako shark (Isurus oxyrinchus)
- 3696 -
Figure 1. Female SMA life cycle. The values above the arrows are estimates for transition and
permanence rates
Then, our model also assumes Ceiling-type DD. If the population significantly grows
so that it reaches K, then it remains at that level until the population decreases below
this level. In this case, K acts as a population ceiling (Akçakaya et al., 1999). These
conditions are modeled in the first and second steps of the algorithm.
The proposed model also includes uncertainty. The effect of parameter uncertainty
on outcomes can be bounded by fitting a Probability Distribution Function (PDF) (e.g.,
Normal or Lognormal) to each parameter chosen from their average, lower and upper
values. For a given scenario, one should define initial conditions and fit a PDF to each
parameter using data, literature information, and/or expert opinion. After that, a chosen
number of replications of the model (say 10,000) can be simulated via Monte Carlo
approach (Kalos and Whitlock, 2008). For a given scenario, the result is a dataset of
abundances, , for each stage i and for each time-step t. From such dataset, the
following summarized outputs can be provided:
PDFs for the proportion of abundance decline within 100 years.
Cumulative Distribution Functions (CDFs) for the time to quasi-extinction
(i.e., 80% population decline) within 100 years.
point estimates originated from either the PDFs or CDFs, i.e.:
o year-specific risk of quasi-extinction (i.e., probability of 80% abundance
decline).
o median time to quasi-extinction.
o expected minimum abundance (i.e., an estimate of the smallest
population size that is expected to occur within 100 years).
o expected total harvest weight at the end of simulation.
o year-specific risk of low harvest (i.e., the probability that the annual
harvest will be at or below a threshold measure).
For the same population, one can conduct a sensitivity analysis of harvest scenarios
and control measures by varying parameters such as and , while keeping all
other parameters the same. For example, by keeping all other parameters the same as in
Scn-0 and varying parameters related to harvest, we aim at evaluating the
added/reduced risk caused by each harvest scenario. Likewise, by keeping all other
parameters the same and varying the cutoff threshold, we aim to assess the reduced risk
caused by this limit that is, in fact, a control measure to satisfy conservation objectives.
APPLIED ECOLOGY AND ENVIRONMENTAL RESEARCH 16(3):3691-3709.
http://www.aloki.hu ● ISSN 1589 1623 (Print) ● ISSN 1785 0037 (Online)
DOI: http://dx.doi.org/10.15666/aeer/1603_36913709
2018, ALÖKI Kft., Budapest, HungaryDuarte et al.: Quantitative ecological risk assessment of shortfin mako shark (Isurus oxyrinchus)
- 3697 -
Thus, the proposed model provides the following outputs: risk categories and ranking
of scenarios for better risk communication to stakeholders; the quantified reduced risk
caused by varying control measures; suggest harvest regime that not only reduces
conservation concerns, but also achieves maximal benefits by increasing yield over the
long term at acceptable risk of low harvest.
Application Example
We conduct an application example and parameterize the proposed model to the
South Atlantic Ocean. The next subsections are useful as a guide on how to apply the
model and interpret results. The outcomes are useful to validate the model, yet they
should not be used to drive real political decisions with regard to conservation of SMA
since data are still uncertain. However, in the future, with more accurate SMA catch
data available, a new round of scenarios can be simulated and the outcomes may be
used for this purpose.
Materials and Data Sources
Data used here are gathered from several public sources. Estimates of parameters
related to the harvest distribution of stages and sex were obtained from onboard
observer’s data provided under request by the Brazilian Ministry of Fisheries and
Aquaculture. An onboard observer after each set filled out the logbooks. Data included
individual records of 33 vessels in the South Atlantic that registered 241,776 SMAs
catches between December/2004 and February/2009. Useful information to this work
also considered: the vessel identification, onboard observer identification, date, location
of fishing ground (latitude and longitude), effort (number of hooks), fork length (cm)
and sex (male, female or not available).
To transform data given in terms of fork length into weight or age and the inverse,
we use the length-weight correlation (Kohler and Casey, 1995) (Eq. 5) and the 3-
parameter Gompertz growth function for SMA, (Natanson, 2002) (Eq. 6), which
produced the most biologically reasonable estimates for females.
(Eq.5)
where: WT = Total weight; L = Fork length (i.e., the length of a fish measured from
the tip of the snout to the end of the middle caudal fin rays and is used in fishes in
which it is difficult to inform where the vertebral column ends (Froese and Pauly,
2011)).
and (Eq.6)
where: t is the age (years); = 88 cm; cm; and k = 0.087 .
From the female total catches, only 7,359 had their fork length measured so that we
transform fork length into age, then into stage, and calculate (respectively for age 0,
juvenile, mature adult and post-reproductive adult) the annual catch percentage for each
stage i, , as 5.95%, 92.21%, 0.38% and 1.46% and the average weight in kg of each
stage as 6.7, 113.9, 329.5, 417.2. Thus, stage-specific harvest rates are estimated for a
specific scenario as follows:
APPLIED ECOLOGY AND ENVIRONMENTAL RESEARCH 16(3):3691-3709.
http://www.aloki.hu ● ISSN 1589 1623 (Print) ● ISSN 1785 0037 (Online)
DOI: http://dx.doi.org/10.15666/aeer/1603_36913709
2018, ALÖKI Kft., Budapest, HungaryDuarte et al.: Quantitative ecological risk assessment of shortfin mako shark (Isurus oxyrinchus)
- 3698 -
(Eq.7)
Bycatch of SMAs results in substantial number of SMAs being discarded dead.
Quantifying total harvest from bycatch is challenging because comprehensive data on
these discards are unavailable (Cosandey-Godin and Morgan, 2011). Then, we assume
that mortality of SMAs is greater than catch estimates (Anon, 2013) for two reasons.
Indeed, estimates may not include uncertainty about (i) post-release mortality
(Cosandey-Godin and Morgan, 2011; Gilman et al., 2008), and (ii) the catches of sharks
that were illegally discarded at sea to make space for tunas in the freezers.
Estimates of initial abundance and carrying capacity were obtained from a stock
assessment conducted by ICCAT (Anon, 2013) and estimates of parameters related to
the ecology and population dynamics (i.e., natural mortality, age and growth,
reproduction, stage-specific life span, age at first maturity, age-weight) were gathered
from literature. Table 1 describes the model parameters and their source of information.
For the cases, where there is more than one source for the same parameter, we assume
the one with widest confidence interval in order to be more conservative. Note that for
the Carrying Capacity parameter, to extrapolate data that do not differentiate sex (Anon,
2013) into females only data, we consider the common male:female ratio in the
population that is equal to 1 (Garcia-Cortes and Mejuto, 2002).
We adopted software RAMAS Metapop v.6.0 (Akçakaya and Root, 2013). This
software is a computational tool for population model construction and probabilistic
simulation via Monte Carlo methods (Kalos and Whitlock, 2008).
Parameters, Uncertainty and Error
Table 1 presents the parameters governing the dynamics of the system. They were
given either as a mean value or as a triplet ( ), which represents lower, mean
and upper values. For the latter case, we consider the parameters have a truncated
normal distribution and that the error (max{ })
corresponds to a 3σ interval; thus, such parameters will be randomly selected to fall
between their limits in 99.865% of replications.
It is believed that one can make good use of a Gaussian approach in vital rates
because there is a reasonable reason for random values not to be too far away from the
average, i.e., there are biological limitations preventing very large deviations and
natural forces of equilibrium bringing vital rates back to their average values (Taleb,
2007). For probabilistic simulation, the RAMAS software converts the normal
distribution of vital rates into a corresponding lognormal distribution. This conversion
avoids bias resulting from truncation because (Burgman et al., 1993; Ferson and
Akçakaya, 1990).
We assume that the population is exposed each year to a 10% probability of
recruitment failure (i.e., - Eq. 4) that decreases stage 0 abundance to 5%
of the value expected if such event had not occurred. Carrying capacity (K) was estimated
(Table 1) based on the population biomass provided by the stock assessment as 956,777
mt (from Scenario-6 in reference (Anon, 2013)) under virgin conditions, i.e., the current
population abundance if there was no fishing. Most simulation scenarios included annual
harvest that prevented abundance from reaching the ceiling defined by K.
APPLIED ECOLOGY AND ENVIRONMENTAL RESEARCH 16(3):3691-3709.
http://www.aloki.hu ● ISSN 1589 1623 (Print) ● ISSN 1785 0037 (Online)
DOI: http://dx.doi.org/10.15666/aeer/1603_36913709
2018, ALÖKI Kft., Budapest, HungaryDuarte et al.: Quantitative ecological risk assessment of shortfin mako shark (Isurus oxyrinchus)
- 3699 -
Table 1. Definition of variables and parameters. The discrete time unit is 1 year
Variable, Parameter or
Symbol Description and assumptions Mean Max and/or Min SD
Initial condition
Assessment endpoint. Population abundance
Number of female SMA at
at time t. The sum of the number of females
time t
in all stages.
Number of female SMA in
Abundance of female SMA at stage i.
stage i at time t
Transition rate from stage 0 to
Survival of age 0 class (0.87) (Anon, 2013). 0.87
stage 1 (per year)
Annual survival rate for age 1+ (i.e., 1 year
or more) is in the range of 0.78-0.97 (Anon, Max = 0.97*(21 - 1)/21 =
= (0.924 –
Permanence rate in stage 1 2013), thus we assume mean = 0.875. = 0.875*(20-1)/20 = 0.924;
0.739)/6 =
(per year) Median (50%) age at maturity for females is 0.831 Min = 0.78*(19-1)/19 =
0.031
in the range of 19-21 years (Bishop et al., 0.739
2006), thus we assume mean = 20 years.
Annual survival rate for age 1+ is in the
range of 0.78-0.97 (Anon, 2013), thus we
= (0.051 –
Transition rate from stage 1 to assume mean = 0.785.
= 0.875/20 = 0.044 Max = 0.97/19 = 0.051 0.044)/3 =
stage 2 (per year) Median (50%) age at maturity for females is
0.002
in the range of 19-21 years (Bishop et al.,
2006), thus we assume mean = 20.
Annual survival rate for age 1+ is in the
range of 0.78-0.97 (Anon, 2013), thus we
assume mean = 0.875.
Age that female SMA reach sexual mortality = (0.849 –
Permanence rate in stage 2 = 0.875*(6 – 1)/6 = Max = 0.97*(8 – 1)/8 =
is within the range of 25-27 years (Stevens, 0.729)/3 =
(per year) 0.729 0.849;
1983), thus we assume mean = 26. 0.04
Average duration in stage 2 = 26 – 20 = 6
years.
Max duration in stage 2 = 27 – 19 = 8 years.
APPLIED ECOLOGY AND ENVIRONMENTAL RESEARCH 16(3):3691-3709.
http://www.aloki.hu ● ISSN 1589 1623 (Print) ● ISSN 1785 0037 (Online)
DOI: http://dx.doi.org/10.15666/aeer/1603_36913709
2018, ALÖKI Kft., Budapest, HungaryDuarte et al.: Quantitative ecological risk assessment of shortfin mako shark (Isurus oxyrinchus)
- 3700 -
Variable, Parameter or
Symbol Description and assumptions Mean Max and/or Min SD
Initial condition
Litter size ranges from 4 to 27.5 and mean
litter size is 12.5 (Mollet et al., 2000). = (4.583 –
Fecundity rate from stage 2 to = (12.5/3)*0.5 = Max = (27.5/3)*0.5 =
Reproductive periodicity (3 years) (Anon, 2.083)/3 =
0 (per year) 2.083 4.583
2013). 0.833
Probability of producing a female pup = 0.5.
Annual survival rate for age 1+ is in the
range of 0.78-0.97 (Anon, 2013).
Age that female SMA reaches sexual
= (0.146 -
Transition rate from stage 2 to mortality is within the range of 25-27 years
= 0.875/6 = 0.146 Min = 0.78/8 = 0.098 0.098)/3 =
stage 3 (per year) (Stevens, 1983).
0.016
Average duration in stage 2 = 26 – 20 = 6
years.
Max duration in stage 2 = 27 – 19.
Annual survival rate for age 1+ is in the = (0.970 -
Permanence rate in stage 3
range of 0.78-0.97, mean = 0.875 (Anon, 0.875 Max = 0.97 0.875)/3 =
(per year)
2013). 0.032
The SMA biomass under virgin conditions
(956,777,000 kg) (from S6, Table 19, Anon
(2013))
Sex ratio in the population (1 female: 1 =
Carrying Capacity male) (Garcia-Cortes and Mejuto, 2002) (956,777,000/205.03
Female SMA mean weight (205.031 kg) 1)*0.5 = 2,333,248
(from length-weight correlation and growth
function in Materials and Data Sources
section).
Unfished equilibrium abundance (2,333,248)
(Anon, 2013).
Population cutoff/quasi- = 2,333,248*0.2 =
Cutoff threshold is often set at 20% of
extinction threshold 466,650
unfished equilibrium abundance (Smith et
al., 1993).
Based on population models of other marine
Frequency (per year) of
fishes (Payne et al., 2009; Smedbol and 0.1
recruitment failure
Stephenson, 2004).
APPLIED ECOLOGY AND ENVIRONMENTAL RESEARCH 16(3):3691-3709.
http://www.aloki.hu ● ISSN 1589 1623 (Print) ● ISSN 1785 0037 (Online)
DOI: http://dx.doi.org/10.15666/aeer/1603_36913709
2018, ALÖKI Kft., Budapest, HungaryDuarte et al.: Quantitative ecological risk assessment of shortfin mako shark (Isurus oxyrinchus)
- 3701 -
Variable, Parameter or
Symbol Description and assumptions Mean Max and/or Min SD
Initial condition
Based on population models of other marine
Stage 0 abundance multiplier
fishes (Payne et al., 2009; Smedbol and 0.05
if recruitment failure occurs
Stephenson, 2004).
Initial abundance of female
Refers to Initial Conditions section 381,279
pups
Initial abundance of female
Refers to Initial Conditions section 1,431,337
juveniles
Initial abundance of female
Refers to Initial Conditions section 194,529
mature adults
Initial abundance of female
Refers to Initial Conditions section 151,271
post-reproductive adults
Estimated catches of SMAs in 2010 (2,496
mt) (Anon, 2013).
A harvest weight threshold for Sex selectivity by the fishery (1 female: 1
which harvest is considered male) (onboard observers data). 250 mt
low if below this threshold Proportion of minimum harvest weight in
2010 to consider that harvest is low (20%)
(from expert opinion).
APPLIED ECOLOGY AND ENVIRONMENTAL RESEARCH 16(3):3691-3709.
http://www.aloki.hu ● ISSN 1589 1623 (Print) ● ISSN 1785 0037 (Online)
DOI: http://dx.doi.org/10.15666/aeer/1603_36913709
2018, ALÖKI Kft., Budapest, HungaryDuarte et al.: Quantitative ecological risk assessment of shortfin mako shark (Isurus oxyrinchus)
- 3702 -
Initial Conditions
First, we estimate the initial population abundance from the stock assessment by
ICCAT (Anon, 2013), which simulated 13 scenarios with varying parameters and
provided the SMA biomass in 2010 as result of each simulation. We consider the effect
of uncertainty in initial biomass by using the result of the scenario with the lowest
value, i.e., 885,085 mt from Scenario-6, Table 19 (Anon, 2013). Next, we assume the
initial stage distribution is equal to the steady stage distribution in Eq. 3; this results in
the initial conditions in Table 1.
Harvest Scenarios
The real number of SMA catches is uncertain. The landing data only show known
catches, but the unknown catches (e.g., illegal discards at sea) may be even greater than
the known ones. As suggested by (Taylor et al., 2002), the effect of parameter
uncertainty on outcomes can be considered by consolidating scenarios with parameters
chosen from the range of plausibility. We interviewed an onboard observer and data
monitor that worked in a tuna longline vessel that had capacity to stock 200 tons of fish
meat. From that discussion, we deliberated a range of playsibility for real catches, i.e.,
we assumed real catches are not smaller than Catch Estimates (CE) in 2010 and not
greater than thirty-two times CE. We simulated hundreds of harvest scenarios by
varying catch paremeters whitin this range of plausibility. For the sake of illustration,
Table 2 only presents the parameters of six scenarios that we thought are the most
relevant to present in this work. We selected these scenarios for presentations purpose
for the following reasons: Scn-0 is a base scenario that reflects natural population
growth without any bycatch; Scn-CE is one extreme in the range of plausability which
reflects catch estimates without unknown bycatches; Scn-4 is another extreme that
reflects total catches (known and unknown) being thirty-two times greater than CE; and
Scn-1. Scn-2, Scn-3 are well spaced intermediate scenarios withint the range of
plausibility in which total catches are, respectively, four, seven and twenty-one times
greater than CE.
Table 2. Harvest parameters
Harvest scenario Scn-0 Scn-CE Scn-1 Scn-2 Scn-3 Scn-4
Total harvest per year 0 0.29% 1% 2% 6% 9%
0 0.10% 0.34% 0.67% 2.02% 3.03%
0 0.40% 1.39% 2.87% 8.34% 12.51%
0 0.01% 0.04% 0.08% 0.25% 0.38%
0 0.06% 0.21% 0.41% 1.24% 1.87%
Number of female
0 6,259 21,584 43,168 129,505 194,257
catches at first year
Number of times that
simulated catches are
greater than catch 0 1 4 7 21 32
estimates
(Anon, 2013)
By simulating Scn-0, we aim at evaluating the natural population dynamics, quantify
its background risk and the added risk caused by all relevant scenarios when compared
to it. By simulating Scn-CE, Scn-1, Scn-2, Scn-3 and Scn-4 we aim at propagating the
APPLIED ECOLOGY AND ENVIRONMENTAL RESEARCH 16(3):3691-3709.
http://www.aloki.hu ● ISSN 1589 1623 (Print) ● ISSN 1785 0037 (Online)
DOI: http://dx.doi.org/10.15666/aeer/1603_36913709
2018, ALÖKI Kft., Budapest, HungaryDuarte et al.: Quantitative ecological risk assessment of shortfin mako shark (Isurus oxyrinchus)
- 3703 -
effect of uncertainty about real catches. We also simulate all harvest scenarios with and
without cutoff in order to evaluate the maximum reduced risk caused by this
management threshold that is, in fact, a control measure to comply conservation
objectives.
Risk Categories
By categorizing risks, results can be better interpreted by risk managers, society, and
other interested parties. We use the risk categories proposed by (Duarte et al., 2013,
2014; Duarte and Droguett, 2015). It is important to note that the following categories
are more conservative than the International Union for Conservation of Nature (IUCN)
categories (IUCN, 2001). The latter are used to classify species affected by a whole
range of environmental changes and human disturbance at regional (IUCN, 2003) or
global-levels, whereas the former is proposed to classify risks caused by a single
stressor (harvest) to a single population, which is our case.
CRITICALLY ENDANGERED (CR): more than 50% additional probability
of quasi-extinction within 3 generations (i.e., median time to quasi-extinction is
shorter than 3 generations).
ENDANGERED (EN): more than 20% additional probability of quasi-
extinction within 5 generations.
VULNERABLE (VU): more than 10% additional probability of quasi-
extinction within 5 generations.
NEGLIGIBLE (NE): less than 10% additional probability of quasi-extinction
within 5 generations.
We assume that female SMAs have a generation time of 20 years (Froese and Pauly,
2011) and harvest scenarios that cause NE risks are considered sustainable.
Results and Discussion
Fig. 2 illustrates how female SMA average abundance in the South Atlantic varies
over time (100 years) for several harvest scenarios (Scn-0, Scn-CE, Scn-1, Scn-2, Scn-3
and Scn-4, respectively, 0%, 0.29%, 1%, 2%, 6% and 9% of the population removed
every year). The Scn-0 curve represents the population dynamics if no fishing occurs.
Scn-0 curve is superimposed on Scn-CE, which shows the abundance trajectory if real
catches were as described by landing data. The abundance reaches a dynamic
equilibrium at the carrying capacity, which is around 2,33E+6.
Note that population growth rate when unfished (Scn-0) is almost nil and the same
happens to Scn-CE. Obviously, the population abundance for Scn-CE is overestimated
because landing data do not consider unkown bycatches discarded at sea. Catch
estimates from landing data is so optimistic that, for practical purposes, the population
dynamics under these catch estimates (Scn-CE) is the same as under no fishing (Scn-0).
Nonetheless, Scn-CE is a positive scenario that is presented to highlight model
accuracy.
Because of the great uncertainty about real catches, we also consider Scn-3 or Scn-4
(6% or 9% annual harvest, respectively), which show overfishing situations in which
the population rapidly declines to, respectively, 1,260,764 (258,496 mt) and 519,322
(106,477 mt) females. Scn-3 causes an additional 10.6% risk of quasi-extinction within
5 generations; then, it is classified as VU, whereas Scn-4 causes 56.2% probability of
APPLIED ECOLOGY AND ENVIRONMENTAL RESEARCH 16(3):3691-3709.
http://www.aloki.hu ● ISSN 1589 1623 (Print) ● ISSN 1785 0037 (Online)
DOI: http://dx.doi.org/10.15666/aeer/1603_36913709
2018, ALÖKI Kft., Budapest, HungaryDuarte et al.: Quantitative ecological risk assessment of shortfin mako shark (Isurus oxyrinchus)
- 3704 -
quasi-extinction within 3 generations; thus, it is categorized as CR. These two scenarios
simulate more conservative situations, but, given the great importance of SMA to the
ecosystem, it is worth dealing with uncertainty in this way. In the case of more accurate
SMA catch data being available in the future, interpretation of results may change.
Figure 2. Female SMA average abundance for relevant scenarios.
Table 3 summarizes the main results for each harvest scenario. Values with a + or –
symbol mean that they are being compared to the benchmark Scn-0, except for the
maximum effect of cutoff measure, which is compared against the same scenario
without cutoff. The risk of harvest scenarios is indicated both as additional risk of quasi-
extinction compared to Scn-0 and as reduced expected minimum abundance also related
to Scn-0. The median time to quasi-extinction is calculated from the CDF for the time
that the population size will fall below the quasi-extinction threshold. Only Scn-4 had
the median of its distribution shorter than 100 years, i.e., 50% probability of quasi-
extinction within 56 years. All other scenarios had less than 50% probability of quasi-
extinction within 100 years.
Table 2. Risk results
Harvest scenario Scn-0 Scn-CE Scn-1 Scn-2 Scn-3 Scn-4
Risk of quasi-
0 0 0 0 +0.106 +0.878
extinction
Risk category NE NE NE NE VU CR
Median time (years)
>100 >100 >100 >100 >100 56
to quasi-extinction
Expected minimum
332,785 327,778 316,081 297,773 170,477 80,731
biomass (mt)
-0.057 risk -0.721 risk
Maximum effect of Not Not Not Not of 83% of 87%
cutoff measure applicable significant significant significant population population
decline decline
Expected yield
Not
(total harvest weight 73,660 241,554 469,821 1,000,000 886,045
applicable
(mt))
Risk of low harvest Not
0 0 0 0.132 0.887
(≤ 250 mt) applicable
APPLIED ECOLOGY AND ENVIRONMENTAL RESEARCH 16(3):3691-3709.
http://www.aloki.hu ● ISSN 1589 1623 (Print) ● ISSN 1785 0037 (Online)
DOI: http://dx.doi.org/10.15666/aeer/1603_36913709
2018, ALÖKI Kft., Budapest, HungaryDuarte et al.: Quantitative ecological risk assessment of shortfin mako shark (Isurus oxyrinchus)
- 3705 -
The Effect of the Cutoff Threshold Measure
We quantify the maximum effect caused by the cutoff management threshold. The
maximum effect of cutoff is measured as the maximum reduced risk for a scenario with
and without cutoff. The reported number is the Kolmogorov-Smirnov test statistic D,
which is the maximum vertical difference between risk curves, based on a two sample
Kolmogorov-Smirnov test (Akçakaya and Root, 2013). The approximate location (point
X at which maximum reduced risk occurs, i.e., percentage of decline) is also given.
Thus, we simulate all harvest scenarios with and without cutoff, compare their risk of
population decline and measure the maximum reduced risk and the point at which it
occurs (Table 3). For Scn-4, the cutoff measure reduces 72% the risk of 87% population
decline, whereas for Scn-3, it reduces 5.7% the risk of 83% population decline. For all
other scenarios, risk reduction is insignificant.
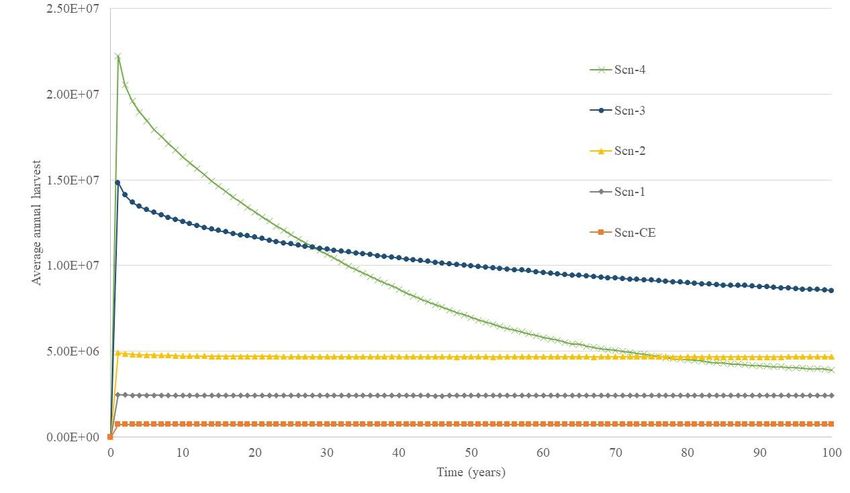
Harvest Results
The yield of SMA is not only important as a secondary product, but also as an
indicator for yield of tuna, since SMA are bycatched by various types of tuna and tuna-
like fishing gear. Thus, changes in SMA harvest means proportional changes in tuna
harvest. The number of SMA catches as a proportion of tuna catches depends on several
specific factors such as the vessel fishing gear and fishing grounds. Thus, the vessel
interested in how the presented SMA harvest results impact their yield of tuna should
make their own estimates.
Fig. 3 shows, for each harvest scenario, the expected total weight of harvest as a
function of time. The harvest is calculated based on the average weight of each stage
(see Materials and Data Sources section). Scn-0 is not applicable here since it is not a
yielding scenario. Total harvest for 100 years of simulation and risk of low harvest are
presented in Table 3.
Figure 3. Average weight of female SMA harvest as a function of time for each harvest scenario
(Scn-CE, Scn-1, Scn-2, Scn-3 and Scn-4)
APPLIED ECOLOGY AND ENVIRONMENTAL RESEARCH 16(3):3691-3709.
http://www.aloki.hu ● ISSN 1589 1623 (Print) ● ISSN 1785 0037 (Online)
DOI: http://dx.doi.org/10.15666/aeer/1603_36913709
2018, ALÖKI Kft., Budapest, HungaryDuarte et al.: Quantitative ecological risk assessment of shortfin mako shark (Isurus oxyrinchus)
- 3706 -
It is worth focusing on Scn-3 or Scn-4 to deal with uncertainty because of inaccurate
SMA catch data. These scenarios are not good for both conservation and production
because: (i) they are not sustainable, i.e., Scn-3 is categorized as VE and Scn-4 as CR;
(ii) although Scn-3 maximizes yield, it causes a considerable risk of low harvest (13%);
and (iii) Scn-4 does not provide maximum yield and risk of low harvest is significantly
high (89%).
Conclusions
This paper dealt with a very important bycatch species of worldwide tuna fisheries.
Its capture is of major conservation concern, thus this subject is of great interest and
relevance for pelagic fisheries and their management. Yet, the methodology to approach
the problem is innovative because it is capable of: (i) quantifying the added risk of
extinction caused by harvest scenarios and the reduced risk caused by cutoff measures;
(ii) dealing with uncertainty; (iii) including low frequency events; and (iv) quantifying
risk of low harvest.
The proposed model can be applied to any SMA population by changing initial
conditions and harvest parameters. We conducted QERA for the SMA South Atlantic
population in order to exemplify the application of the model and consistent results
were obtained.
The model is most useful for risk managers as an aid for rational decisions about
harvest regimes under uncertainty. The flexibility of the model made it practicable to
simulate and evaluate hundreds of scenarios and analyze their results. The risk results of
relevant scenarios were transformed into risk categories for easier communication to
stakeholders. The model also allowed for update of parameters as new data become
available. Companies interested in sustainable production can thus register data of SMA
bycatch and use them as an input for the model.
For the application example, great uncertainty on input data also caused great
uncertainty in results. Without accurate SMA catch data, which is caused for example
by unknown illegal discards, uncertainty about the real scenario is great. Consequently,
risk results for SMA quasi-extinction varies from categories NE to CR.In this sense, we
recommend future studies that can reduce data uncertanty, e.g.: improving the current
methods for data monitoring onboard; new data gathering methods other than the
traditional onboard observer (e.g., fin trade data); and new statistical approaches for
catch estimates (e.g., bayesian statistics). In this way, our proposed model can be used
to simulate less uncertain scenarios in order to aid decision makers. For now, the
application example described in this article only works for the sake of illustration.
Acknowledgements. Thanks to the Coordination of Improvement of Higher Level Personnel (CAPES) -
Ministry of Education of Brazil, for the Sandwich Doctorate grant number 99999.012371/2013-00; and to
Alan Salazar, an observer onboard of a tuna longline vessel.
REFERENCES
[1] Akçakaya, H. R., Burgman, M. A., Ginzburg, L. R. (1997): Applied Population Ecology:
Principles and Computer Exercises Using RAMAS EcoLab 2.0. – Applied
Biomathmatics, Setautek, New York.
APPLIED ECOLOGY AND ENVIRONMENTAL RESEARCH 16(3):3691-3709.
http://www.aloki.hu ● ISSN 1589 1623 (Print) ● ISSN 1785 0037 (Online)
DOI: http://dx.doi.org/10.15666/aeer/1603_36913709
2018, ALÖKI Kft., Budapest, HungaryDuarte et al.: Quantitative ecological risk assessment of shortfin mako shark (Isurus oxyrinchus)
- 3707 -
[2] Akçakaya, H. R., Burgman, M. A., Ginzburg, L. R. (1999): Applied Population Ecology.
(2nd ed.) – Sinauer Associates, Sunderland, Massachussets.
[3] Akçakaya, H. R., Root, W. T. (2013): RAMAS GIS: Linking Spatial Data with
Population Viability Analysis (Version 6). – Applied Biomathematics, Setauket, New
York.
[4] Anon (2009): Report of the 2008 Shark Stock Assessment Meeting (Madrid, Spain,
September 1 to 5, 2008). – Collect. Vol. Sci. Pap. ICCAT 64(5): 1343-1491.
[5] Anon (2013): Report of the 2012 Shortfin Mako Stock Assessment and Ecological Risk
Assessment Meeting (Olhao, Portugal - June 11-18, 2012). – Collect. Vol. Sci. Pap.
ICCAT 69(4): 1427-1570.
[6] Bishop, S., Francis, M., Duffy, C., Montgomery, J. (2006): Age, growth, maturity,
logevity and natural mortality of the shorfin mako (Isurus oxyrinchus) in New Zealand
waters. – Mar. Freshwater Res. 57: 143-154.
[7] Burgman, M. A., Ferson, S., Akçakaya, H. R. (1993): Risk Assessment in Conservation
Biology. – Chapman and Hall, London.
[8] Burgman, M. A., Franklin, J., Hayes, K. R., Hosack, G. R., Peters, G.W., Sisson, S. A.
(2012): Modeling Extreme Risks in Ecology. – Risk Analysis 32(11): 1956-1966.
[9] Carvalho, F. C., Murie, D. J., Hazin, F. H. V., Hazin, H. G., Leite-Mourato, B.,
Travassos, P., Burgess, G. H. (2011): Catch rates and size composition of blue sharks
(Prionace glauca) caught by the Brazilian pelagic longline fleet in the southwestern
Atlantic Ocean. – Aquat. Living Resour. 23: 373-385.
[10] Clarke, P. (2008): Management of Tuna Fisheries in the Western and Central Pacific. –
IUCN Environmental Policy and Law Paper 72(11).
[11] Cosandey-Godin, A., Morgan, A. (2011): Fisheries Bycatch of Sharks: Options for
Mitigation. – Ocean Science Division, Pew Environment Group, Washington, DC.
[12] Duarte, H. O., Droguett, E. L. (2015): Quantitative Ecological Risk Assessment of
accidental oil spills on ship routes nearby a marine national park in Brazil. – Human and
Ecological Risk Assessment: An International Journal, Taylor & Francis 22(2): 350-368.
[13] Duarte, H. O., Droguett, E. L., Araújo, M., Teixeira, S. F. (2013): Quantitative Ecological
Risk Assessment of Industrial Accidents: The Case of Oil Ship Transportation in the
Coastal Tropical Area of Northeastern Brazil. – Hum. Ecol. Risk Assess., Taylor &
Francis 19(6): 1457-1476.
[14] Duarte, H. O., Droguett, E. L., Moura, M. das C., de Souza Gomes, E. C., Barbosa, C.,
Barbosa, V., Araújo, M. (2014): An Ecological Model for Quantitative Risk Assessment
for Schistosomiasis: The Case of a Patchy Environment in the Coastal Tropical Area of
Northeastern Brazil. – Risk Analysis 34(5): 831-846.
[15] FAO (1999). International Plan of Action for the Conservation and Management of
Sharks, Food and Agricultre Organization of the United Nations, Rome.
[16] FAO (2016). The state of world fisheries and aquaculture. The State of World Fisheries
and Aquaculture 2016, p. 160.
[17] Ferson, S., Akçakaya, H. R. (1990): RAMAS/age User Manual: Modeling Fluctuations in
Age-Structured Populations. – Applied Biomathematics, New York.
[18] Forbes, V. E., Calow, P., Grimm, V., Hayashi, T., Jager, T., Palmqvist, A., Pastorok, R.
(2010): Integrating population modeling into ecological risk assessment . – Integr.
Environ. Assess. Manage. 6(1): 191-193.
[19] Froese, R., Pauly, D. (2011): Fishbase. - World Wide Web eletronic publication.
www.fishbase.org, version 08/2011.
[20] Fu, C., Wood, C. C., Schweigert, J. (2004): Pacific Herring (Clupea pallasi) in Canada:
Generic Framework for Evaluating Conservation Limits and Harvest Strategies . – In:
Akçakaya, H. R., Burgman, M. A., Kindvall, O., Wood, C. C., Hatfield, J. S., McCarthy,
APPLIED ECOLOGY AND ENVIRONMENTAL RESEARCH 16(3):3691-3709.
http://www.aloki.hu ● ISSN 1589 1623 (Print) ● ISSN 1785 0037 (Online)
DOI: http://dx.doi.org/10.15666/aeer/1603_36913709
2018, ALÖKI Kft., Budapest, HungaryDuarte et al.: Quantitative ecological risk assessment of shortfin mako shark (Isurus oxyrinchus)
- 3708 -
M. A. (eds.) Species Conservation and Management: Case Studies, Oxford University
Press, New York, USA.
[21] Garcia-Cortes, B., Mejuto, J. (2002): Size-weight relationship of the swordfish (Xiphias
gladius) and several pelagic shark species caught in the Spanish surface longlinse fishery
in the Atantic, Indian and Pacific Oceans. – ICCAT (Int. Comm. Conserv. Atl. Tunas)
Coll. Vol. Sci. Pap. 54(4): 1132-1149.
[22] Gilman, E., Clarke, S., Brothers, N., Alfaroshigueto, J., Mandelman, J., Mangel, J.,
Petersen, S. (2008): Shark interactions in pelagic longline fisheries . – Marine Policy 32:
1-18.
[23] Gilman, E. L., Lundin, C. G. (2008): Minimizing Bycatch of Sensitive Species Groups in
Marine Capture Fisheries: Lessons from Commercial Tuna Fisheries . – In: Grafton, Q.,
Hillborn, R., Squires, D., Tait, M., Williams, M. (eds.) Handbook of Marine Fisheries
Conservation and Management, Oxford Univesity Press, Oxford.
[24] Hamilton, A., Lewis, A., McCoy, M. A., Havice, E., Campling, L. (2011): Market and
Industry Dynamics in the Global Tuna Supply Chain. – FFA, European Union.
[25] Hart, D. R., Cadrin, S. X. (2004): Yellowtail Flounder (Limanda ferruginea) off the
Northeastern United States. – In: Akçakaya, H. R., Burgman, M. A., Kindvall, O., Wood,
C. C., Hatfield, J. S., McCarthy, M. A. (eds.) Species Conservation and Management:
Case Studies. Oxford University Press, New York, USA.
[26] IUCN (2001). IUCN Red List Categories: Version 3.1. IUCN Species Survival
Comission, Gland, Switzerland and Cambridge, UK.
[27] IUCN (2003). Guidelines for Application of IUCN Red List Criteria at Regional Levels:
Version 3.0., IUCN Species Survival Comission, Gland, Switzerland and Cambridge,
UK.
[28] Kalos, M. H., Whitlock, P. A. (2008): Monte Carlo Methods. – Wiley-VCH, Weinheim.
[29] Kohler, N. E., Casey, J. G. (1995): Lenght-weight associations for 13 species of sharks
from the western North Atlantic. – Fish. Bull. 93: 412-418.
[30] Lefkovitch, L. P. (1965): The study of population growth in organisms grouped by stages .
– Biometrics 21: 1-18.
[31] Levesque, J. C. (2007): A Comprehensive Review of the Biology and Preliminary
Investigation of Interactions with the U.S. Pelagic Longline Fishery for the Shortfin
(Isurus Oxyrinchus) and Longfin (Isurus Paucus) Mako Sharks. – Oceanographic Center,
Nova Southeastern University.
[32] Mollet, H. F., Cliff, G., Pratt, H. L. J., Stevens, J. D. (2000): Reproductive biology of the
female shortfin mako, Isurus oxyrinchus Rafinesque, 1810, with comments on the
embryonic development of lamnoids. – Fish. Bull. 98: 299-318.
[33] Myers, R. A., Baum, J. K. (2007): Cascading effects of the loss of apex predatory sharks
from a coastal ocean. – Science 315: 1850-1946.
[34] Natanson, L. J. (2002): Preliminary investigations into the age and growth of the shortfin
mako shark, Isurus oxyinchus, white shark, Carcharodon carcharias, and thresher shark,
Alopias vulpinus, in the western North Atlantic Ocean. – Coll. Vol. Sci. Pap. 54(4):
1280-1293.
[35] Natanson, L. J., Kohler, N. E., Ardizzone, D., Cailliet, G. M., Wintner, S. P., Mollet, H.
F. (2006): Validated age and growth estimates for the shortfin mako, Isurus oxyrinchus,
in the North Atlantic Ocean. – Environmental Biology of Fishes 77(3-4): 367-383.
[36] Pauwels, S. J. (2002): Fish Population Modeling: Data Needs and Case Study. - In:
Pastorok, R.A., Bartell, S.M., Ferson, S., Ginzburg, L.R. (eds.) Ecological Modeling in
Risk Assessment: Chemical Effects on Populations, Ecosystems and Landscapes, CRC
Press LLC, Boca Raton, FL.
APPLIED ECOLOGY AND ENVIRONMENTAL RESEARCH 16(3):3691-3709.
http://www.aloki.hu ● ISSN 1589 1623 (Print) ● ISSN 1785 0037 (Online)
DOI: http://dx.doi.org/10.15666/aeer/1603_36913709
2018, ALÖKI Kft., Budapest, HungaryDuarte et al.: Quantitative ecological risk assessment of shortfin mako shark (Isurus oxyrinchus)
- 3709 -
[37] Payne, M. R., Hatfield, E. M. C., Dickey-Collas, M., Falkenhaug, T., Gallego, A.,
Groger, J., Licandro, P. (2009): Recruitment in a changing environment: the 2000s North
Sea herring recruitment failure. – ICES J. Mar. Sci. 66: 272-277.
[38] Ryman, N., Utter, F., Laikre, L. (1995): Protection of intraspecific biodiversity of
exploited fishes. – Rev.: Methods Technol. Fish Biol. Fish. 5: 417-446.
[39] Smedbol, R. K., Stephenson, R. L. (2004): Atlantic Herring (Clupea harengus) in the
Northwest Atlantic Ocean: dynamics of nested population components under several
harvest regimes. – In: Akçakaya, H. R., Burgman, M. A., Kindvall, O., Wood, C. C.,
Hatfield, J. S., McCarthy, M. A. (eds.) Species Conservation and Management: Case
Studies, Oxford University Press, New York, USA.
[40] Smith, S. J., Hunt, J. J., Rivard, D. (1993): Risk Evaluation and Biological Reference
Points for Fisheries Management. – Canadian Special Publication of Fisheries and
Aquatic Sciences No. 120, Fisheries and Oceans Canada, Ottawa.
[41] Stevens, J. D. (1983): Observations on the reproduction in the shorftin mako, Isurus
oxyrinchus. – Copeia 1: 126-130.
[42] Taleb, N. N. (2007): The Black Swan: The Impact of the Highly Improbable. – Random
House & Penguin, Paris.
[43] Taylor, B. L., Wade, P. R., Ramakrishnan, U., Gilpin, M., Akçakaya, H. (2002):
Incorporating uncertainty in population viability analyses for the purpose of classifying
species by risk. – In: Beissinger, S. R., McCullough, D. R. (eds.) Population Viability
Analysis, University of Chicago Press, Chicago.
[44] Weigmann, S. (2016): Annotated checklist of the living sharks, batoids and chimaeras
(Chondrichthyes) of the world, with a focus on biogeographical diversity. – Journal of
Fish Biology 88(3): 837-1037.
APPLIED ECOLOGY AND ENVIRONMENTAL RESEARCH 16(3):3691-3709.
http://www.aloki.hu ● ISSN 1589 1623 (Print) ● ISSN 1785 0037 (Online)
DOI: http://dx.doi.org/10.15666/aeer/1603_36913709
2018, ALÖKI Kft., Budapest, HungaryYou can also read