Teacher Lesson Plans Common Core State Standards Daily Lessons for Classroom Instruction
←
→
Page content transcription
If your browser does not render page correctly, please read the page content below
Fourth
                                                                            Edition

                                      Common Core State Standards

                        Teacher Lesson Plans
                                                 Volume 1
                                  Daily Lessons for Classroom Instruction

MTB4_G3_TG_Vol1_FM_FINAL.indd 1                                                       7/29/13 10:38 PM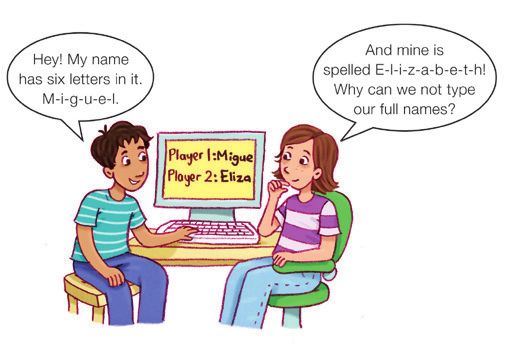
Volume 1: Table of Contents
                                  Unit 1:         Sampling and Classifying

                                  Lesson 1:       First Names ........................................................................................ 1
                                  Lesson 2: Number Line Target .......................................................................... 12
                                  Lesson 3: Kind of Bean ..................................................................................... 18
                                  Lesson 4: Who Is Right? ................................................................................... 28
                                  Lesson 5: Using Picture Graphs ....................................................................... 33

                                  Unit 2: Strategies

                                  Lesson 1:       Addition Strategies ........................................................................... 39
                                  Lesson 2: Strategies for Making Tens............................................................... 47
                                  Lesson 3: Spinning Sums.................................................................................. 55
                                  Lesson 4: Magic Squares.................................................................................. 66
                                  Lesson 5: Subtraction Facts Strategies............................................................ 77
                                  Lesson 6: Spinning Differences ........................................................................ 84
                                  Lesson 7:       Workshop: Reasoning from Known Facts ........................................ 90
                                  Lesson 8: Assessing the Subtraction Facts...................................................... 98

                                  Unit 3: Exploring Multiplication

                                  Lesson 1:       T-Shirt Factory Problems................................................................ 105
                                  Lesson 2: In Twos, Threes, and More ............................................................. 112
                                  Lesson 3: Multiplication Stories...................................................................... 121
                                  Lesson 4: Making Teams................................................................................. 128
                                  Lesson 5: Multiples on the Calendar .............................................................. 135
                                  Lesson 6: Workshop: Multiplication and Division Stories .............................. 145

                                                                                                                                         TLP • Grade 3        v

MTB4_G3_TG_Vol1_FM_FINAL.indd 5                                                                                                                            7/29/13 10:38 PM
Unit 4: Place Value Concepts

                       Lesson 1:      Tens and Ones ................................................................................ 151
                       Lesson 2: Hundreds, Tens, and Ones ............................................................. 158
                       Lesson 3: Thousands, Hundreds, Tens, and Ones.......................................... 168
                       Lesson 4: Comparing and Writing Numbers ................................................... 182
                       Lesson 5: Base-Ten Hoppers .......................................................................... 189
                       Lesson 6: Workshop: Place Value................................................................... 196
                       Lesson 7:      Number Sense with Dollars and Cents........................................... 204

                       Unit 5: Area of Different Shapes

                       Lesson 1:      Time to the Nearest Five Minutes................................................... 210
                       Lesson 2: Measuring Area .............................................................................. 227
                       Lesson 3: Boo the Blob................................................................................... 233
                       Lesson 4: Which Picks Up More? ................................................................... 240
                       Lesson 5: The Haunted House ........................................................................ 256
                       Lesson 6: Joe the Goldfish ............................................................................. 262
                       Lesson 7:      Using Number Sense at the Book Sale .......................................... 271

       vi           TLP • Grade 3

MTB4_G3_TG_Vol1_FM_FINAL.indd 6                                                                                                            7/29/13 10:38 PM
Unit 6: Adding Larger Numbers
Lesson 1: 500 Hats.......................................................................................... 276
Lesson 2: The Coat of Many Bits .................................................................... 285
Lesson 3: Close Enough! ................................................................................ 294
Lesson 4: Addition Review.............................................................................. 305
Lesson 5: Addition with Larger Numbers ....................................................... 320
Lesson 6: Workshop: Addition ........................................................................ 338
Unit 7: Subtracting Larger Numbers
Lesson 1: Time Again...................................................................................... 347
Lesson 2: Field Trip ......................................................................................... 354
Lesson 3: Subtracting with Base-Ten Pieces ................................................. 360
Lesson 4: Paper-and-Pencil Subtraction ........................................................ 367
Lesson 5: Workshop: Subtraction................................................................... 378
Lesson 6: Leonardo the Traveler..................................................................... 388
Lesson 7: Addition and Subtraction: Practice and Estimation ....................... 401
Lesson 8: Class Party ..................................................................................... 408
TLP • Grade 3 vii
MTB4_G3_TG_Vol1_FM_FINAL.indd 7 7/29/13 10:38 PMVolume 2: Table of Contents
Unit 8: Multiplication Patterns
Lesson 1: Lizardland Problems....................................................................... 420
Lesson 2: Constant Hoppers .......................................................................... 429
Lesson 3: Handy Facts ................................................................................... 436
Lesson 4: Multiplication and Rectangles........................................................ 447
Lesson 5: Completing the Table ..................................................................... 461
Lesson 6: Division in Lizardland ..................................................................... 476
Lesson 7: Stencilrama..................................................................................... 484
Lesson 8: Multiplication Number Sentences .................................................. 502
Lesson 9: Multiples of Tens and Hundreds..................................................... 521
Lesson 10: Workshop: Strategies for Multiplication Facts ............................... 527
Lesson 11: Midyear Test Review....................................................................... 537
Unit 9: Parts and Wholes
Lesson 1: Kid Fractions .................................................................................. 543
Lesson 2: Circle Pieces: Red, Pink, Yellow, Blue............................................ 551
Lesson 3: Circle Pieces: Red, Pink, Orange, Aqua ......................................... 565
Lesson 4: Folding Fractions............................................................................ 576
Lesson 5: Circles, Fraction Strips, and Number Lines ................................... 589
Lesson 6: Comparing Fractions ...................................................................... 597
Lesson 7: Workshop: Fractions ...................................................................... 609
viii TLP • Grade 3
MTB4_G3_TG_Vol1_FM_FINAL.indd 8 7/29/13 10:38 PMUnit 10: Exploring Multiplication and Division
Lesson 1: Lemonade Stand ............................................................................ 625
Lesson 2: Operations on a Number Line ........................................................ 635
Lesson 3: Birthday Party................................................................................. 641
Lesson 4: Money Jar ....................................................................................... 647
Lesson 5: Mr. Green’s Giant Gumball Jamboree............................................. 654
Lesson 6: Walking Around Shapes ................................................................. 665
Lesson 7: Katie’s Job ...................................................................................... 680
Unit 11: Analyzing Shapes
Lesson 1: Just Passing Time .......................................................................... 692
Lesson 2: Tangrams ........................................................................................ 697
Lesson 3: Tangram Puzzles ............................................................................ 706
Lesson 4: Building with Triangles ................................................................... 714
Lesson 5: Sorting Shapes ............................................................................... 725
Lesson 6: 3-D Shapes ..................................................................................... 736
Lesson 7: Skeletons of 3-D Shapes ................................................................ 744
Lesson 8: 3-D to 2-D ....................................................................................... 752
Lesson 9: Sorting 3-D Shapes ........................................................................ 767
TLP • Grade 3 ix
MTB4_G3_TG_Vol1_FM_FINAL.indd 9 7/29/13 10:38 PMUnit 12: Measurement and Patterns
Lesson 1: Using Coordinates .......................................................................... 777
Lesson 2: Using Maps..................................................................................... 785
Lesson 3: Making Predictions from Best-Fit Lines ......................................... 794
Lesson 4: Measuring Mass ............................................................................. 803
Lesson 5: Mass vs. Number............................................................................ 816
Lesson 6: More Patterns in Data .................................................................... 827
Unit 13: Multiplication, Division, and Volume
Lesson 1: Break-Apart Products with Larger Numbers .................................. 837
Lesson 2: More Multiplication Stories ............................................................ 848
Lesson 3: Multiplication Models and Strategies............................................. 860
Lesson 4: Solving Problems with Multiplication and Division ........................ 871
Lesson 5: Earning Money................................................................................ 880
Lesson 6: Elixir of Youth ................................................................................. 891
Lesson 7: Measuring Volume of Containers ................................................... 903
Lesson 8: Fill It Up .......................................................................................... 914
Lesson 9: Measuring Volume of Solid Objects ............................................... 926
Lesson 10: End-of-Year Test ............................................................................. 935
x TLP • Grade 3
MTB4_G3_TG_Vol1_FM_FINAL.indd 10 7/29/13 10:38 PMUNIT 1
Lesson
First Names
1 Estimated Class Sessions: 3
3.MD.B Represent and interpret data.
(3.MD.B.3)
MP1. Make sense of problems and
persevere in solving them.
This teacher-guided lab is an exploration of the lengths of students’ MP2. Reason quantitatively.
first names. The class collects and organizes data in a table and MP4. Model with mathematics.
MP5. Use appropriate tools strategically.
graph so students can make predictions and generalizations about
a population; specifically, the length of first names.
Content in this Lesson
• Identifying variables of an investigation.
• Collecting, organizing, and graphing data.
• Reading a table or bar graph to find information about a data set [E3].
• Making predictions and generalizations about a population from a sample using
data tables and graphs [E4].
Assessment in this Lesson
Assessment Expectation Assessed
Lisa’s Class Graph with E3. Read a table or scaled graph to find information about a data set.
Feedback Box E4. Make predictions and generalizations about a population from a
Teacher Guide – digital sample using data tables and graphs.
Vocabulary in this Lesson
• data table • prediction
• frequency • variable
• horizontal axis • vertical axis
• most common number
First Names TLP • Grade 3 • Unit 1 • Lesson 1 1
MTB4_G3_TG_U01_FINAL.indd 1 7/29/13 2:00 PMUNIT 1
Materials List
Materials Daily Practice
Lesson Homework Assessment
for Students and Problems
Student • First Names
Guide Pages 2–6
• First Names Data • Family Names
Student Books
Table and Graph Data Table
Page 3 Page 5
Student
• Family Names Graph
Activity
Page 7
Book
• Careless Professor
Peabody
Page 9
• DPP Items A–F • Lisa’s Class Graph
Teacher Resources
• Clock 1 each per student
Teacher
Guide –
digital
Supplies for Students
• self-adhesive note
Materials for the Teacher
• Display of First Names Data Table and Graph page (Student Activity Book) Page 3
• Display of Clock Master (Teacher Guide)
• chart paper
• Unit 1 Assessment Record
Materials Preparation
Create a Class Data Table. Create a table on chart paper to collect student data. See Figures 2 and 3.
Create a Class Graph. Prepare to make a large class graph on chart paper. See Figure 4.
Professor Peabody’s Broken Clock. Use the Clock Master to make Professor Peabody’s broken
clock for DPP item E. Cut out and attach only the hour hand with a brad.
2 TLP • Grade 3 • Unit 1 • Lesson 1 First Names
MTB4_G3_TG_U01_FINAL.indd 2 7/29/13 2:00 PMTeacher Planning Notes
First Names TLP • Grade 3 • Unit 1 • Lesson 1 3
MTB4_G3_TG_U01_FINAL.indd 3 7/29/13 2:00 PMLesson Developing the Lesson
1 First Names
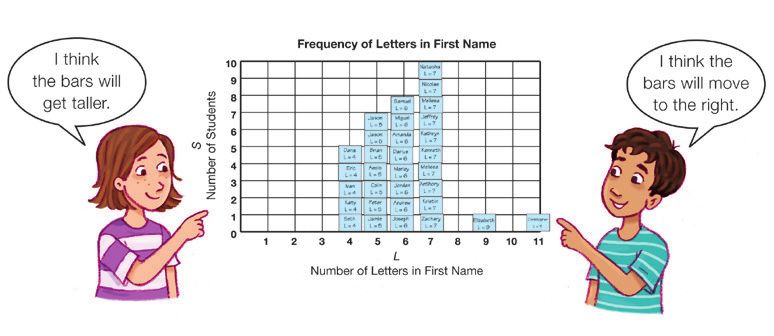
Elizabeth and Miguel like to play computer games. One day, they were playing
Math-o-Rama. They tried to type their first names, but the game let them type only
five letters.
Introduce the First Names Investigation. The First Names
pages in the Student Guide provide the setting for this investigation:
finding the most common numbers of letters in students’ names in
order to write a letter to a computer game company.
Letters in First Name
What number of letters should players be
TIMS Tip !
able to type for their names? Elizabeth
and Miguel asked their classmates to help
This investigation can also be introduced by reading the book
them find out. Students wrote their first
names on small slips of paper. Then they Tikki Tikki Tembo by Arlene Mosel, the story of a Chinese boy
who has a very long name that causes several misadventures.
wrote the number of letters in their names.
They put the information in a data table.
Here is the data that Elizabeth and
Miguel recorded.
To start the discussion, ask:
X What data would help us decide how many letters the
game company should allow children to type when they
2 SG • Grade 3 • Unit 1 • Lesson 1 First Names
enter their first names? (the number of letters in students’
first names)
Student Guide — Page 2 The answers to the following discussion questions are based on the
table on the First Names page in the Student Guide.
X Number of Letters in First Name will be one of the variables
of the investigation. Who has the largest number of letters
in their name in the class? (Christopher)
Elizabeth and Miguel made a graph of their data.
Frequency of Letters in First Name X Who has the smallest number of letters, the shortest name?
(The shortest name in the class has 4 letters. Five students have
4 letters in their name: Dana, Seth, Katy, Ivan, and Eric.)
Number of Students
X What number of letters do you think is most common?
S
Dana
#L = 4
(seven) Why? (There are more students in the class (10) that have
Eric
#L = 4
Ivan
#L = 4
Katy
#L = 4
Seth Elizabeth
7 letters in their names than any other number of letters.)
#L = 4 #L = 9
L
X What might influence the length of a name? (Possible
Number of Letters in First Name
response: The length of a name might be different if you are using
“Can you see a pattern?” asked Miguel.
“Yes,” said Elizabeth. “No one has a first name with one, two, or three letters.”
nicknames instead of names given at birth.)
“That is right!” said Miguel. “And only two kids have more than seven letters in their
Your students will probably give a variety of responses to the last
first name.”
You will carry out an investigation called First Names. You will collect data with
your class and graph it. First, you will find the number of letters in your classmates’
first names. Then, you will look for patterns in the data. Later, you will use the question. It should become obvious that a definition of “length of
information to write a letter to a game company about the number of letters that a
computer game should allow for a player’s name. name” must be agreed upon. While a study of first and last names is
feasible, it is more straightforward to focus on the number of letters in
What first names will your class use? Some children in your class might use
shortened names, like “Bob” for “Robert.” Others might have two-part names, like
“Mary Pat.” Some children might even use nicknames, like “Digger.”
Discuss and decide with your class what you mean by “first name.” a first name.
Define the Variables. Have the class discuss and choose a
definition of the variable Number of Letters in First Name. It is
First Names SG • Grade 3 • Unit 1 • Lesson 1 3
important that the definition be explicit enough to handle all the
names in the class, including two-part first names such as Mary Pat.
Student Guide — Page 3 Students should realize that agreeing on a definition is like agreeing
on rules for a game. The rules themselves are less important than
everyone agreeing on the same rules. The class may decide to allow
nicknames or they may agree to use only the names given at birth as
data. Either rule is valid as long as it is used consistently.
4 TLP • Grade 3 • Unit 1 • Lesson 1
MTB4_G3_TG_U01_FINAL.indd 4 7/29/13 2:00 PMYou must also establish a notation for the variable Number of Letters
in First Name. Here again, agreeing is more important than what is
agreed upon. We use L to stand for Number of Letters in First Name.
Content Note
The class can either follow our notation or make up their own. A variable in an experiment is an attribute or quantity
that changes or varies. Every experiment has at
Collect the Data. The next step is to gather the data. To do this, least two main variables. In this lab, the two main
students write their first names on self-adhesive notes, count the variables are the Number of Letters in First Name
letters, and show L by writing “L 5 _____” below their names as and the Number of Students. A second definition for
shown in Figure 1. the term is a symbol that can stand for a variable.
In the Lesson Guide, we have chosen to use L to
JASON stand for Number of Letters in First Name and S for
SETH Number of Students. In this lesson, it is important
L=5
L=4 to model the correct use of the term variable during
MELISSA class discussions while accepting students’ language
JORDAN in discussions.
L=7
L=6
Figure 1: Sample notes showing a first name and the number of
letters method
An efficient way to collect this data is to draw a data table on chart
TIMS Tip !
Since both variables are numerical (Number of Letters
paper and have students arrange their self-adhesive notes on it. and Number of Students), it is best to avoid using N to
See Figure 2. stand for either variable.
L
Number of Letters Names of Students
in First Name
1
Collect
2 Write your first name and the number of letters in your name on a slip of
paper like those below. Discuss with your class what the variable L stands
for. Put the class data in a table like the one below.
3 Letters in First Name
Seth Ivan Eric
Katy
4 L=4
Dana
L=4 L=4 L=4
L=4
Jamie Peter Colin Aesis Brian
5
L=5 L=5 L=5 L=5 L=5
Jason Jason
L=5 L=5
Joseph Andrew Jordan Merley Darius
6 L=6
Amanda
L=6
Miguel
L=6
Samuel
L=6 L=6
L=6 L=6 L=6
Discuss with your class how you might make the table easier to read. Then
Zachary Kristin Anthony Melissa Kenneth copy the class data onto the data table on the First Names Data Table and
7 Graph page in the Student Activity Book.
L=7 L=7 L=7 L=7 L=7
Kathryn Jeffrey Melissa Nicolas Natasha
L=7 L=7 L=7 L=7 L=7
Graph
8
Discuss with your class how to make a class graph of your data. Which
Elizabeth variable will you graph on the horizontal axis ( )? Which variable will you
9 graph on the vertical axis ( )?
L=9
Use the data table to make a bar graph on the First Names Data Table and
Graph page.
10
Christopher 4 SG • Grade 3 • Unit 1 • Lesson 1 First Names
11 L = 11
Student Guide — Page 4
Figure 2: A sample data table
TLP • Grade 3 • Unit 1 • Lesson 1 5
MTB4_G3_TG_U01_FINAL.indd 5 7/29/13 2:00 PM!
Organize the Data. Once you have the raw data, use the following
TIMS Tip prompt to begin a discussion:
Save the class graph for use in Unit 3 Lesson 1 X What do you notice about our data table? What patterns do
T-Shirt Factory Problems. Students solve problems you see? (Students may notice that no one has a first name with
that involve the number of letters in their names. only one letter, that many people have first names that have five or
six letters, or that there are few very long or very short names.)
After a general discussion, pose specific questions that can be
answered directly from the raw data. In your questions, try to use
“number of letters” to familiarize students with variable terminology:
X Who has the longest name? What is the number of letters
in that name?
X Who has the shortest name? What is the number of letters
in that name?
X Does anyone have a first name with eight letters?
X How many students have first names with six letters?
five letters?
X What number of letters is most common in first names?
X Do more than half the students have names with either six
or seven letters?
Adding a third column to the table with the total number of names in
each row will clarify the data. See Figure 3. Review the titles of the
L
Number of Letters in First Name Names of Students
S
Number of Students
first two columns and the information contained in them. Ask:
1 0
X What information will we put in the third column? (The
2 0 number of students with each number of letters.)
3 0 X What title should we give it? Why? (Number of Students works
Seth
Katy Ivan Eric
best. Titling the column “Students” insufficiently describes how the
4 L=4 L=4
5
information in that column differs from that in the second column.)
L=4 L=4
Dana
L=4
Jamie Peter Colin Aesis Brian
5 7
X Would N for Number of Students be a good choice to
L=5 L=5 L=5 L=5 L=5
Jason Jason
L=5 L=5
6
Joseph
L=6
Amanda
Andrew
L=6
Miguel
Jordan
L=6
Samuel
Merley
L=6
Darius
L=6
8 represent this variable? Why or why not? (N might seem
logical because it is the first letter of the word number, but this
L=6 L=6 L=6
Zachary Kristin Anthony Melissa Kenneth
7
L=7
10
L=7 L=7 L=7 L=7
Kathryn
L=7
Jeffrey
L=7
Melissa
L=7
Nicolas
L=7
Natasha
L=7 would be confusing because N could also refer to “Number of
Letters in First Name.”)
Figure 3: A portion of a modified data table When the data table is complete, ask students to work with a partner
to answer the following questions using the added information:
X If you add all the numbers in the last column, what should
they total? What does that number represent? (The sum
should equal the number of students in the class. Finding the sum
and comparing it to the class size is one way to check to see if the
data gathering is accurate.)
X Do more than half the students have names with either five
or six letters? (This is a multistep problem that can be solved
different ways. Possible response: First I would add the number
of students with either 5 or 6 letters, and then I would add the
number of students for all the other number of letters. I can then
compare my two answers to see if the number of students with 5
or 6 letters is more than half.)
6 TLP • Grade 3 • Unit 1 • Lesson 1
MTB4_G3_TG_U01_FINAL.indd 6 7/29/13 2:00 PMGraph the Data. Now that there are two variables, Number of
Letters in First Name (L) and Number of Students (S ), a graph can
be made. The class makes one poster-size graph, and each student
makes a graph using the First Names Data Table and Graph page
Frequency of Letters in First Name
10 11
in the Student Activity Book. Ask students to record the Number of
First Names Data Table and Graph
9
Students (S ) in the table. Introduce the graph by drawing attention to
8
7
the elements of a graph, such as the vertical and horizontal axes and
6
Date
the labels for these axes using a display of the First Names Data Table
5
4
and Graph page.
3
2
1
One way to make a class graph is simply to move the self-adhesive
15
14
13
12
11
10
9
8
7
6
5
4
3
2
1
0
Complete the table. Use the table to make a bar graph.
notes onto a labeled graph on a piece of chart paper. Place the self-
Number of Students
S
adhesive notes on the vertical grid lines rather than in the spaces
Frequency of Letters in First Name
between them so there will be less confusion later when students
make point graphs. Figure 4 shows a graph of the data presented in
Copyright © Kendall Hunt Publishing Company
Figures 2 and 3.
Help students read the graph by asking:
11
10
1
2
3
4
5
6
7
8
9
X Which numbers show the number of letters in the
names—those on the horizontal axis or those on the
Name
vertical axis? (horizontal axis) First Names SAB • Grade 3 • Unit 1 • Lesson 1 3
X What do the numbers on the vertical axis show?
(Number of Students) Student Activity Book — Page 3
Frequency of Letters in First Name
10 Natasha
L=7
9 Nicolas
L=7
8 Samuel Melissa
Number of Students
L=6 L=7
7 Jason Miguel Jeffrey
L=5 L=6 L=7
6 Jason Amanda Kathryn
L=5 L=6 L=7
5
S
Dana Brian Darius Kenneth
#L
L ==44 L=5 L=6 L=7
4 Eric
Eric Aesis Merley Melissa
#L
L == 44 L=5 L=6 L=7
3 Ivan
Ivan Colin Jordan Anthony
#L
L == 44 L=5 #L
L ==66 L=7
2 Katy Peter Andrew Kristin
#L
L ==44 L=5 L=6 L=7
1 Seth
Seth Jamie Joseph Zachary Elizabeth Christopher
#L
L == 44 L=5 L=6 L=7 L=9 L = 11
0
1 2 3 4 5 6 7 8 9 10 11
L
Number of Letters in First Name
Figure 4: Graphing the data on a bar graph
TLP • Grade 3 • Unit 1 • Lesson 1 7
MTB4_G3_TG_U01_FINAL.indd 7 7/29/13 2:00 PMExplore the Data. At this point, you have two representations of
the same data: a data table and a graph. Questions 1–5 of the
Explore Explore section in the Student Guide can be answered by reading
Use your data to answer the following questions about the first names in
either the data table or graph. Encouraging multiple solutions lets
your class.
1. How many letters are in the longest name?
every student access the problem in different ways and using different
2. How many letters are in the shortest name? representations. Point out that solutions by different methods should
3. What is the most common number of letters?
4. How many students have names with four letters?
agree. If a graph shows that ten people have names with seven
5. How many students have names with five letters? letters and a data table shows that there are only nine such names,
something is wrong. Ask groups to show how they used each tool to
Discuss answer Questions 1–5.
Discuss the following questions with your group. Be prepared to discuss
your answers with the class.
Assign Questions 6–13 in the Student Guide. These questions
6. Compare the graph and the data table. How are they alike?
How are they different? ask students to extend their interpretation of the data and to make
7. What is the shape of the graph? Why does it have this shape?
8. Which bars are the same height? Why?
predictions. Ask small groups of students to prepare to share their
9. Why aren’t there bars above every number on the horizontal axis?
What does this mean?
solutions to one or more problems with the whole class.
Question 6 asks students to compare the graph and the data table.
The graph and the data table contain the same information in different
forms. Both show the number of students who have a given number
of letters in their first names. The data table shows the Number of
Letters in First Name in the first column and the Number of Students
First Names SG • Grade 3 • Unit 1 • Lesson 1 5
with those numbers of letters in the second column. The graph shows
the Number of Letters in First Name on the horizontal axis and the
Student Guide — Page 5 Number of Students on the vertical axis. The height of each bar shows
the number of students for a given number of letters.
Content Note
Interpreting data in tables and Teacher: How do you know? Where did you Teacher: Seven what?
graphs. Students often have problems look to find that answer? Linda: Seven letters.
distinguishing between variables in an Maya: I looked at the numbers at the bottom of Teacher: How do you know?
investigation, especially when both of the the graph and went across and saw that the last
Linda: Because I picked seven and went across
one that went up to a line was 11.
main variables are numerical. Discussing and because I looked and seven was the tallest
Teacher: What do the numbers that go bar.
the Explore questions will help students
along the bottom of the graph tell you?
learn to interpret the graph and data table [Maya looks confused.] Are they the Number
Teacher: How many students have seven
correctly. Students need to understand letters in their names? How do you know?
of Letters or Number of Students?
Where do you look to find out? Come and
when they are talking about Number of Jackie: Number of Letters in our names. show us.
Letters and when they are talking about Teacher: How many letters are in the Linda: Ten students. You look at the data table
Number of Students. The following shortest name? Where can you look to find and look for the most number of students, and
sample dialog of a class discussing the answer? you see it’s ten, and you go over here, and you
Questions 1–4 is based on the data in Jacob: Four letters. I looked at the numbers at see that it is seven letters.
Figures 3 and 4. Student responses are the bottom of the graph. Teacher: How many students have names
adapted from a video of a classroom Teacher: How did you know it was the with six letters in their names? How do you
discussion. shortest? know?
Jacob: Because you look on the graph or the Keenya: You look at the graph where it says
Teacher: How many letters are in the table. Nobody has one, two, or three letters in Letters and go to where the 6 bar stops, then go
longest name? their names. Then five people have four letters. up to see the number is 8.
Maya: There are 11. Teacher: What is the most common number Teacher: Where do you go to see the
Teacher: Eleven what? of letters in our names? What is the most number 8? What does it tell you?
Maya: 11 letters. common name length? Keenya: You go to the left where it says Number
Linda: The number seven. of Students.
Here are some sample student responses to this question taken from
8 TLP • Grade 3 • Unit 1 • Lesson 1
MTB4_G3_TG_U01_FINAL.indd 8 7/29/13 2:00 PMa video of students working in groups:
Group A You make predictions every day. Predictions are statements based on what you
know and the patterns you see.
“They are alike because they give the same information. They are When the temperature is cold and you see big, dark clouds in the sky, you might
predict snowy weather. If you have a bag with more red jelly beans than any other
different because one has rows of numbers and one has bars with color, you might predict that the next bean you pull from the bag will be red.
People look at patterns to see what is most likely to happen. Then they make
numbers and letters.” predictions based on that information.
10. Pretend a new student is coming to class. What can you predict about the
length of his or her name? Explain your thinking.
Group B 11. How would the graph change if you added all the third-grade classes in
your school?
“They are alike because the graph and the data table have the same
data. They have the same stuff in them. They are different because of
the different ways of showing the data.”
Question 7 asks students to discuss the shape of the graph. While
students may describe the shape as stair steps or as a mountain, it is
more important to recognize why the bars form that shape. The bars
represent the number of students with very short names on the left 12. Elizabeth and Miguel are discussing Question 11. Do you agree with
Elizabeth or Miguel? Explain your thinking.
and very long names on the right. These names are not as common 13. How would the graph change if everyone in class added two names from
their family? Discuss.
as names with five, six, or seven letters. The tall bars in the middle 14. What number of letters should computer games allow for first names?
represent the length of the most common names. Possible answers
Write a letter to the TIMS Game Company to let them know. Describe
the investigation you did. Include the results that helped you reach
your decision.
for Questions 8–13 are in the answer key.
6 SG • Grade 3 • Unit 1 • Lesson 1 First Names
Summarizing the Lesson Student Guide — Page 6
To bring the ideas of the lesson together, ask students to review the
first two pages in the Student Guide. In a class discussion, ask them
to compare Elizabeth and Miguel’s data to your class data. Ask:
X What is the most common number of letters in Elizabeth
and Miguel’s data? How do you know? (Possible responses:
Seven letters because it looks like the most names in the seven
row of the data table. The tallest bar is for seven letters on the
bar graph.)
X Is it easier to tell how many students have seven letters in
their names from Elizabeth and Miguel’s data table or their
graph? Why do you think so? (Possible response: The graph is
easier because it is easy to pick out the tallest bar and then look
where it stops on the left. If the bar reaches ten, then the number
is ten.)
X What do you think they should do to their data table to
make it easier to read? (Possible response: They should add a
third column and count the names.)
X What should the title of the third column be?
(Number of Students)
TLP • Grade 3 • Unit 1 • Lesson 1 9
MTB4_G3_TG_U01_FINAL.indd 9 7/29/13 2:00 PMX Look at Miguel and Elizabeth’s graph and our class graph.
Name Date
How are they alike? How are they different? (Answers will
Family Names Data Table vary. However, students should notice where the tall bars and
short bars are located on each graph. There will likely be very
Homework
short bars for the longest and shortest names. The tall bars will
Dear Family Member:
Help your child collect at least ten first names from your immediate or extended family. likely center around five, six, or seven letters. Students may also
Count the number of letters in each name. Write each family member’s first name in the
Names of Family Members column next to the corresponding number of letters in the compare the most common number of letters for Elizabeth and
name. For example, “James” would be written in the row with “5.”
Thank you for your cooperation. Miguel’s data (seven) to the most common number of letters in the
Collect at least ten first names from your family. Count the number of class data.)
letters in each name. Write each name in the corresponding row.
L
Number of Letters
Refer students to and discuss Question 14 in the Student Guide. This
Names of Family Members
in First Name question returns to Elizabeth and Miguel’s original question about a
1
2
computer game, “What number of letters should players be able to
3 type for their names?” Students should consider both the range of the
4 numbers of letters in the names as well as the most common number
5
Copyright © Kendall Hunt Publishing Company
6 of letters.
7
8 Distribute the Lisa’s Class Graph Assessment Master from the
9
10
Teacher Guide. Ask students to complete Questions 1–5 using the
11 graph at the top of the first page.
First Names SAB • Grade 3 • Unit 1 • Lesson 1 5
Student Activity Book — Page 5
Ongoing Assessment
Use the Lisa’s Class Graph Assessment Master and the
Feedback Box from the Teacher Guide to assess students’
abilities to describe a data set by interpreting a graph [E3] and
to make predictions and generalizations about a population using
Name Date
a graph [E4].
Family Names Graph
Homework
Dear Family Member:
In class, we collected data on the number of letters in our first names. We displayed
this data in a bar graph. Now, your child is using the data from your Family Names Data
Homework and Practice
Table to create a new bar graph. Ask your child how this graph compares to the graph
made in school.
Thank you for your help.
Graph the data from your Family Names Data Table. Use the dotted
lines to help you draw the bars.
Family Names
X Assign the Family Names Data Table and Family Names Graph
pages in the Student Activity Book after completing the lab in
11
10 class. There are two parts to the assignment that can be done
9
on successive nights. Using the Family Names Data Table, each
Number of People
8
7
6
student collects family first names. On the second evening, he
P
or she graphs the data on the Family Names Graph. Students
Copyright © Kendall Hunt Publishing Company
5
4
3 can also write about how their family graphs compare with the
2
1
class graph.
0
1 2 3 4 5
L
6 7 8 9 10 11
X Assign the Careless Professor Peabody page in the Student Activity
Number of Letters Book. This page provides practice reading a bar graph.
First Names SAB • Grade 3 • Unit 1 • Lesson 1 7 X Assign DPP items A–F. Bits A and C involve partitioning numbers
and Task B asks students to write a story for a number sentence.
DPP Bit E and Task F provide practice with telling time.
Student Activity Book — Page 7
Math Facts. DPP Task D asks students to analyze an incorrect
solution to a subtraction math fact question.
10 TLP • Grade 3 • Unit 1 • Lesson 1
MTB4_G3_TG_U01_FINAL.indd 10 7/29/13 2:00 PMExtensions
11
Frequency of Letters in First Name
10
X Explore the number of letters in full names. (This variable must
9
Professor Peabody lost his First Names data table. Use the graph to make a new data table.
be defined by the group.) The distribution of Number of Letters (L)
8
Number of Letters
7
for full names will be shifted to the right on the graph and will be
Careless Professor Peabody
6
L
more spread out than the first names distribution, allowing some
5
Date
4
interesting comparisons.
3
Homework
2
X The class might change the definition of name length. For
1
example, they could count the number of syllables or the number
11
10
9
8
7
6
5
4
3
2
1
0
Number of Students
of vowels instead of the number of letters.
S
X The class can collect additional first names from, for example,
another third-grade class. They can add these names to those
Frequency of Letters in First Name
already collected, or they could treat them separately.
of Students
Copyright © Kendall Hunt Publishing Company
Number
S
The following question explores what might happen if geographic
location or culture were changed:
of Letters
Number
10
11
1
2
3
4
5
6
7
8
9
L
X The Tikki Tikki Tembo story gives one interpretation of why
Name
Chinese names are shorter than names in other cultures.
9
How might the graph be different for a third-grade class in
First Names SAB • Grade 3 • Unit 1 • Lesson 1
China? Draw the new graph.
Student Activity Book — Page 9
TLP • Grade 3 • Unit 1 • Lesson 1 11
MTB4_G3_TG_U01_FINAL.indd 11 7/29/13 2:00 PMLesson
Number Line Target
2 Estimated Class Sessions: 1
3.NBT.A Use place value understanding
and properties of operations to perform
multi-digit arithmetic. (3.NBT.A.2)
MP2. Reason quantitatively.
This lesson introduces students to the class number line and their MP6. Attend to precision.
desk number line. These tools will be used by the class throughout
the year. Students discuss the similarities and differences between
the class number line and their desk number line. They play a
game to practice addition and keep score using a number line.
Content in this Lesson
• Practicing addition.
• Representing whole number sums on a number line [E6].
Assessment in this Lesson
Assessment Expectation Assessed
Observe E6. Represent whole number sums on number lines.
Number Line Target Game
Student Activity Book
Page 11
12 TLP • Grade 3 • Unit 1 • Lesson 2 Number Line Target
MTB4_G3_TG_U01_FINAL.indd 12 7/29/13 2:00 PMMaterials List
Materials Daily Practice
Lesson Homework Assessment
for Students and Problems
• Number Line Target
Student Page 7
Guide
Student Books
• Number Line • Number Line
Target Game Target Game
Student
Page 11 Page 11
Activity
• Number Line Target
Book
Game Boards
Page 12
• DPP Items G–H • Number Line Target • Home Practice
Teacher Resources
Game Boards Parts 1–2
Teacher optional
Guide – • Number Lines 0–30
digital 2 per student
• Number Lines 0–100
2 per student
Supplies for Students
• desk number line (0–100)
Supplies for Student Pairs
• scrap paper
• paper clips, centimeter connecting cubes, or beans to use as markers
Materials for the Teacher
• Display of Number Line Target Game Boards (Student Activity Book) Page 12
• class number line (0–130)
• Unit 1 Assessment Record
Materials Preparation
Number Lines. Display the class number line (0–130) where all students can see it and can reach it
with a pointer. Tape a number line (0–100) on each student’s desk for use throughout the year.
Number Line Target Game Learning Center. Place scrap paper, game markers, and the game
directions in a learning center to provide targeted practice. Laminate copies of the Number Line
Target Game Boards Master so students can record the moves in a round with a non-permanent
marker then wipe them clean for the new round (optional).
Number Line Target TLP • Grade 3 • Unit 1 • Lesson 2 13
MTB4_G3_TG_U01_FINAL.indd 13 7/29/13 2:00 PMTeacher Planning Notes
14 TLP • Grade 3 • Unit 1 • Lesson 2 Number Line Target
MTB4_G3_TG_U01_FINAL.indd 14 7/29/13 2:00 PMBefore the Lesson
Prepare to display and discuss DPP item G: Skip Counting on the
Number Line.
Developing the Lesson
Part 1. Introduce the Number Line
Compare Number Lines. Direct students’ attention to the class
TIMS Tip !
Use a pointer or meterstick if the class number line is
number line and the number lines on their desk. Use the following hanging higher than can be easily reached.
discussion prompts to compare them:
X Tell me what you see when you look at the class number
line. (It is a line and it has all the numbers from 0 to 130. The
numbers are written below dots or points.)
X Describe what you see when you look at the number lines
on your desk. (It is a line and it has all the fives and tens from
0 to 100. The numbers are written below marks on the line. The
biggest marks are for the tens; there are medium marks for the
fives, and smaller marks for the rest of the numbers.)
X How are the two number lines the same? How are they
different? (Possible responses: They are both lines with numbers
in order. The class number line goes up to 130 and my desk
3. Take turns covering numbers. The winner covers the number that makes the sum equal to or greater than the
number line goes only to 100. The class number line has dots and
2. Player 1 covers a number and then Player 2 covers a number. Players track the sum of the covered numbers
This game is for two players. The object of the game is to be the player that covers the sum equal to or
all the numbers are written below the dots. The desk number line
1. Player 1 chooses a target number. Start with a small number, such as 20, and play on Game Board 1.
has only the fives and tens written under marks. The numbers for
30
the tens are darker than the numbers for the fives.)
26 27 28 29
X Are all the other counting numbers represented on your
Number Line Target Game
25
desk number line? If so, how? (Possible responses: The
Date
21 22 23 24
Play the game using Game Board 2 with a larger target number, such as 100.
numbers are not written, but there are little marks for them. You
have to think about what numbers go where for the numbers
20
• game markers
+8
16 17 18 19
that are not fives or tens because they are not written below the
little marks.) 15
11 12 13 14
X Is 28 on your number lines? If so, how can you find it?
Materials: • Number Line Target Game Boards
+4
(Possible response: Yes, just go three marks past 25.)
10
X Show me 28 on your desk number line. How should I count
9
Copyright © Kendall Hunt Publishing Company
greater than the target number.
+6
8
from 25? (Start at 25. Then on 26, say 26, then 27, 28.)
using the number line.
7
6
target number.
5
Ask a student to point to 28 on the class number line and compare
4
+5
3
2
the location of where he or she is pointing to 28 on his or her desk
Directions
1
Variation
0
number lines.
Name
Number Line Target SAB • Grade 3 • Unit 1 • Lesson 2 11
Skip Counting on the Number Line. Display and discuss DPP
item G. As the class works through the questions, have one student
model on the class number line while students use their desk Student Activity Book — Page 11
number lines.
TLP • Grade 3 • Unit 1 • Lesson 2 15
MTB4_G3_TG_U01_FINAL.indd 15 7/29/13 2:00 PMPart 2. Play Number Line Target
Model the Game. Display the game markers and Game Board 1
100
30
30
of the Number Line Target Game Boards page in the Student Activity
9
26 27 28 29
95
Book. Referring to the rules on the Number Line Target Game page
90
30
8
in the Student Activity Book, demonstrate how to play Number Line
Number Line Target Game Boards
85
25
Target. Start by circling a target number, such as 20, on the number
80
21 22 23 24
20
7
line. Working with a volunteer, alternate choosing and covering
75
Date
70
numbers on the game board and showing the sum of the numbers
20
6
20
65
covered on the number line. A completed number line for a game with
16 17 18 19
60
a target number of 20 is shown in Figure 1. Player A covered a 9,
10
5
55
Player B covered a 3, and then Player A covered an 8.
15
50
10
11 12 13 14
4
45
The winner is the player who covers the number that makes the sum
40
35
equal to or greater than the target number. Therefore, each player
3
5
10
should carefully select numbers so that his or her opponent will not be
9
30
8
Copyright © Kendall Hunt Publishing Company
25
able to reach or exceed the target number.
2
5
7
20
6
5
15
Play the Game. Organize the class into pairs to play a few rounds
1
0
4
Game Board 1
Game Board 2
3
10
with Game Board 1. Students can record their moves on a copy of
2
5
1
the Number Lines 0–30 Master or they can sketch a number line on
0
0
0
0
Name
12 SAB • Grade 3 • Unit 1 • Lesson 2 Number Line Target
scrap paper. As students play, check to see that they recorded their
moves correctly. After they have learned to record their moves using
pencil and paper, they can play by simply moving a marker on the
Student Activity Book — Page 12 number line on the game board.
TIMS Tip ! Once students have played the game a few times with Game Board
1, tell them to play the game with Game Board 2. Students can first
record their moves on the Number Lines 0-100 Master or sketch
Laminate the Number Line Target Game Boards so
number lines showing only the fives and tens from 0 to 100. When
students can record their number line moves with a
students are comfortable recording their moves, they can use a
non-permanent marker then wipe them clean for the
marker to track the sums on their desk number lines.
next round.
Meeting Individual Needs
Ongoing Assessment Students can think of adding as hopping on the number line.
To solve a problem such as 5 plus 3 they start at 5, then make
Observe students as they are playing the Number 3 hops to 8. A common mistake is to include the starting point
Line Target Game. Note their ability to add whole when they count hops, saying “5, 6, 7” and landing on 7 as the
numbers using a number line [E6]. Put the Number answer. Remind them that to solve 5 1 3, they should start at 5,
Line Target Game in a learning center to provide then hop one move to 6, a second move to 7, and a third move
targeted practice. to 8.
+9 +3 +8
0 1 2 3 4 5 6 7 8 9 10 11 12 13 14 15 16 17 18 19 20 21 22 23 24 25 26 27 28 29 30
Figure 1: Keeping track of sums for the game with a
target of 20
16 TLP • Grade 3 • Unit 1 • Lesson 2
MTB4_G3_TG_U01_FINAL.indd 16 7/29/13 2:00 PMSummarizing the Lesson Lesson
2 Number Line Target
Play Number Line Target with a partner. Directions and game board are in the
Play a game of Number Line Target with a student and ask him or Student Activity Book.
her to explain his or her choices of numbers. Discuss strategies for
moving on the number line. Use prompts similar to the following:
If a student chooses 20 when the sum is at 30, ask:
X How can you move 20 on the number line without counting
each one? (Possible response: I count two more tens, 40, 50.)
Game Board 1
0 1 2 3 4 5 6 7 8 9
+9 +4
If a student chooses 30 when the marker is on 25, ask: 0 1 2 3 4 5 6 7 8 9 10 11 12 13 14 15 16 17 18 19 20 21 22 23 24 25 26 27 28 29 30
Jerome and Tanya are playing a game called Number Line Target. They are trying
X How can you move 30 on the number line without counting
to reach or go over the target number of 20 by moving on the number line. Jerome
started the game by covering 9 on the game board. He showed his move on the
number line. Tanya decided to cover the number 4 on the game board. The sum
each one? (Possible response: I count by tens starting at 25. I of 9 and 4 is 13. She added her move to Jerome’s on the number line and landed
on 13. Jerome studied the number line.
know that they will all end in 5, so 35, 45, 55.) 1. What number should Jerome choose next to reach or go over the target?
Explain your thinking.
2. Jerome decides to cover 2 on his next move. Does he reach or go over
Refer students to the vignette on the Number Line Target page in the his target?
3. If Jerome covers 2 on his move, what number should Tanya cover to reach
Student Guide. After describing the game plays between Tanya and or go over the target? Explain.
Jerome, ask student pairs to discuss Questions 1–3.
Number Line Target SG • Grade 3 • Unit 1 • Lesson 2 7
Student Guide — Page 7
Homework and Practice
X Students can take home the Number Line Target Game Board
and related directions from the Student Activity Book and play the
game with their families.
X Assign Home Practice Parts 1 and 2.
X Assign DPP items G and H. DPP Bit G and Task H develop
number sense.
Math Facts. Home Practice Parts 1 and 2 provide practice with
addition and subtraction math facts.
Extension
Place the Number Line Target Game in a center for students to play
using one of the following game board variations:
X Create a game board without twos and threes. After playing, ask
students to name a few sums that cannot be made with these
numbers missing.
X Create a game board with only even numbers and ask students to
describe the patterns they notice in the sums.
X Create a game board with only odd numbers and ask students to Teacher Guide — Home Practice Parts 1 and 2
describe the patterns they notice in the sums.
TLP • Grade 3 • Unit 1 • Lesson 2 17
MTB4_G3_TG_U01_FINAL.indd 17 7/29/13 2:00 PMLesson
Kind of Bean
3 Estimated Class Sessions: 3
3.MD.B Represent and interpret data.
(3.MD.B.3)
3.NBT.A Use place value understanding
and properties of operations to perform
Students make predictions and generalizations about a population multi-digit arithmetic. (3.NBT.A.2)
MP1. Make sense of problems and
by studying a sample. In the Kind of Bean Lab, students take a persevere in solving them.
scoopful of dry beans from a population of beans. After students MP2. Reason quantitatively.
sort and count the beans, they record, organize, graph, and MP3. Construct viable arguments and
critique the reasoning of others.
analyze their data.
MP4. Model with mathematics.
MP7. Look for and make sense of
Content in this Lesson structure.
• Representing and using variables of an investigation [E1].
• Drawing scaled bar graphs from a table [E2].
• Reading a table or scaled graph to find information about a data set [E3].
• Making predictions and generalizations about a population from a sample using
data tables and graphs [E4].
• Communicating reasoning and solutions verbally and in writing [MPE5].
• Representing whole number sums on number lines [E6].
Assessment in this Lesson
Math Practices
Assessment Expectation Assessed
Expectation Assessed
Kind of Bean Lab Picture E1. Represent the variables and
Student Activity Book procedures of an investigation in
Page 13 a drawing.
Kind of Bean Lab Graph E2. Draw scaled bar and picture
Student Activity Book graphs from a table.
Page 14
Kind of Bean Lab E2. Draw scaled bar and picture MPE5. Show my work. I show
Check-In: graphs from a table. or tell how I arrived at
Questions 7–11 E3. Read a table or scaled graph to my answer so someone
with Feedback Boxes find information about a data set. else can understand
Student Activity Book my thinking.
E4. Make predictions and
Pages 16–19
generalizations about a
population from a sample using
data tables and graphs.
DPP Item L Playing E6. Represent whole number sums
Number Line Target on number lines.
Teacher Guide – digital
18 TLP • Grade 3 • Unit 1 • Lesson 3 Kind of Bean
MTB4_G3_TG_U01_FINAL.indd 18 7/29/13 2:00 PMVocabulary in this Lesson
• certain event • likely event • scaled graph • variable
• horizontal axis • population • unlikely event • vertical axis
• impossible event • sample • value
Materials List
Materials Daily Practice
Lesson Homework Assessment
for Students and Problems
• Kind of Bean
Student Pages 8–11
Guide • Math Practices
Reference
• Kind of Bean Lab • Toni’s Candy Grab • Kind of Bean Lab
Student Books
Pages 13–19 Page 21 Picture
Page 13
• Kind of Bean Lab
Student
Graph
Activity
Page 14
Book
• Kind of Bean Lab
Check-In:
Questions 7–11
Pages 16–19
• DPP Items I–N • DPP Item L
Resources
Teacher
Teacher
Playing Number Line
Guide – Target
digital
Supplies for Student Groups
• small container such as a margarine tub or yogurt cup
Materials for the Teacher
• Display of the Kind of Bean Lab Graph • 3 kinds of beans. See Materials Preparation.
(Student Activity Book) Page 14 • self-adhesive notes
• large container of mixed beans • Unit 1 Assessment Record
• 1
4 –cup scoop or 4-oz. paper cup
Materials Preparation
Create a Bean Population. Create a bean population by selecting three different types of beans.
Label a large container “bean population.” Fill a large container with the three types of beans and mix
them thoroughly. Students should not be told this recipe. Each type of bean should be approximately
the same size, and each type should be easily distinguishable from the others. It is important that the
mixture have one type of bean that is most common, e.g., 1 pound of red beans, 2 pounds of navy
beans, and 4 pounds of pinto beans.
Kind of Bean TLP • Grade 3 • Unit 1 • Lesson 3 19
MTB4_G3_TG_U01_FINAL.indd 19 7/29/13 2:00 PMLesson Developing the Lesson
3 Kind of Bean
Sampling a Population
What is a population? Part 1. Analyze Population Problems
A population is a group or collection of
things. The population of your city or town Use Sampling and the TIMS Laboratory Method to Study
is the group of people who live there.
Sometimes, a population is too big to
Populations. This lab involves learning about a population through
study or too hard to count. Then you
study a sample of the population. A sampling. Students will sample a collection of three types of beans to
sample is a smaller group or part of the
whole population. model sampling an animal population. Begin by discussing important
applications such as estimating wildlife populations. Explain that
sampling may be applied to situations closer to students’ lives. For
Say you want to learn about the population of pets in
your town. You can begin by counting the number of
example, they can estimate the number of squirrels, pigeons, cats, or
dogs, cats, birds, and other pets on your block.
dogs in their neighborhoods.
Using this information, you can predict the kinds of
pets that people have in your town.
Use the Kind of Bean pages in the Student Guide to depict the use
of the sampling process and the four steps of the lab method to
You can also use your data to predict
investigate a population. These pages illustrate an important point:
which pet is the most common in your
town or neighborhood. Even when a population cannot be directly studied, we can still draw
some conclusions about that population by sampling it and doing
some clever thinking.
8 SG • Grade 3 • Unit 1 • Lesson 3 Kind of Bean
Student Guide — Page 8
Content Note
Meanings of “Population.” The word population has more
than one meaning. In statistics (and in this lesson), a population
is the group of people or things being studied, such as the group
of people who live in a particular city or animals in the rain forest.
Students may be more familiar with the use of population to
A Sample of Animals mean the number of people who live in a country, city, or other
Betty Robinson and her scientist parents are studying animals in the Amazon Rain
Forest. The population of animals in the rain forest is very large, so Betty and her
parents study a sample of the animals. They have chosen a small area of the forest
region, such as the population of Seattle.
to investigate. They identify the types of animals they see in this area and count the
number of each type of animal. The two main variables in their experiment are the
type of animal and the number of each type.
Represent Sample Population Data. Questions 1–3 discuss
the variables in the scientists’ investigation of animals in the rain
forest. Identifying the variables is an important part of any experiment.
Questions 4–5 help students distinguish between the variables
and the values of those variables. In the Robinsons’ experiment,
the values of the variable Type of Animal are the names of the
animals they chose to study: spider monkeys, squirrels, river otters,
They use the TIMS Laboratory Method
Number of Each Animal Type armadillos, and jaguars. The values of the variable Number of Animals
to help them solve problems. First, they
draw a picture of the steps they will
follow in the experiment.
are the numbers of the animals they counted while conducting
Then, they collect and organize the the experiment. These are recorded in the second column of the
data in a data table.
Next, they graph their data. data table.
Finally, they analyze and discuss
their results.
When you have a problem, you, too,
Question 6 asks students to examine the vertical axis and the way
can use the tools of science to solve
it. We call these tools of science the it is scaled. Make sure students understand that there are values
TIMS Laboratory Method.
between each of the points on the vertical axis. For example, the
Kind of Bean SG • Grade 3 • Unit 1 • Lesson 3 9
bar representing 230 Spider Monkeys stops slightly above the
value of 225.
Student Guide — Page 9
20 TLP • Grade 3 • Unit 1 • Lesson 3
MTB4_G3_TG_U01_FINAL.indd 20 7/29/13 2:00 PMYou can also read