Forestry Thematic Exploitation Platform - User Manual v2019.03.28
←
→
Page content transcription
If your browser does not render page correctly, please read the page content below
Forestry Thematic Exploitation Platform

              User Manual

               v2019.03.28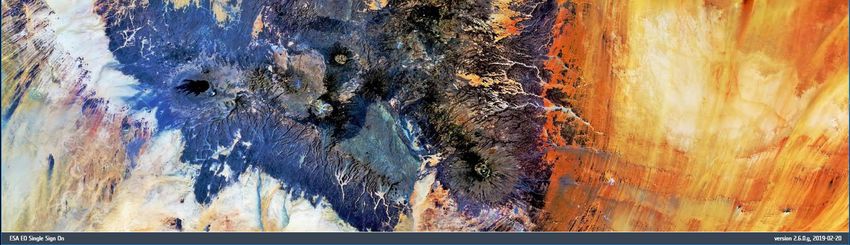
Forestry TEP user manual                                                       v2019.03.28

Contents
1     Intro and overview ............................................................................................................................. 4
    1.1      What is F-TEP? ............................................................................................................................ 4
    1.2      Platform infrastructure ............................................................................................................... 4
    1.3      Data availability .......................................................................................................................... 4
    1.4      Terminology and concepts .......................................................................................................... 5
2     Getting started................................................................................................................................... 6
    2.1      User account .............................................................................................................................. 6
    2.2      Entering the platform ................................................................................................................. 7
    2.3      Explorer interface ....................................................................................................................... 8
    2.4      Searching for data .................................................................................................................... 10
    2.5      Databaskets.............................................................................................................................. 13
    2.6      Manage / Share interface ......................................................................................................... 16
    2.7      Uploading reference data ......................................................................................................... 17
3     Running a service ............................................................................................................................. 18
    3.1      Selecting the service ................................................................................................................. 18
    3.2      Defining inputs ......................................................................................................................... 19
    3.3      Launching the service ............................................................................................................... 19
    3.4      Managing the job ..................................................................................................................... 19
    3.5      Parallel processing.................................................................................................................... 20
4     Processing services........................................................................................................................... 22
    4.1      VegetationIndices..................................................................................................................... 22
    4.2      ForestChangeS2........................................................................................................................ 24
    4.3      LandCoverS2 ............................................................................................................................ 26
    4.4      LandCoverS1 ............................................................................................................................ 29
    4.5      LandCoverGeotiff ..................................................................................................................... 32
    4.6      S1Biomass ................................................................................................................................ 34
    4.7      S1Stack ..................................................................................................................................... 36
5     Application services ......................................................................................................................... 37
    5.1      Monteverdi .............................................................................................................................. 37
    5.2      QGIS v2.18................................................................................................................................ 39
    5.3      QGIS v3.6.................................................................................................................................. 41
    5.4      SNAP ........................................................................................................................................ 42
6     Collaborative aspects ....................................................................................................................... 44
    6.1      Forum ...................................................................................................................................... 44
    6.2      Groups ..................................................................................................................................... 45

                                                                        Page 2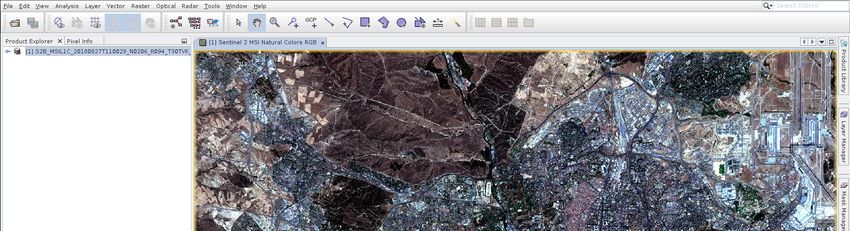
Forestry TEP user manual                                                      v2019.03.28

    6.3     Sharing data ............................................................................................................................. 47
7     Service development........................................................................................................................ 48
    7.1     Developer interface .................................................................................................................. 48
    7.2     Creating services ...................................................................................................................... 49
    7.3     Service example ....................................................................................................................... 51
    7.4     Sharing services ........................................................................................................................ 52

                                                                      Page 3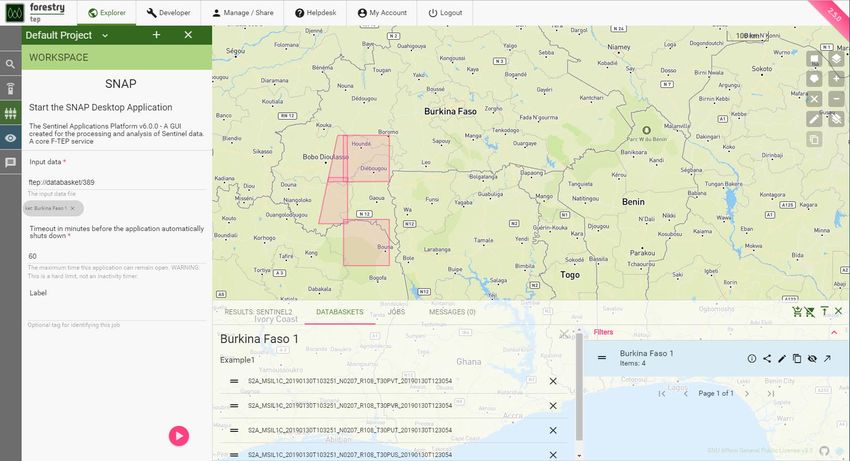
Forestry TEP user manual               v2019.03.28

1 Intro and overview

1.1 What is F-TEP?
Forestry Thematic Exploitation Platform is an online platform that enables users to
efficiently access and process satellite data for forest monitoring purposes. It offers a
wide range of readily available processing services and tools, and it enables users to
create and share their own processing services, tools and products.
The platform has been developed in projects funded by the European Space Agency
(ESA). ESA continues to support the platform financially. The platform is operated by
VTT in Finland and CGI IT UK, committed to maintain and develop the platform further
and support the users. More background and general information on the platform can be
found on other sections of the platform home page: https://f-tep.com/

1.2 Platform infrastructure
The Forestry TEP is integrated with CloudFerro’s CREODIAS1 infrastructure, one of the
Data Information and Access Services (DIAS). The baseline processing environment
available for all users consists of 4 virtual CPUs and 16 GB of RAM, along with
temporary workspace storage of approximately 64 GB (SSD-type). Output product
storage is not currently limited. The exact configuration of the processing environment,
including sizing and enforcing of storage quotas, is still under review. Usage levels are
monitored to ensure fair use.
Note that specific configurations are possible. If a processing service requires specific
capacity for CPU, RAM or storage, we may arrange dedicated resources. Please contact
the Forestry TEP team for further details.
From the user system set-up point of view, a screen width of 1920 pixels is
recommended. This will improve particularly the visual experience of using the
application services (e.g. QGIS, SNAP and Monteverdi).

1.3 Data availability
Through F-TEP, users can access all datasets stored in CREODIAS Earth Observation
(EO) catalogue2. Currently, the list of available satellites includes:
                Satellite             Platform
              Sentinel-1              S1A, S1B
              Sentinel-2              S2A, S2B
              Sentinel-3              S3A, S3B
              Sentinel-5P               S5P
               Landsat 5                n.a.
               Landsat 7                n.a.
               Landsat 8                n.a.

1
    https://creodias.eu/
2
    https://discovery.creodias.eu/dataset

                                                    Page 4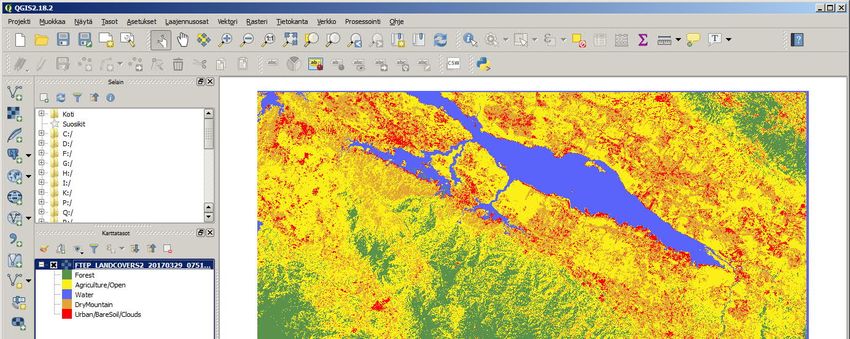
Forestry TEP user manual                       v2019.03.28

1.4 Terminology and concepts
This page describes the basic terminology and concepts that the user face while working
on the platform.
Databasket: A databasket refers to a logical grouping of satellite products and/or F-TEP
products and/or reference data held together for a particular purpose. A databasket is
identified by a name and a description. User can view and manage their databaskets
either within the data panel (at the bottom of the map panel in the ‘Explorer’ interface) or
in ‘Manage / Share’ interface.
Data Panel: Data Panel opens along the bottom of the ‘Explorer’ page and includes
details of recent data searches, databaskets, jobs and messages.
Developer interface: The developer interface allows a user to create his own workflows
as services.
Explorer interface: The explorer interface is the main interface for a user to select,
manage and use data and services.
Group: A group is a collection of users with a common interest. Groups allow users to
communicate and share material within a selected number of peers. They are managed
via the ‘Manage / Share’ interface.
Helpdesk: The helpdesk interface provides material and support to help users perform
actions on the platform. It also provides service desk information.
Job: A job is a specific data processing activity that has been instigated by the user.
Clicking on the jobs section of the data panel allows users to explore the job status.
Manage / Share interface: The Manage / Share interface lists the various groups that a
user belongs to. Groups allow users to communicate and share material within a selected
number of peers.
Message Panel: The message panel shows information from the F-TEP system to the
user about jobs, projects, databaskets etc.
My Account interface: The My Account interface provides an overview of the user’s
account including profile and F-TEP account activity.
Project: A project is a collection of activities that a user has defined to be related. A user
can create projects when commencing activities.
Service: A service is a data processing or visualisation application or workflows made
available to the users.
Coins: Coins are currently used mainly to monitor usage levels. In the future, the coins
will be part of the way to charge users for the use of the platform.
Workspace: The workspace panel is where the users manage all the activities and
entities defined in the system. They can interact with defined databaskets associated to
the current project here.

                                            Page 5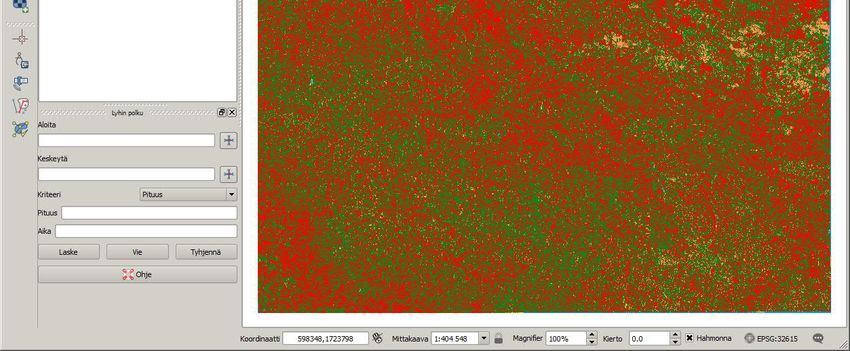
Forestry TEP user manual                       v2019.03.28

2 Getting started

2.1 User account
User authentication on the platform is managed by ESA's Earth Observation Single Sign
On (EO-SSO). It is possible to access the platform only after a successful authentication.
If you do not have an EO-SSO account yet, you can register using the following link (as
provided also at the top of the ESA Earth Online3 front page):
https://eo-sso-idp.eo.esa.int/idp/umsso20/registration
You will be presented with the following page:

Please note that your password must use at least 8 characters and include at least a
lower case, an upper case, a digit and a special character.
Once you have completed and submitted the registration form successfully, the following
message will be displayed:

You should then receive an email confirming that the first part of your registration has
been successful. It will provide you with a link that you will need to follow to complete the
registration process.

3
    https://earth.esa.int/

                                            Page 6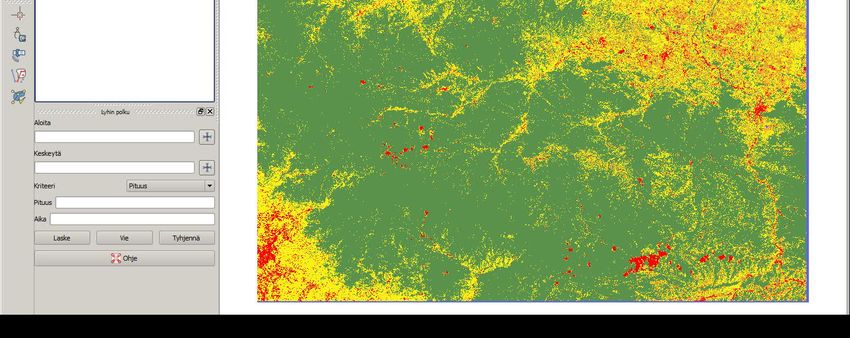
Forestry TEP user manual                    v2019.03.28

Once you click the link you should be presented with the following screen confirming that
your account has been successfully activated:

2.2 Entering the platform
With a user account set up, the F-TEP platform can be accessed from the website front
page at https://f-tep.com/ via the "Enter the platform" link. The platform can also be
reached through the direct link https://f-tep.com/app/.
On entering, you will first be redirected to ESA's EO-SSO platform and asked to login
using the details of your user account. You can also set the maximum idle time and
maximum session time that will determine how often you will be presented with the login
screen.

Once you have logged in you will be redirected to the F-TEP platform interface.
The main screens of the platform user interface are the following - accessible through
links at the top of the screen:
Explorer: This is the main, map-based interface for working with the input data, the
services and the processing jobs, as described in the next section.

                                           Page 7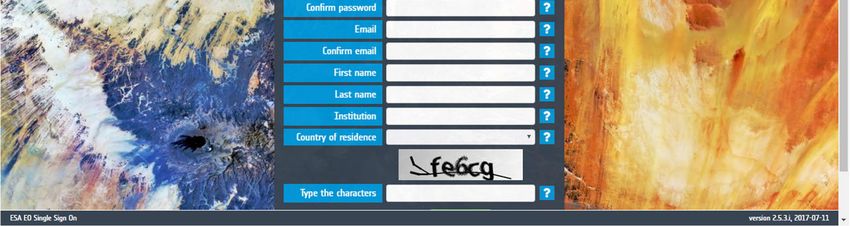
Forestry TEP user manual                      v2019.03.28

Developer: This interface allows expert users to create their own workflows and
services. This page is only visible / accessible for expert users. If you cannot see the
‘Developer’ interface but would like to develop your own services, you are encouraged to
request for an upgrade of your account status via the ‘Helpdesk’ (see below).
Manage / Share: This page allows a user to explore the various groups and projects they
belong to as well as access their files, data baskets, logs of their run jobs and any
services they have created. This page also allows users to share their services and
products with selected users.
Helpdesk: This page provides the user with access to useful supporting materials (e.g.
user manual and tutorial videos) and official documentation (e.g. Terms & Conditions and
License). Contact and feedback address is also provided here.
My Account: This page provides the user with information on the activities on F-TEP
including usage stats, profile information and use of ‘Coins’.

2.3 Explorer interface
On entrance, the F-TEP platform opens with the Explorer user interface.

The Explorer interface is built around the map panel. The map acts both as an input
element to specify an area of interest and to show the footprint of the results. Clickable
icons can be found on the left and right to of the map panel to access various
functionalities and to use necessary tools as described below.

                                            Page 8
Forestry TEP user manual                      v2019.03.28

The left column contains a series of icons that allow the user to execute various activities:

          The ‘Search’ icon allows the user to search for various datasets, including EO
          data, reference data and existing F-TEP products.

          The 'Services’ icon shows available services, which includes both satellite
          data pre-processing tools as well as forest and land cover monitoring
          applications.

          The 'Workspace’ icon allows the user to specify the parameters of a service
          and launch the process.

          The ‘Data Panel’ icon opens the Data Panel along the bottom of the display.
          Search results, databaskets and information on jobs are provided in this panel.

          The ‘Messages’ icon opens the Messages panel along the bottom of the
          display. Any messages from the system are provided in this panel.

Map tools can be found in the right column and include:

        The ‘Draw Square’ icon allows the user to draw a square on the map, to be
        used to define search area.
        The ‘Draw Polygon’ icon allows the user to draw a polygon on the map, to be
        used to define search area.
        The ‘Remove Search Polygon’ icon deletes the square or polygon areas of
        interest currently on the map.
        The ‘Edit Polygon’ icon allows the user to manually edit the vertex coordinates
        of a search polygon.
        The ‘Copy Polygon to Clipboard’ icon allows user to copy the vertex coordinates
        of a search polygon to clip board, to be copied to any text editor.

        The ‘Map Layer’ icon allows the user to choose the base map to be used.

        The ‘Zoom in’ icon allows to user to zoom in on the map. Note that this can also
        be done with the scroll wheel of the mouse.
        The ‘Zoom out’ icon allows to user to zoom out on the map. Note that this can
        also be done with the scroll wheel of the mouse.
        The ‘Clear Map’ icon removes all polygons from the map and resets the map to
        default extent.

                                            Page 9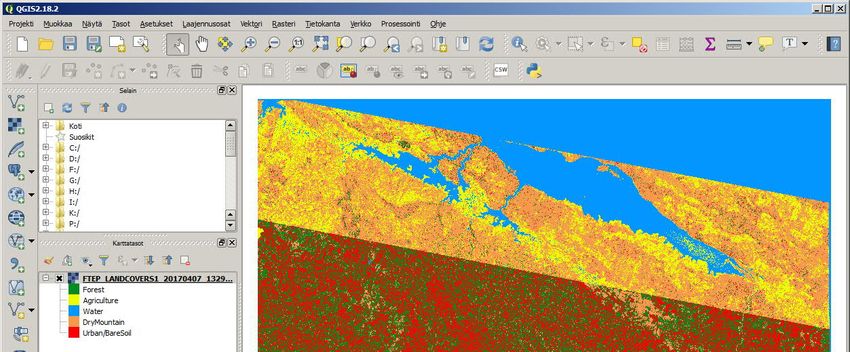
Forestry TEP user manual                 v2019.03.28

2.4 Searching for data
The search tool is activated by clicking the ‘Search’ icon.
This opens the search panel with three tabs to specify the target:
      ·    Satellite: enables to search for satellite data. The search request is dispatched to
           the appropriate backend data provider. For most parameter configurations this will
           be the CREODIAS EO catalogue4. The list of available satellites can be seen in
           the drop down menu of the ‘Mission’ parameter.
      ·    Reference: enables to search for data uploaded by or made available to the user.
      ·    F-TEP Products: enables to search for products previously processed in F-TEP.
In each of the search panels, a set of parameters can be used to narrow down the search
to limit the number of results.
To search for satellite data, the ‘Satellite’ tab is clicked, which opens the Satellite search
panel. Available satellites can be seen in the drop down menu of the ‘Mission’ parameter.
After choosing the satellite mission, the search panel shows a relevant selection of
parameters.
To narrow the search to a specific time period, the start and end dates need to be
specific in the ‘Product date’ parameter.
An area of interest (AOI) can be drawn on the map using the map tool provided on the
right hand side. The coordinates of the polygon drawn on the map are automatically read
into the ‘AOI’ parameter. It is also possible to define the Area of Interest (AOI) by drag-
and-dropping a KML file from the user’s file system on top of the map view.
To submit the search, click the search button at the bottom right corner of the of the
search panel. The system will show a spinner while the search is being submitted and
the results collected.
The picture below shows an example search for Sentinel-2 products, with an area of
interest on the Iberian Peninsula and time range from Jan 1st 2019 to Feb 28th 2019. In
addition, the maximum cloud coverage is set to 20% and level L1C products are
searched.

4
    https://discovery.creodias.eu/dataset

                                                   Page 10
Forestry TEP user manual v2019.03.28
The list of results are shown in the ‘Results’ panel at the bottom of the page. Image
footprints are also presented on the map. By clicking on a particular row or rows in the
‘Results’ panel, the corresponding map footprint(s) is shown and highlighted on the map.
Note that if the search returns many results, they are divided to multiple pages of results,
and only the footprints of the current page of results are shown.
Page 11Forestry TEP user manual v2019.03.28
By clicking on the information link, metadata of the selected image will be shown. A
quicklook image will also be shown, whenever available.
In case of Sentinel-2 data in particular, the user is generally recommended to identify as
cloud-free images as possible.
Having located suitable data to use in processing, the user may be interested to proceed
with selecting and launching a particular processing service or application, as described
below in sections 3, 4 and 5. Alternatively, the user might want to collect the search
results for later reference in a databasket, as described next in section 2.5.
Page 12Forestry TEP user manual v2019.03.28
2.5 Databaskets
A Databasket is a logical grouping of satellite data and/or F-TEP products and/or
reference data held together for a particular purpose and identified by a name.
By selecting a number of products in the Result Panel and clicking on the ‘Create New
Databasket’ button it is possible to create a databasket containing the selected products.
A pop-up window listing all the selected images will open. In this window the user should
give a name for the databasket. A short description of the databasket may also be given.
The ‘Databaskets’ panel allows managing and/or creating databaskets. The panel lists all
the databaskets created by or shared to the user.
Page 13Forestry TEP user manual v2019.03.28
For each databasket the available actions are detailed below.
The ‘Information’ icon provides basic information on the databasket.
The ‘Share’ icon allows the user to share the databasket with a selected group
and choose the permissions to be given for the group.
The ‘Edit’ icon allows the user to modify the basic information and to delete the
entire databasket. A confirmation will be needed to delete the databasket.
The ‘Clone’ icon creates a new databasket with the same content of the selected
one. The user can specify the name and the description of the new databasket.
The ‘Load/Unload’ icon loads/unloads the images of the databasket on the map.
The ‘Open in Manage/Share’ icon will open the databasket in the Manage/Share
interface. As well as managing within the Explorer interface, databaskets can
also be created, deleted, and managed in the Manage/Share interface.
A Databasket can be used as input for a process, thus allowing launching a service or a
graphical application on several files. The following picture shows the content of the
databasket "Thailand 1" loaded on the map and used as input to the service ‘SNAP’ (i.e.
the Sentinel Applications Platform). The databasket can be dragged into the ‘Input data’
parameter field of a service by grabbing and dragging the ‘Drag databasket’ icon in front
to the databasket name.
It is possible to modify the content of a databasket at any time after its creation. Moreover
it is possible to create a databasket containing mixed content. The sequence of pictures
below shows the addition of a Sentinel-1 product to the databasket "Thailand 1" shown
above containing Sentinel-2 products.
Page 14Forestry TEP user manual v2019.03.28
The following picture shows the result of a search for Sentinel-1 products. The selected
item(s) can be added to any databasket the user has by clicking the ‘Add to…’ icon. If
necessary, the desired databasket can be selected using the ‘Select Databasket’ icon.
The following picture shows the content of the "Burkina Faso 1" databasket after the
addition of the Sentinel-1 product.
Page 15Forestry TEP user manual v2019.03.28
2.6 Manage / Share interface
This interface allows users to manage and share their various assets and data. They can
e.g. explore the various groups and projects they belong to, as well as access and
manage their files, data baskets, logs of their jobs and any services they have created.
This page also allows users to share their services and products with selected users.
The functionalities of the Manage / Share interface are accessed through the icons on
the left hand side the page. After clicking the icons, the respective panel will open on the
left hand side. In these panels users can filter between generic (‘All’), their own (‘Mine’) or
shared (‘Shared’) assets respectively. They can also search by name for a specific asset.
The ‘Groups’ icon allows the user to see and manage all the groups that the
user belongs to or has created. Through this interface the user can e.g.
change permission levels, add/remove users etc., or delete the entire group.
The ‘Projects’ icon allows the user to see and manage all the projects that the
user may have created. This feature is under development.
The ‘Databaskets’ icon allows the user to see and manage all the databaskets
the user has created or has permissions on. The user can e.g. add result
products or reference data into the baskets, remove files from the basket, or
delete the entire basket.
The ‘Jobs’ icon allows the user to see and manage all the jobs the user has
run or has permissions on. In addition to all the technical details of the job, the
input files, output products and log files can be seen and the output products
can be downloaded through this interface. The user can also share the job
with other users.
The 'Services’ icon allows the user to see and manage all the services the
user has created or has permissions on. The user can edit the service
descriptions and see the list of associated files. Note, however, that services
are created and modified in the ‘Developer’ interface.
The ‘Files’ icon allows the user to see and manage all the file the user has
produced, uploaded or has permissions on. The user can filter between
reference data and output products. ‘Reference data’ is data generated
outside of F-TEP and uploaded into the platform, whereas output products
have been generated within F-TEP.
The ‘Messages’ icon opens the Messages panel along the bottom of the
display. Any messages from the system are provided in this panel.
Page 16Forestry TEP user manual v2019.03.28
2.7 Uploading reference data
Reference data can be added in the ‘Files’ section of the Manage / Share interface.
To add reference data, a user will click the ‘Add’ icon at the bottom of the panel and
then drag and drop or click to select their local file to be uploaded (see the image
below). The maximum file size is currently set to 50 MB. Users will also need to define
the geometry to allow the data to be geographically mapped within the system. This is
the geographic coverage of the data file and is given in the Well-known text (WKT)5
POLYGON specification. An example of a valid AOI specification is: POLYGON((-
92.906633 16.190411,-92.066559 16.188383,-92.070266 15.376645,-92.907004
15.378567,-92.906633 16.190411)).
5
https://en.wikipedia.org/wiki/Well-known_text_representation_of_geometry
Page 17Forestry TEP user manual v2019.03.28
3 Running a service
The F-TEP portal allows users to run a selection of algorithms on search results and/or
on products ingested in F-TEP itself. It is also possible for users to create their own
services in the ‘Developer’ interface.
3.1 Selecting the service
Available image processing algorithms (known as Services) can be browsed in the
‘Services’ panel which can be opened by clicking the ‘Services’ icon on the left hand side
the ‘Explorer’ interface. Clicking on the ‘info’ icon shows a brief description of the service.
Services are classified into different groups:
‘Processor Services’ - run on the F-TEP platform as single stage processes, such as
Land cover mapping or Vegetation Indices.
‘Application Services’ - interactive open-source applications run inside the platform,
such as SNAP or QGIS.
‘Bulk Processor Services’ - processor services designed for bulk / large volume
processing. Note: this category is an artefact of a prior feature of the platform design
and is being replaced with the Parallel Processing feature described below.
The user has an option to either browse all service types, or select the desired service
type from the dropdown menu at the top of the ‘Services’ panel. Filtering options can be
applied as well.
Page 18Forestry TEP user manual v2019.03.28
3.2 Defining inputs
When a service is selected, the 'Workspace’ panel will open so the user can define the
parameters needed for the service to run.
To define the input data, a user can drag into the input data field:
· Result(s) of a product search (Satellite, Reference or F-TEP Products)
· Output of a previous processing job
· Item(s) contained in a databasket
· A databasket itself, to add at once all the items contained
Note also the ‘plus’ sign on the right of the input data field. This allows opening a new
input data field (for direct manual input) for those services that allow several input data
files. The same effect can be reached by dragging any input image into the input data
field, which will automatically open a new field for potential additional input data.
Apart from the inputs, each service will have a specific set of parameters, briefly
described in the workspace. More information on particular services and the parameters
needed to run them can be found in the service descriptions provided in the user manual.
3.3 Launching the service
Once the input data and other parameters have been defined, the service is executed
by clicking the ‘Launch’ button at the bottom of the Workspace panel. The user is then
asked for confirmation regarding spending of Coins. After accepting, the Data Panel
opens at the bottom of screen with the ‘Jobs’ section open.
The launched job will appear at the top of jobs list, showing its unique numeric ID, the
service name and the starting time (UTC). A coloured icon on the left depicts the status
of the processing jobs. Below is an example of a successfully completed job.
3.4 Managing the job
The jobs listing provides for each job functional icons that allow to (from left to right):
· View job metadata such as the job owner, status, and start and end times;
· ‘Share’: share the job, including its outputs, to a specified group of users;
· ‘Edit and re-run’: use the input parameters defined for this job as a template
for configuring a new run of the same service;
· ‘Open in Manage/Share’: open the job details in the Manage / Share interface.
· ‘Terminate’ (for running jobs): allows to terminate the job execution manually,
before its automatic termination that would happen on job completion, failure or
timeout. In case of GUI applications, manual termination is useful in getting
Page 19Forestry TEP user manual v2019.03.28
access to any data that the user may have saved to the ‘outDir’ folder; these
outputs will only be available after the job termination.
When clicking on a job, a panel opens with the INPUTS, OUTPUTS and LOGS sections.
· INPUTS shows a concise list of the parameters that were used for this job.
· OUTPUTS lists any outputs that were produced. The user can download each
result, and in case of specific file types (GeoTiff in particular) also have the
output visualized on the map interface. Note that the intensity scaling may not
appear optimal, wherefore it is often favourable to instead open the file e.g. in
QGIS. This would be done by dragging the output file to the input data field
when preparing a QGIS job; in a similar fashion the output can be used as the
input of other services too.
· LOGS shows both the system logs and developer-specified output from the
execution of the processing job. Note that the logging data does not update in
real-time nor is it fully chronological, as the data is collected by a separate
platform component. Its primary purpose is to enable service developers to
debug the service.
3.5 Parallel processing
Some processor services are implemented in such a way as to permit configuration in
‘parallel’ mode. Whereas in a standard processor all input data products are passed to
one processing job, the parallel processing mode will configure one ‘sub-job’ per input
data product; all other input parameters remain constant.
When a parallel processing job is started, the user can see the “View subjobs’ icon in
the job field. By clicking this icon the user can see each individual ‘sub-job’ listed
separately and can access their information and functions. After the job is finished,
outputs of all parallel jobs can also be seen and accessed through the parent job.
The parallel processing can be enabled by activating the ‘Enable
Parallel Processing’ icon next to the parameter. If checked, this job
will execute in parallel mode. Each sub-job is discretely configured and can be inspected
individually, including accessing the individual sub-job output products. The parent job
provides a way to work with the aggregated output products of the sub-jobs.
Page 20Forestry TEP user manual v2019.03.28
Page 21Forestry TEP user manual v2019.03.28
4 Processing services
4.1 VegetationIndices
4.1.1 Service description
The measured reflectance in various parts of visible and infrared spectrum (i.e. in various
spectral bands of the MSI instrument aboard Sentinel-2 satellites) correlates to properties
of vegetation canopies. When applying ratios between spectral bands, indices with
correlation to canopy properties and photosynthetic capacity can be derived. Using band
ratios, the effects of potential inter-image variation caused (e.g. by atmospheric effects)
are reduced.
The most commonly used vegetation index is the Normalized Difference Vegetation
Index (NDVI), which correlates very strongly with the proportion covered by leaves when
the background is bare soil and when the proportion covered by leaves is not excessively
high. In addition to NDVI, several other vegetation indices have been developed. These
newer indices make modifications to counter-act effects of soil properties or atmospheric
effects.
The following vegetation indices can be calculated using the VegetationIndices service:
· NDVI, Normalized Difference Vegetation Index (NIR-Red)/(NIR+Red),
· TNDVI, Transformed Normalized Difference Vegetation Index (sqrt(NDVI + 0.5)),
· RVI, Ratio Vegetation Index (Red/NIR),
· SAVI, Soil Adjusted Vegetation Index (NDVI*(1+S), S = soil adjustment factor),
· TSAVI, Transformed Soil Adjusted Vegetation Index,
· MSAVI, Modified Soil Adjusted Vegetation Index,
· MSAVI2, Modified Soil Adjusted Vegetation Index 2,
· GEMI, Global Environment Monitoring Index, &
· IPVI, Infrared Percentage Vegetation Index.
4.1.2 Input data
The VegetationIndices service requires one or more Sentinel-2 L1C image. Note that
cloud-free images should be selected, as the service does not perform radiometric
corrections or cloud masking.
4.1.3 Parameters
Input data: The input Sentinel-2 image which has been previously defined. Drag the
input Sentinel-2 image (grabbing from the horizontal lines in front of its name) from the
Results tab at the bottom of the screen to the input field.
Vegetation Index: Using the drop-down list, select a vegetation index. Options include:
NDVI, TNDVI, RVI, SAVI, TSAVI, MSAVI, MSAVI2, GEMI, IPVI.
Target CRS identifier: This field defines the target coordinate reference system (CRS).
It must be a string beginning with 'EPSG:', appended by a numeric code that is a valid
system as defined by the European Petroleum Survey Group (EPSG). For UTM zones in
the northern hemisphere and with the WGS84 datum, the numeric code is 32600 + the
Page 22Forestry TEP user manual v2019.03.28
UTM zone number. An example of a valid CRS specification is EPSG:32615, where "6"
or "7" defines Northern/Southern hemisphere, and 15 represents the UTM zone.
Area of interest (AOI): An AOI to be processed is inserted here. This can be copied
from an area drawn on the map by pressing the ’Copy From Map’ icon. Alternatively, it
can be specified in the Well-Known Text (WKT) POLYGON format. An example of a valid
specification is: POLYGON((-92.906633 16.190411,-92.066559 16.188383,-92.070266
15.376645,-92.907004 15.378567,-92.906633 16.190411)). The AOI should be large
enough that it includes enough reference data for all target class.
Target Image Resolution: The requested output image pixel spacing (in metres) is
inserted here. For Sentinel-2 optical data, feasible values are between 10 and 100 m.
Example: 20
Label: OPTIONAL. Allows free form tagging for later identification of this processing job.
4.1.4 Usage
After all input fields have been filled in, the service is launched by clicking the round play
button at the bottom right corner of the input dialogue area. The resulting output can be
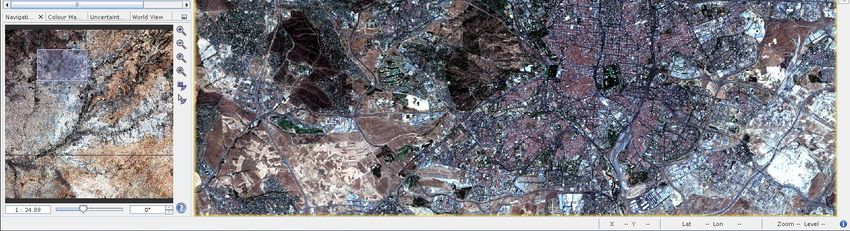
downloaded, re-used or displayed in one of the GUI applications, such as SNAP or
QGIS. Soon after the desired application process (e.g. QGIS) is started, a ‘Go to GUI’
icon appears in the job description. You can access the desired GUI application by
clicking this icon which opens the GUI in another browser tab.
The image below shows a generated TSAVI index map within SNAP.
Page 23Forestry TEP user manual v2019.03.28
4.2 ForestChangeS2
4.2.1 Service description
Forest clearance causes substantial changes in visible and near infrared reflectance.
This is evident when investigating the various spectral bands of Sentinel-2 satellite
images. Due to the reduction of photosynthetically active vegetation in logging
operations, especially if bare ground is exposed, red reflectance rises significantly. This
increase in red reflectance can be used as a simple indicator for potential forest
clearance. The ForestChangeS2 service produces the ratio of red reflectance between to
input images (i.e. “before” and “after” images). The service computes a red-reflectance
ratio layer, which can then be further analysed e.g. in the QGIS application service
together with other products (forest or land cover maps).
4.2.2 Input data
The service requires as its input data two Sentinel-2 L1C image tiles. The correct
Sentinel-2 data format can be recognized by file names that begin with “S2A_MSIL1C” or
“S2B_MSIL1C”. The images must cover the same area (i.e. the same Sentinel-2 tile).
Cloud masking is performed with the cloud masks included in the Sentinel-2 L1C
products. However, note that some clouds may have passed through the L1C cloud
masking procedure, causing errors in the change detection. This has to be taken into
account when interpreting the results. For the best results, both of the input images
should be completely cloud-free.
4.2.3 Parameters
Start product: The first input Sentinel-2 image, which has been acquired before the
assumed forest change. Drag the input Sentinel-2 image from a search results listing or
from databasket contents at the bottom of the screen, by grabbing from the horizontal
lines in front of its name.
End product: Select the second image in the same way and drag it here.
Target CRS identifier: This field is OPTIONAL. It defines the target coordinate reference
system (CRS). If left empty, the CRS of the input data is used as default. This must be a
string beginning with 'EPSG:', appended by a numeric code that is a valid system as
defined by the European Petroleum Survey Group (EPSG). For UTM zones in the
northern hemisphere and with the WGS84 datum, the numeric code is 32600 + the UTM
zone number. An example of a valid CRS specification is EPSG:32635, where "6" or "7"
defines Northern/Southern hemisphere, and 35 represents the UTM zone.
Area of interest: This field is OPTIONAL. It defines the area of interest (AOI) that the
output image is cropped to. Note that full Sentinel-2 tiles are processed regardless of this
setting. If left empty, an image covering the entire tile area is produced. The AOI can be
copied from the area drawn on the map by clicking the ’Copy From Map’ icon.
Alternatively, it can be specified in the Well-Known Text (WKT) POLYGON format. An
example of a valid specification is: POLYGON((-92.906633 16.190411,-92.066559
16.188383,-92.070266 15.376645,-92.907004 15.378567,-92.906633 16.190411)).
Target image resolution: This field is OPTIONAL. It specifies the desired image
resolution in metres, controlling resampling of the output image (pixel spacing). If left
Page 24Forestry TEP user manual v2019.03.28
empty, resolution of the input data (10) is used as default. For Sentinel-2 optical data,
feasible values are between 10 and 100 (meters).
Label: OPTIONAL. Allows free form tagging for later identification of this processing job.
4.2.4 Usage
After all input fields have been filled in, the service is launched by clicking the round play
button at the bottom right corner of the input dialogue area. The processing can typically
take 25 minutes. The resulting output is GeoTIFF file that can be downloaded, re-used or
displayed in one of the GUI applications, such as SNAP or QGIS. Soon after desired
application process (e.g. QGIS) is started, a ‘Go to GUI’ icon appears in the job
description. The desired GUI application can then accessed by clicking this icon, which
opens the GUI in another browser tab.
The image below shows the red ratio result opened in QGIS, with some potential
clearings visible (in white).
Page 25Forestry TEP user manual v2019.03.28
4.3 LandCoverS2
4.3.1 Service description
Land cover types (such as water, coniferous forest, or wheat field) reflect different
amount of incoming sun radiation in different parts of the electromagnetic spectrum. This
information can be used for land cover classification of satellite images. Many land cover
mapping or classification algorithms have been developed over the past decades.
The LandCoverS2 service uses a random forest algorithm as implemented in the Orfeo
toolbox (OTB). Based on samples of land cover classes, a set of decision trees are
produced. For each tree, a random set of spectral bands at each decision node is
chosen. The final land cover class is then chosen based on majority voting between the
output of each decision tree. The benefits of the random-forest algorithm include good
adaptation to many different types of classification problems as well as independence of
assumptions on statistical distribution of band-wise reflectance values within a (land-
cover) class.
4.3.2 Input data
The LandCoverS2 service is designed to work with the Sentinel-2 L1C tile data, which
can be recognized by file names that begin with “S2A_MSIL1C” or “S2B_MSIL1C”. It
supports the use of full 10 m resolution. The service requires the following input data:
1. Shapefile containing reference data for training the classifier
2. Sentinel-2 image
The reference data shape file must include polygons, each polygon covering area
belonging to just one land cover class. For each target class, the reference data must
include several hundred pixels in the used input data at the selected pixel size. The
reference data shape file – and all supporting files like the .dbf file, .prj file and the .shx
file - must be packaged into a single .zip file. The zip file must be uploaded to F-TEP
using the Files feature in the Manage/Share section, or alternatively placed in a web
location that is accessible via a public URL (Universal Resource Locator) or web
address.
The LandCoverS2 service does not pose strict requirements on the geographic
distribution of the reference data as long as there are enough reference polygons for
each class within the selected input image. The shape file can include e.g. 50 m by 50 m
squares in a regular grid pattern and interpreted in some satellite imagery, air photos or
maps. Or it can contain more freely selected polygons in places where the user knows
the land cover. A good reference dataset includes all within class variation of the land
cover classes. For instance, if land cover class “water” includes both clear water and
turbid water with sediment, the water class in the reference data should include samples
of both of these cases.
A simple reference data file can be made with GIS tools like QGIS or ArcGIS. Google
Earth Pro can also be used. Delineate the class-wise polygons with the polygon tool of
GoogleEarth Pro and write a numeric class code as a description of each polygon. Save
the folder containing these polygons (by right clicking on the folder name) as a .kml file.
Then convert the .kml file into a shape file using GIS tools like QGIS or the ogr2ogr utility,
which is part of the GDAL software package.
Page 26Forestry TEP user manual v2019.03.28
4.3.3 Parameters
Input Data: The name of the input file is inserted here. The file can be dragged from the
search results panel at the bottom of the screen to the ‘Input data’ field.
Reference data shapefile: The reference data shapefile to be used (i.e. a .zip package
file containing all the files belonging to the shapefile) is defined here.
If the reference data has been uploaded to the platform (using the ‘Files’ feature in the
‘Manage / Share’ interface), the file can be found by running a search on reference data.
After selection of the correct file in the search results, it can be dragged into the input
field in the workspace.
Alternatively, you can write in the reference data input field the URL of a reference data
(zip packaged shapefile) that you have available in a publicly available web location. An
example of a valid reference data address is http://enviobserver.vtt.fi/ftepref/F-
TEPchiapasLandCover.zip.
Reference data field: The field in the reference data shapefile that will be used to train
the classifer needs to be defined here. The name of the column (e.g. ‘tessellate’) is
inserted in this field. GIS tools (QGIS in this example) show the column names in an
attribute table.
Target CRS identifier: This field defines the target coordinate reference system (CRS).
It must be a string beginning with 'EPSG:', appended by a numeric code that is a valid
system as defined by the European Petroleum Survey Group (EPSG). For UTM zones in
the northern hemisphere and with the WGS84 datum, the numeric code is 32600 + the
UTM zone number. An example of a valid CRS specification is EPSG:32615, where "6"
or "7" defines Northern/Southern hemisphere, and 15 represents the UTM zone.
Area of interest (AOI): An AOI to be processed is inserted here. The AOI should be
large enough that it includes enough reference data for all target class. This can be
copied from an area drawn on the map by pressing the ’Copy From Map’ icon.
Alternatively, it can be specified in the Well-Known Text (WKT) POLYGON format. An
example of a valid specification is: POLYGON((-92.906633 16.190411,-92.066559
16.188383,-92.070266 15.376645,-92.907004 15.378567,-92.906633 16.190411)).
Target Image Resolution: The requested output image pixel spacing (in metres) is
inserted here. For Sentinel-2 optical data, feasible values are between 10 and 100 m.
Example: 20
Label: OPTIONAL. Allows free form tagging for later identification of this processing job.
Page 27Forestry TEP user manual v2019.03.28
4.3.4 Usage
After all input fields have been filled in, the service is launched by clicking the round play
button at the bottom right corner of the input dialogue area. The resulting output can be
downloaded, re-used or displayed in one of the GUI applications such as SNAP or QGIS.
Soon after the desired application process (e.g. QGIS) is started, a ‘Go to GUI’ icon
appears in the job description. You can access the desired GUI application by clicking
this icon which opens the GUI in another browser tab.
The image below shows a generated land cover map within QGIS.
Page 28Forestry TEP user manual v2019.03.28
4.4 LandCoverS1
4.4.1 Service description
Persistently cloudy weather conditions complicate land cover mapping in many areas
(e.g. in the humid tropics). Sentinel-1 C-band radar data penetrates cloud cover and
allows regular observation even in areas with persistent cloud cover. The LandCoverS1
service allows land cover mapping into a few general land cover classes with Sentinel-1
time series.
Image time series (instead of a single image) allows utilization of the differences in
variation of backscatter over time in various land cover types. For instance, mature forest
has a very stable backscatter level while many agricultural areas show distinct variations
depending on the crop type and crop calendar. When combining acquisitions from
different parts of the year, these variations can be used to map land cover types. VV-
polarized Sentinel-1 data are used in this algorithm because this is the most widely
acquired data type globally (present in both dual and single-polarized scenes).
The service uses a random forest algorithm as implemented in the Orfeo toolbox (OTB).
Based on samples of land cover classes, a set of decision trees is produced. For each
tree, a random set of spectral bands at each decision node is chosen. The final land
cover class is then chosen based on majority voting between the output of each decision
tree. The benefits of the random-forest algorithm include good adaptation to many
different types of classification problems as well as independence of assumptions on
statistical distribution of band-wise backscatter values within a (land-cover) class. The
latter property is important for radar data since the distribution of radar backscatter data
tends to differ from normal distribution.
4.4.2 Input data
The service requires the following input data:
1. Shapefile containing reference data for training the classifier
2. Time series of Sentinel-1 VV-polarised (SVV) images or a collection of Sentinel-1
VV-polarised images collected in a databasket
The reference data shape file must include polygons, each polygon covering an area that
belongs to just one land cover class. For each target class, the reference data should
include several hundred pixels in the used input data at the selected pixel size. The
reference data shape file – and all supporting files like the .dbf file, .prj file and the .shx
file - must be packaged into a single .zip file. The zip file must be uploaded to F-TEP
using the ‘Files’ feature in the Manage/Share section, or alternatively placed in a web
location that is accessible via a public URL (Universal Resource Locator) or web
address. The LandCoverS2 service description shows a way to produce an acceptable
shape file using freely available Google Earth Pro software.
4.4.3 Parameters
Input Data: The most convenient way is to collect the input Sentinel-1 images (GRD
products) into a databasket, which is then dragged to ‘Input data’ field. In case of just one
Sentinel-1 input image, it can be dragged from the search results into the ‘Input data’
field.
Page 29Forestry TEP user manual v2019.03.28
Reference data file: Here, the reference data (i.e. a .zip package file containing all the
files belonging to the shapefile) need to be identified.
If the reference data has been uploaded to the platform, the file can be found by running
a search on reference data. After selection of the correct file in the search results, it can
be dragged into the input field in the workspace.
Alternatively, you can write in the reference data input field the URL of a reference data
(zip packaged shapefile) that you have available in a publicly available web location. An
example of a valid reference data address is http://enviobserver.vtt.fi/ftepref/F-
TEPchiapasLandCover.zip.
Reference data field: The field in the reference data shapefile that will be used to train
the classifier needs to be defined here. The name of the column (e.g. “tessellate”) is
inserted in this field.
Target CRS identifier: This field defines the target coordinate reference system (CRS).
It must be a string beginning with 'EPSG:', appended by a numeric code that is a valid
system as defined by the European Petroleum Survey Group (EPSG). For UTM zones in
the northern hemisphere and with the WGS84 datum, the numeric code is 32600 + the
UTM zone number. An example of a valid CRS specification is EPSG:32615, where "6"
or "7" defines Northern/Southern hemisphere, and 15 represents the UTM zone.
Area of interest (AOI): An AOI to be processed is inserted here. The AOI should be
large enough that it includes enough reference data for all target class. This can be
copied from an area drawn on the map by pressing the ’Copy From Map’ icon.
Alternatively, it can be specified in the Well-Known Text (WKT) POLYGON format. An
example of a valid specification is: POLYGON((-92.906633 16.190411,-92.066559
16.188383,-92.070266 15.376645,-92.907004 15.378567,-92.906633 16.190411)).
Digital elevation model: A DEM is needed for ortho-rectification and terrain correction of
Sentinel-1 radar images. The identification string for the SNAP software (where the
corrections are run) is inserted here. The default is “SRTM 1Sec HGT”, which is valid
between -60 and 60 latitudes. The SRTM DEM is downloaded automatically by SNAP. If
an external DEM is used, it must be in GeoTiff format, its projection must be plate carre
(latitude-longitude), and its elevation unit must be 1 metre.
Target Image Resolution: The requested output image pixel spacing (in metres) is
inserted here. For Sentinel-1 radar data, feasible values are between 20 and 100 m.
Example: 20
Label: OPTIONAL. Allows free form tagging for later identification of this processing job.
4.4.4 Usage
After all input fields have been filled in, the service is launched by clicking the round play
button at the bottom right corner of the input dialogue area. The resulting output can be
downloaded, re-used or displayed in one of the GUI applications, such as SNAP or
QGIS. Soon after the desired application process (e.g. QGIS) is started, a ‘Go to GUI’
icon appears in the job description. You can access the desired GUI application by
clicking this icon which opens the GUI in another browser tab.
Page 30Forestry TEP user manual v2019.03.28
The image below shows a generated (with four images covering the AOI variably) land
cover map within QGIS. A longer time-series covering the whole area of interest is
needed for a good land cover map.
Page 31Forestry TEP user manual v2019.03.28
4.5 LandCoverGeotiff
4.5.1 Service description
The LandCoverGeotiff service makes land cover classification using a random forest
classifier as implemented in the Orfeo toolbox. The service requires training data in the
form of a shape file. The used earth observation data is not limited to any specific sensor.
The input geotiff file can be from any satellite sensor or even a combination of several
sensors.
4.5.2 Input data
The service requires an input geotiff image file which can be from any satellite sensor.
4.5.3 Parameters
Input Data: The name of the input geotiff file is inserted here. The file can be dragged
from the search results panel at the bottom of the screen to the ‘Input data’ field.
Typically the input data is taken from reference data if the user has uploaded an external
geotiff file or from the F-TEP results if e.g. the user wants to use a multi-temporal stack of
Sentinel-1 data or some mosaic of Sentinel-2 data.
Reference data shapefile: The reference data shapefile to be used (i.e. a .zip package
file containing all the files belonging to the shapefile) is defined here.
If the reference data has been uploaded to the platform (using the ‘Files’ feature in the
‘Manage / Share’ interface), the file can be found by running a search on reference data.
After selection of the correct file in the search results, it can be dragged into the input
field in the workspace.
Alternatively, you can write in the reference data input field the URL of a reference data
(zip packaged shapefile) that you have available in a publicly available web location. An
example of a valid reference data address is http://enviobserver.vtt.fi/ftepref/F-
TEPchiapasLandCover.zip.
Reference data field: The field in the reference data shapefile that will be used to train
the classifer needs to be defined here. The name of the column (e.g. ‘tessellate’) is
inserted in this field. GIS tools show the column names in an attribute table.
Target CRS identifier: This field defines the target coordinate reference system (CRS).
It must be a string beginning with 'EPSG:', appended by a numeric code that is a valid
system as defined by the European Petroleum Survey Group (EPSG). For UTM zones in
the northern hemisphere and with the WGS84 datum, the numeric code is 32600 + the
UTM zone number. An example of a valid CRS specification is EPSG:32615, where "6"
or "7" defines Northern/Southern hemisphere, and 15 represents the UTM zone.
Area of interest (AOI): An AOI to be processed is inserted here. The AOI should be
large enough that it includes enough reference data for all target class. This can be
copied from an area drawn on the map by pressing the ’Copy From Map’ icon.
Alternatively, it can be specified in the Well-Known Text (WKT) POLYGON format. An
example of a valid specification is: POLYGON((-92.906633 16.190411,-92.066559
16.188383,-92.070266 15.376645,-92.907004 15.378567,-92.906633 16.190411)).
Page 32You can also read