Quality evaluation of government open data sets in Argentina using the HEVDA Validation Tool
←
→
Page content transcription
If your browser does not render page correctly, please read the page content below
JOURNAL OF SCIENCE AND RESEARCH                                              E-ISSN: 2528-8083

      Quality evaluation of government open data sets in
           Argentina using the HEVDA Validation Tool
            Evaluación de la calidad de los conjuntos de datos abiertos
    gubernamentales en Argentina utilizando la herramienta de validación
                                               HEVDA
                             https://doi.org/10.5281/zenodo.5517707

AUTORES: Roxana Martínez1*

                 Claudia Pons2

                 Rocío Rodríguez3

                 Pablo Vela4

DIRECCIÓN PARA CORRESPONDENCIA: ing.roxana.martinez@gmail.com

Fecha de recepción: 05 / 01 / 2021
Fecha de aceptación: 25 / 03 / 2021
ABSTRACT
This work consists of measuring the quality of the datasets available on the web portal of
the official public and national site of the country of Argentina. This research proposes to
carry out a quality study applying the Open Data Quality Validation Tool (HEVDA), this
tool implements quality metrics that measure the selected dataset, which results in an
analysis of the flaws detected in it; for example, it allows detecting if there are errors,
incomplete records, types of redundancy, etc. To explain the framing of this work, a survey
of the aspects that are involved in this context is shown: open government, open public
data, as well as government transparency. On the other hand, it shows the importance of
maintaining the quality of the shared data, since it will be reused in different data sources
and software, so this research focuses on the necessary aspects that favor the reading and

1
  Magister en Tecnología Informática, Interamerican Open University (UAI).
2
  Doctor en Ciencias Informáticas, Interamerican Open University (UAI).
3
  Doctor en Ciencias Informáticas, Interamerican Open University (UAI).
4
  Doctor en Ciencias Informáticas, Interamerican Open University (UAI).
                                  Vol. 6, N°. 2, Abril – Junio 2021

                                                   161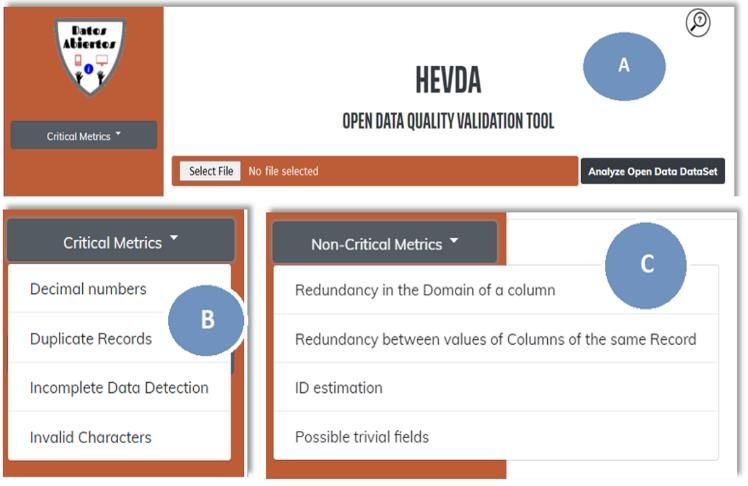
JOURNAL OF SCIENCE AND RESEARCH                                            E-ISSN: 2528-8083

understanding of the data sets published on government portals, which allows generating
public opinion and showing traceability of the management of government resources.
Keywords: Open Data, Public Data, Quality in datasets, Open Government.

RESUMEN
Este trabajo consiste en medir la calidad de los conjuntos de datos disponibles en el portal
web del sitio público oficial y nacional del país de Argentina. Esta investigación propone
realizar un estudio de calidad aplicando la Herramienta de Validación de Calidad de Datos
Abiertos (HEVDA), esta herramienta implementa métricas de calidad que miden el
conjunto de datos seleccionado, lo que da como resultado un análisis de las fallas
detectadas en el mismo, por ejemplo, permite detectar si existen errores, registros
incompletos, tipos de redundancia, etc. Para explicar el encuadre de este trabajo, se muestra
un relevamiento de los aspectos que están involucrados en este contexto: gobierno abierto,
datos públicos abiertos, así como transparencia gubernamental. Por otro lado, muestra la
importancia de mantener la calidad de los datos compartidos, ya que serán reutilizados en
diferentes fuentes de datos y software, por lo que esta investigación se centra en los
aspectos necesarios que favorecen la lectura y comprensión de los conjuntos de datos.
publicados en portales gubernamentales, lo que permite generar opinión pública y mostrar
la trazabilidad de la gestión de los recursos gubernamentales.
Palabras clave: datos abiertos, datos públicos, calidad en datasets, gobierno abierto

INTRODUCCIÓN
In the governmental sphere, the concept of the open government paradigm is booming. This
topic includes the importance of different initiatives that are focused on a better relationship
between citizens and the national State. Its main objective is that there are different means
available to encourage citizen participation and thus, the different actions of the
government are reflected to explain clearly and transparently.
       Some authors define open government as “a public policy that groups together the
concepts of transparency, participation, and collaboration of citizens in public policies
where government information and data play an essential role” (Cobo, 2020). Others
mention a government that “proposes a new form of public management in which alliances
                              Vol. 6, N°. 2, Abril – Junio 2021

                                              162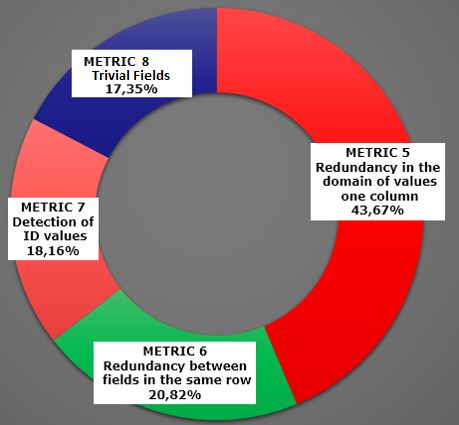
JOURNAL OF SCIENCE AND RESEARCH                                          E-ISSN: 2528-8083

are created between citizens and governments at all levels to achieve the best results.
Furthermore, it includes promises associated with the development of TIC (Technology of
the information and communication), and within these, it projects changes in the
relationships between social actors, such as the interaction between governments and
citizens, especially from its participatory dimension” (Chaves, 2020). An interesting
approach that some authors do is that Open Government “should not be conceived only as
an element to promote government transparency, accountability, and public trust, but also
as a dynamic mechanism that is useful to generate economic and social value in the public
and private sectors” (OCDE, 2015).
The Open Government had an important growth in recent years, which led several
organizations to dedicate themselves to promoting this new political model. One of the
most recognized organizations worldwide is the Open Government Partnership (OGP,
2021), which works to promote a government that is more accessible, responsive, and
responsible to citizens, and thus improve the relationship between people and their
government, as this brings exponential long-term benefits for everyone. This movement is
linked to the new framework of public governance and a renewed state methodology, so
within this context, the open government constitutes a frame of reference to align the
compliance of the Objectives of the 2030 Agenda (Naciones Unidas, 2020). These
Sustainable Development Objectives were proposed to provide different government
targets to put an end to poverty, protect the planet, and improve the lives and prospects of
people around the world. “Given the recent progress made by the 15 countries in the region
that are currently part of the Open Government Partnership, it seems important to move
towards the idea of an open State, that is, towards an institutional effort to promote and
articulate policies and strategies in matters of transparency, access to information and open
data, accountability, citizen participation and civic collaboration and innovation beyond the
executive branch, towards the legislative and judicial branches, as well as towards the sub-
national and local levels of government” (Naser, 2017). Although this open movement has
been debated since 1970, the concept spread in 2009 when the President of the United
States, Barack Obama, formulated the Memorandum on Transparency and Open
Government (White House, 2009).

                             Vol. 6, N°. 2, Abril – Junio 2021

                                             163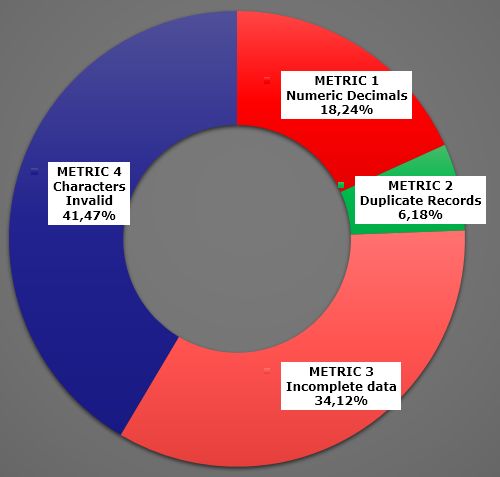
JOURNAL OF SCIENCE AND RESEARCH                                          E-ISSN: 2528-8083

The new paradigm point of view allows a transparent government to make information
about its actions and plans available to citizens immediately, easily and free of charge. “By
expanding access to public information, accountability is strengthened, and public debate is
enriched while creating new opportunities to generate added value” (Buenos Aires
provincia, 2017). Transparency within the context of Open Government consists of
ensuring the right of all citizens, which is free access to public government information. In
this way, a government can show, simply and clearly, the management performed, and thus
promote active management.
Transparency can be of two types: passive or active, this depends on whether the
information is requested on demand by a citizen or organization (Passive), or if the State
makes it publicly available (Active).
Active Transparency: Active transparency is a concept in which the different public
organizations must give access to information and have the responsibility to provide all this
data through their institutional website, that is, periodically publish and spread relevant
information in an accessible and open format.
Passive transparency: Passive transparency is associated with the right of access to
information by citizens. This implies the guarantee of the right of access to information that
all people have, as stipulated in the Universal Declaration of Human Rights (art. 19)
(Naciones Unidas, 2021) and the International Covenant on Civil and Political Rights (art.
19, 2) (Humanos, 1976). It proposes an institutional means for citizens to request the
information produced by the State.
This work is about active transparency.
Following next, the works related to this framework of investigation with the most relevant
aspects of the open data quality are shown based on an analysis performed. Then, the
proposal of the developed prototype is described, with an explanation of each metric and its
relationship with the software. Afterward, the results obtained in the already stated research
are presented, with the comparative analysis of aspects worked. Finally, the conclusions
and future works are presented.
METHODOLOGY
Background Information

                              Vol. 6, N°. 2, Abril – Junio 2021

                                             164
JOURNAL OF SCIENCE AND RESEARCH E-ISSN: 2528-8083
Tim Berners-Lee (5stardata.info, 2012) developed a 5-star model, in which he suggested a
development scheme for the treatment and publication of Open Data. This considers in
mind the format and structure of the data. Organizations such as Open Data Institute (ODI),
present tools, Open Data Certificate (Certificate, 2021), which works based on existing
standards and provides a simple evaluation of how well the data accomplish the best
practices, to evaluate and recognize the sustainable publication of quality open data. Its
objectives point to the legal, practical, technical and social aspects of open data publishing,
providing data publishers with a best practice guide for optimal reuse of open data.
Various governments and organizations that encourage/promote the Open Government
(MinTIC, 2020) (Support, Open Data, 2020) (Datos.gob.es, 2020), published guides of
good practices to use of government public data, to promote the use of datasets and, in
addition, have in mind some quality criteria of the quantitative type, such as applications to
data opening, number of state organizations that open data, percentage of the strategic open
data set that were published, number of data sets downloaded versus the number of
published datasets or the number of datasets visited versus downloaded datasets. Other
works point to the quality criteria oriented to interoperability, to provide guidance and good
practices for the development of data opening strategies that comply with the main quality
standards and open data interoperability of the best-qualified countries in international
indexes such as the Open Data Barometer, the Global Open Data Index and Our Data
Index. Moreover, in the information domain guides of the Frame of Reference of the
Ministry of Information and Communications Technologies (MinTIC), the ISO 25012 data
quality model, the Open Data International Charter, and the Interoperability Frame for the
Digital Government (Gobierno de Colombia, 2020).
Regarding quality, there are works (Oviedo Blanco, 2016), (Beltrán, 2017), (Ibanez
Gonzalez, 2019), (Rodríguez Rojas, 2017), (Arizo, 2016) that focus on establishing criteria
and classifications of quality levels of open data. Some analysis scenarios are oriented from
the reuse of open and public data. On the other hand, some quality measurement techniques
are based on the concept of the availability of data in open portals, to promote an adequate
level of availability for their consumers. Besides, mechanisms are defined to evaluate the
maturity of an open portal, through metrics to measure quality, such as, for example,
traceability, completeness, and conformity. Other works (Abella, 2018) guide the
Vol. 6, N°. 2, Abril – Junio 2021
165JOURNAL OF SCIENCE AND RESEARCH E-ISSN: 2528-8083
evaluation of quality in the analysis of the Berners-Lee five-star model and other factors
that help to evaluate reuse. In addition, they propose that the relationship between the
demand for open data and the dispersion of distributions and data sets available on a certain
topic can be analyzed. Therefore, it is interesting to study the result of whether to
concentrate the information in few more complete and manageable data sets could help to
improve the efficiency in the publication of these.
Other more recent authors (Cadena-Vela, 2019), (Vela, 2019), (Leonangeli, 2019) present
an analysis of the current status in the field of open data, as well as international standards
and good data quality practices to propose a reference framework that enables the
publication of open data with an appropriate level of quality. Other works that are still
under research (Barrera, 2020), are oriented to quality, through the analysis of the
information published in the geoportals, to measure the degree of reuse of their geospatial
data sets, that is, because there are no specific standards of quality analysis. In addition,
other studies (Royo-Montañés, 2019) indicate that most portals seem to function as mere
data repositories, neglecting those aspects that promote the use of data by the non-expert
public, for example, the definition of the metadata used. Other authors (Schieferdecker,
2012) focus on the quality of open data based on the context that software presents, for
example, treatment of different types of data in software.
Research Framework
At present, there are many open data portals in different countries of the world, that is why
having various guides that orientate the constant improvement of quality is essential, but,
moreover, it is vital to have tools that allow rapid validation to facilitate the detection of
shortcomings or issues related to integrity, redundancy, among others, as explained in the
previous section.
Having quality open public data available will allow citizens and organizations to have
greater trust in data sources and monitoring of administrative processes of the State, as well
as structuring and standardizing them for different interactions with each other, for
example, software interoperability.
Based on the analysis made, this work proposes a software tool that allows knowing the
quality of a dataset through the calculation of quality metrics proposed in the application.
This developed tool is called HEVDA (Spanish acronym for HErramienta de Validación de
Vol. 6, N°. 2, Abril – Junio 2021
166JOURNAL OF SCIENCE AND RESEARCH E-ISSN: 2528-8083
calidad de Datos Abiertos. i.e., Open Data Quality Validation Tool). The HEVDA tool
shows a quantitative quality result of the open data analyzed with it.
For the data sample, the 5 most relevant government open data portals of the Argentine
Republic were considered. For each portal, 25% of the total amount of datasets made
available was taken as a sample. That is, for a case that has a total of 41 datasets, its 25%
was taken, this being 10 datasets as a sample for this study and so on with each government
website.
In the following sections, the results obtained from the completed research are presented
and analyzed.
HEVDA
Technical Aspects: The developed tool allows the validation of the different suggested
metrics for a set of open data in CSV formats (Comma Separated Variable). Although
HEVDA allows an automatic analysis to be obtained, it does not modify the source dataset,
but rather provides a detailed analysis that serves as a practical guide for correcting it.
Some technical aspects are:
Integrated Development Environment (IDE), Visual Studio Community 2019 (Microsoft,
2021), is a complete tool for programming, debugging, testing, and implementing solutions
on any platform. Another reason for which it was selected is that it has a friendly
programming environment, and, in addition, its community version is free. On the other
hand, there are forums at the platform's technical support level and backing material.
Regarding the programming language, C # was used, which is the object-oriented
programming language, with ASP .NET, which is the framework provided by Microsoft for
web development. Specifically, C # was used together with ASP .NET for the server-side
coding, and HTML, CSS, JS for the client-side. As a web server, IIS (Internet Information
Services) version 10.0.19041.1 was used.
Functional Aspects: The general functionality of the software consists of selecting a dataset
file of the CSV format type and executing the validation of the proposed metrics. For the
choice of the type of format, studies were taken into account (Martínez, 2020), in which the
government portal Argentina Unida (Argentina Unida, 2021) was taken as a sample case
with its 973 datasets till July 2020. Their results concluded that the most used format is the
Vol. 6, N°. 2, Abril – Junio 2021
167JOURNAL OF SCIENCE AND RESEARCH E-ISSN: 2528-8083
CSV type with 61.6% of use, it is for this reason that the HEVDA tool works with the CSV
type format.
The detailed functionalities of the programmed tool are:
Detection and detail of cases that do not comply with the valid format for the decimal data
type.
Estimated calculation of the data types of the validated dataset fields.
Calculation of the quantity and percentage of duplicate records.
Detail of duplicate records.
Calculation of the quantity and percentage of the complete records.
Calculation of the number of cases that have fields with Null records (No Data or spaces in
the fields).
Calculation of the number of cases that have fields with empty records (Without Data and
with spaces in the fields).
Calculation of the number of cases that have fields with Unavailable records (With data
indicating N/D, N/A, NULL, -, - -, -).
Displaying the details of the cases with Null, Empty, and Unavailable records.
Calculation of the number of columns affected with special characters and their
corresponding detail.
Calculation of the number of columns affected with repeated values in the same field
(domain of values).
Detail with search filters for the dataset fields and words of the detected fields in cases
where there were records with repeated values for the same field (domain of values).
Calculation of the quantity and percentage of cases detected with redundancy between the
values of the fields for the same record.
Search filter for the cases detected with redundant data between the values of the fields for
the same record and its corresponding detail.
Estimation of the number of IDs identified in the columns of the dataset, and their
visualization.
Calculation of the number of columns affected with possible trivial fields and their
identification.
Vol. 6, N°. 2, Abril – Junio 2021
168JOURNAL OF SCIENCE AND RESEARCH E-ISSN: 2528-8083
In Figure 1 sector A, the initial HEVDA screen is shown, containing the file selection
option and a button “Analyze Open Data Dataset” to start the validation. On the other hand,
there is a vertical bar on the left with the categories of metrics, critical and non-critical,
which can be displayed with a click to access their corresponding established metrics. This
is shown in Figure 1 sector B for critical metrics and Figure 1 sector C for non-critical
metrics.
Once the file that has to be analyzed is selected, the tool will display a report for each one
of the metrics.
Implemented metrics
Metric 1 - Treatment of decimal numbers: It indicates the number of cases that are detected
for the validation of the type of decimal numbers.
For example, “There are 3 cases with decimal numbers incorrectly loaded or incorrect
decimal separator with, (comma)”. In addition, a link “click to see details of records” is
available, which visualize the cases affected. Subsequently and in a complementary way, an
estimation analysis is shown that the tool calculates, to detect the calculation of the data
types of the fields of the analyzed data set; This is visualized through a grid that contains:
the names of the titles of the columns of the dataset, and the types of data detected
(according to the internal algorithm proposed in the HEVDA tool). The basis for adopting
this metric and its contribution to the measurement of quality in the treatment of
interoperability between software, which is why it is necessary to identify the type of data
for a correct exchange of data between various programs.
Figure 1. HEVDA Tool Home Screen.
Vol. 6, N°. 2, Abril – Junio 2021
169JOURNAL OF SCIENCE AND RESEARCH E-ISSN: 2528-8083
Metric 2 - Duplicate Records: It indicates the number of cases detected with duplication of
records, showing the amount affected over the total records of the dataset. For example:
“Number of cases detected with duplication of records: 11 of 1400”. Based on that, the
percentage of duplicate records affected is presented, being: “Percentage of duplicate
records: 0.79%”. In addition, there is the option to view the detail of the records.
The basis for adopting this metric and its contribution to the measurement of quality is that
detecting cases of duplication of records favors better use and analysis of the data. Data
without redundancy allows defining data structures and providing simplicity in the
treatment of the different processes that use them, for example, Extraction, Transformation,
and Loading, ETL (Extract, Transform and Load) processes for adequate data management
with multiple sources.
It is important to focus on the fact that “duplicate elements within a sampling frame have
undesirable effects, such as an overestimation of population totals, or the generation of
biased samples to carry out new studies” (Alba Cuellar, 2011). It is for this reason that their
identification is necessary on time.
Metric 3 - Incomplete and Complete Data: It shows the number of complete and incomplete
records and their corresponding percentage. On the other hand, a data grid as a summary is
observed, with the 3 proposed classifications discriminated by dataset columns: Null,
Empty, and Not available.
For example: “The Null classification has a quantity of X cases, registered for the column
“province_id”; For the Empty classification, a case is indicated for the column “country”;
For the classification of Not available: the cases with data indicating “N/D”, “N/A”,
“NULL”, “-”, “- -” or “--” are considered.
The basis for adopting this metric and its contribution to the measurement of quality is that
the lack of values in the dataset fields provides a fine line to confusion and/or
misinterpretation of cases since many of these open data are used in dynamic tables,
statistical algorithms, open data histories (DATA, 2021), graphical visualizations or
software developments. Like the case detection metric for Duplicate Records in the
previous section, for the analysis of this metric, quantitative data quality measures are
considered.
Vol. 6, N°. 2, Abril – Junio 2021
170JOURNAL OF SCIENCE AND RESEARCH E-ISSN: 2528-8083
For this approach that guarantees quality in data, the aspect of dimensions is oriented to the
concept of Completeness. “The level of data completeness reflects the degree to which all
the attributes of a piece of data are present, which allows a clear vision of the integrity of
the elements to be studied” (Everywhere, 2021).
Metric 4 - Invalid Characters: This proposed metric allows for the identification of the
special characters of the analyzed data set. It could include the affected character, and the
record number of the dataset, as well as the name of the column/field in which it appears.
The basis for adopting this metric and its contribution to the measurement of quality is that
it is important to locate these types of characters in order not to alter the identification and
analysis of the values contained in the data sets. The great problem that entails that the data
is presented with invalid characters, will suppose a loss of information and, consequently, a
loss of objectivity of what is being analyzed as a result.
Metric 5 - Redundancy for the domain of a column: It consists of the redundancy
measurement in the domain of values of a column. That is, it is the number of times that the
same value of a field is repeated in each row for the same column.
For example, for the name of the column "country" of a dataset, the data "Argentina" is
found 5 times.
The tool displays the number of detected columns that have repetition in their data is
displayed. The basis for adopting this metric and its contribution to the measurement of
quality is that within the quality standards, recommended by the government site of open
data of the Argentine Republic (Datos P. d., 2021), it is suggested that the entities that
appear among the data of a textual field must have a unique description. Therefore, the
importance of detecting cases of equal values, to know if they are well aggregated or should
be modified so that they comply with the same description. Therefore, it is suggested that
every mention made of a given entity should be made using the same character string each
time (datos.gob.ar, 2021).
Metric 6 - Redundancy between fields of the same row: This proposed metric allows
identifying the number of cases with fields that have equal values (repeated / redundant) for
the same record of the analyzed dataset.
The basis for adopting this metric and its contribution to the measurement of quality is that
there is an elementary principal for data quality, which is not to repeat the same values in
Vol. 6, N°. 2, Abril – Junio 2021
171JOURNAL OF SCIENCE AND RESEARCH E-ISSN: 2528-8083
more than one column for the same row in the dataset. That is, each column provided in the
data set must be well defined and described since it represents a specific value in the logical
and representative analysis of the data in open format.
“One of the operations that any database developer faces most frequently is the detection
and treatment of duplicate data, that is, finding several times the same records in a table,
due to problems in the design and inconsistencies of the database or to locate certain
subsets of data with conditions that are repeated within the same table” (brujo, 2015). To
improve data quality, it is necessary to eliminate redundant or repetitive information.
Duplication of data can lead to mistakes or logical errors in the final analysis that can be the
consequence of not having an integrated approach in the dataset logic.
Metric 7 - ID detection: This aspect analyses the estimation of fields with ID, detecting the
fields that contain 'id', 'id_' and/or '_id', as much in uppercase as in lowercase letters. For
example: “We have found 5 columns that represent ID (country_id; id; province_id;
category_id; Certifier_id)”.
The basis for adopting this metric and its contribution to the measurement of quality is that
the fields that contain "ID" in their descriptions are used with numeric values and represent
a code or unique value of integers that is not null, and, in addition, they are implemented to
uniquely identify each of the rows in the data set. It is necessary to quantify the number of
fields for this type, since, although they are identifiers, citizens and/or organizations that
access this data set may not interpret the meaning of the numerical code that is shown, that
is, in many cases, the datasets are part of an analysis of various statistical studies, which fail
to detect the meaning and/or usefulness of the traditional nomenclature of ID codes. This
would be solved if the corresponding data dictionary is attached to the official site from
which the dataset was extracted, to understand the fields of the dataset, and, above all, the
meaning of these ID fields.
Although open datasets must contain well-defined, organized, and justified data, as a good
practice, the government site of open data of the Argentine Republic (Argentina Unida,
2021), suggests the use of an identifier field in the dataset, because “it is usually useful for
the univocal identification of variables in some systems or applications, but not in most
cases” (Modernización, 2019). It should be clarified that not all data sets have ID fields,
this is optional.
Vol. 6, N°. 2, Abril – Junio 2021
172JOURNAL OF SCIENCE AND RESEARCH E-ISSN: 2528-8083
Metric 8 - Trivial fields: consists of the verification of redundant fields for the same column
in all its records. To do this, the number of columns affected is displayed over the total
number of columns in the dataset.
For example: Field: country_id, Value of the field: 32, and Field: country; Value of the
field: ARGENTINA.
That is, for the field “country_id”, the value “32” was found, and for the field “country”,
the value “ARGENTINA” was detected in all its data.
The basis for adopting this metric and its contribution to the measurement of quality is that
a duplicate record occurs when the same data has been entered more than once, so it is
important to detect that some fields/columns have the same data. The discovery of these
cases will allow knowing if there are fields that can be omitted in the dataset, since these
could be indicated as data in the name of the dataset.
For example: if a country = Argentina field is detected in all the records, then the dataset
should contain "Argentina" in its name, where: Dataset called “Registered cases of Covid-
19”, could be called “Registered cases of Covid-19 in Argentina”.
In the next section, the scope of the sample used for the study of the datasets verified with
the HEVDA tool is presented.
Data Collection
The first step was to select the open data sets to be validated with HEVDA. For this, the 5
most relevant Argentine governmental open data portals were taken as a sample: Open Data
Portal of the Argentine Republic (Argentina Unida, 2021), Open Data Portal of the
Ministry of Health of Argentina (Datos D. A., 2021), Open Data Portal of the Chamber of
Deputies of Argentina (Diputados, 2021), Open Data Portal of the Ministry of Justice and
Human Rights of Argentina (Datos P. d., 2021), and Open Data Portal of the City of
Buenos Aires (Buenos Aires Ciudad, 2021).
It should be clarified that the choice of these government portals is due to the fact that they
are the ones with the largest number of datasets in Argentina and, in turn, are the most
relevant.
For each portal, the Categories were identified, and for each one of these, the datasets were
downloaded in the open format of the CSV type to be validated with the HEVDA tool.
From each portal, 25% of its total datasets were considered as a sample.
Vol. 6, N°. 2, Abril – Junio 2021
173JOURNAL OF SCIENCE AND RESEARCH E-ISSN: 2528-8083
Table 1 shows the number of datasets from each of the government portals and their
corresponding 25% as a sample taken for validation.
To identify the 25% of the sample, in case of having a result with a greater decimal
part equal to 0.5, an additional dataset is taken. For example:
From an open data portal that has 61 datasets in total, its 25% sample is 15.25, so 15
datasets were considered. So that the choice of the 15 datasets is random, it was considered
to take a uniform quantity per category.
Table 1. Number of datasets for each of the government portals.
TOTAL 25% of total
Open Data Portal (released until January 13, 2021) datasets to datasets
release (quantity)
Ministry of Health of Argentina (Datos D. A., 2021); 41 10
Chamber of Deputies of Argentina (Diputados, 2021); 29 7
Ministry of Justice and Human Rights of Argentina (Datos P. 61 15
d., 2021);
City of Buenos Aires (Buenos Aires Ciudad, 2021) 398 99
Argentine Republic (Argentina Unida, 2021); 1013 253
Total amount of datasets 384
If the public data portal has 10 Categories, a dataset of each Topic will be taken into
consideration, plus 1 extra dataset of 5 Topics in order to consider the 15 datasets as a
sample.
Another possibility that is presented is having to take, for example, 5 datasets from
each Group, but there is a Group that has only 2 datasets, so more datasets were selected
from the following groups (according to the order of appearance in the portal) for cover the
sample.
As shown in Table 1, the 25% sample resulted in analyzing a total number of 384 datasets.
RESULTS
This section shows all the results obtained for the tests of the 384 datasets validated
with the HEVDA tool. The analysis of results is presented in different classifications based
on general results, results discriminated by critical and non-critical metrics, and types of
blockers.
Structural analysis
Vol. 6, N°. 2, Abril – Junio 2021
174JOURNAL OF SCIENCE AND RESEARCH E-ISSN: 2528-8083
The datasets that have some blocking characteristics are discarded from the analysis
due to the belonging of some type of structural non-compliance aspect for which they
cannot be treated by the tool.
The cases are identified below:
The file has a double character “(quotation mark).
The file does not meet the same number of columns in each of its records.
The file does not comply with the CSV format of the separator (comma).
The file does not have the first row of titles/names of the columns of the dataset.
The file has repeating title names.
For this study, the total number of blocking datasets is 113, representing 29%, and
the number of non-blocking datasets is 271, representing 71% of the total of 384 datasets
validated with the application developed. Therefore, it can be suggested to detect these
cases when preparing a dataset to avoid future issues in the interoperability of public
government datasets.
Table 2 shows the percentage established for each type of blocker among the 113
datasets (29.43% of the analyzed sample), detected with the HEVDA tool. It is observed
that the first place is for Type 3 (“The file does not comply with the CSV format of
separator (comma);”), which is the most representative with more than half of blocking
types with 57.52%. Followed by Type 1 (“The file has a double character (quotation
mark)”) with 15.93%, then by Type 2 (“The file does not meet the same number of columns
in each one of its records”) with 14.16%, then Type 4 (“The file does not have the first row
of titles of the columns of the dataset”) with 11.50% and the last one the Type 5 (“The file
has names of repeated titles”) with 0.88%.
General results of the metrics
This section shows a comparison of the results obtained based on the analysis of the
number of datasets that comply or non-comply with, separated by the 8 proposed metrics.
The number of datasets surveyed is 271, that is, 70.57% of the sample used since 113
datasets were found, that is, 29.43%, with blocking characteristics, which is why they are
discarded from the analysis due to the membership of some type of unfulfillment aspect for
which they cannot be handled/processed by the developed tool.
Vol. 6, N°. 2, Abril – Junio 2021
175JOURNAL OF SCIENCE AND RESEARCH E-ISSN: 2528-8083
Table 2. Number of datasets with structural problems.
Percentage
Type Detail
datasets
1 The file has a double character “ (quotation mark); 15,93%
2 The file does not meet the same number of columns in each one of 14,16%
its records;
3 The file does not comply with the CSV format of separator 57,52%.
(comma);
4 The file does not have a first row of titles/names of the columns of 11,50%
the dataset;
5 The file has names of repeated titles; 0,88%
Table 3 shows the percentage in each cell discriminated for non-compliance with metrics.
The metric that is most fulfilled in validated datasets is Metric 2 with 65.10% (duplicate
records), on the other hand, the most unfulfilled metric is Metric 5 with 55.73%
(Redundancy in the domain of values of a column).
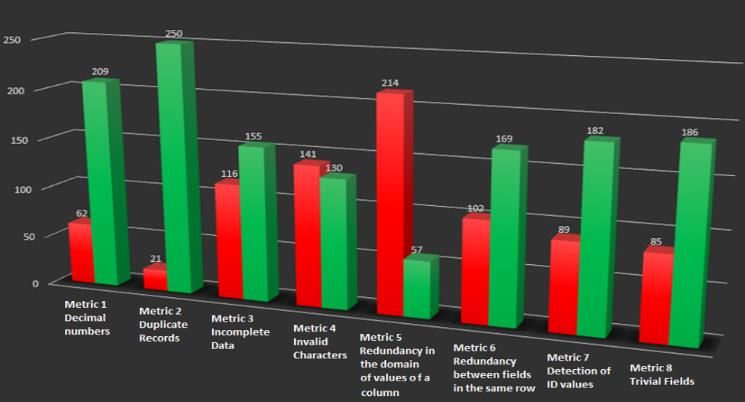
In Figure 2, the comparison of metrics represented by a bar graph is shown, where for each
metric 2 bars are shown, the first one corresponds to the unfulfillment of the metrics and
the second one to the fulfillment. Metric 2 (duplicate records) has 250 datasets, it is the
most accomplished, followed by Metric 1 (validation of the decimal data type) with 209
datasets, Metric 8 (trivial fields) with 186 datasets, and Metric 7 (detection of ID values)
with 182 datasets, being these the cases with the least difficulties encountered. Another one
of the aspects that are observed are the metrics that are least achieved, that is, the first bar in
each metric, as it is the case of Metric 5 (redundancy of values in the domain of a column)
with 214 datasets, followed by Metric 4 (invalid characters) with 141 datasets and Metric 3
(incomplete data) with 116 datasets, being these the 3 most relevant cases of data quality
unfulfillment.
Table 3. Unfulfillment datasets by metrics.
Percentage that Percentage that
Type Number
comply non-comply
METRIC 1: Decimal Numbers 54,43% 16,15%
METRIC 2: Duplicate Records 65,10% 5,47%
METRIC 3: Incomplete Data 40,36% 30,21%
METRIC 4: Invalid Characters 33,85% 36,72%
METRIC 5: Redundancy in the 14,84% 55,73%
Vol. 6, N°. 2, Abril – Junio 2021
176JOURNAL OF SCIENCE AND RESEARCH E-ISSN: 2528-8083
Percentage that Percentage that
Type Number
comply non-comply
domain of values of a column
METRIC 6: Redundancy between 44,01% 26,56%
fields of the same row
METRIC 7: Detection of ID values 47,40% 23,18%
METRIC 8: Trivial Fields 48,44% 22,14%
Figure 2. Verification of open data quality metrics.
Through this research and the proposed metrics, they can be classified into critical and non-
critical metrics.
Critical Metrics: They contain those metrics that allow detecting data problems of a priority
type for a correct analysis of results with datasets, such as redundancy issues, missing
content in records, or erroneous data. In other words, it is necessary to keep these aspects in
mind, since their presence does not favor a correct study of the available data.
Non-Critical Metrics: Contain those metrics that could represent content problems in the
dataset. Its detection is focused on possible estimates of cases of mistakes and trivial data,
as well as discoveries of combined redundant data (between fields and dataset records) that
could lead to inconveniences in the analysis of a data set.
Vol. 6, N°. 2, Abril – Junio 2021
177JOURNAL OF SCIENCE AND RESEARCH E-ISSN: 2528-8083
A graph is included in Figure 3 that represents the study of critical metrics (from 1 to 4
inclusive) with the percentage that represents the number of unfulfillment cases for them.
That is, of the 384 validated datasets, 830 cases of unfulfillment cases of data quality
metrics were found (being that the same dataset may or may not comply with more than
one metric), of which 340 cases with unfulfillment of critical metrics were detected.
Although it does not exceed half of the total cases detected (830 total cases of
unfulfillment), it is a fairly high number. Regarding critical metrics, according to Figure 3,
the most unfulfilled critical metric is Metric 4 (invalid characters) with 41.47%, followed
by Metric 3 (incomplete data) with 34.12%, then Metric 1 (validation of the decimal data
type) with 18.24% and finally Metric 2 (duplicate records) with 6.18%.
Figure 3. Percentage of cases with unfulfillment: Critical metrics and Non-Critical metrics.
Figure 3 shows a graphic with the non-critical metrics (from 5 to 8 inclusive) with
the percentage that represents the number of non-compliance cases for them. That is, of the
384 validated datasets, 830 cases of non-compliance with data quality metrics were found
(being that the same dataset may or may not fail to comply with more than one metric), of
which 490 cases with unfulfillment of non-critical metrics were detected. This value
exceeds more than half of the total cases detected (830 total cases of non-compliance), so
that, in unfulfillment issues, more cases of non-critical than critical metrics were found.
According to Figure 3, the most unfulfilled non-critical metric is Metric 5 (redundancy in
the domain of values of a column) with 43.67%, followed by Metric 6 (redundancy
between fields of the same row) with a 20.82%, then Metric 7 (detection of ID values) with
18.16% and finally Metric 8 (trivial fields) with 17.35%.
Vol. 6, N°. 2, Abril – Junio 2021
178JOURNAL OF SCIENCE AND RESEARCH E-ISSN: 2528-8083
DISCUSSION
In this article, various literature sources were exposed that support the importance of
measuring the quality of open government data, as developed in the section “Background
Information” in which research on the quality of the datasets is presented. These works
were analyzed to identify metrics that can measure and evaluate aspects about the open data
files. Also, different international organizations and institutions that work every day to raise
awareness and improve the openness of government data in aspects of Open Government
were surveyed. Some of these works analyze and propose measurement standards and good
practices for the evaluation of the datasets available in open data portals. These studies
consider some issues oriented to the measurement of files on public websites and release
statistics on the number of files downloaded, number of data sets, licenses, metadata, or
quality criteria oriented to software interoperability and file format, but in none of these
cases, a study is made of the content of the government datasets, that is, what values they
have and what state they are. On the other hand, various authors were presented who
propose publication standards for opening files and viewing content for the citizen, but not
a detailed analysis of the content of open data sets. Other research works are focused on
raising awareness of this new paradigm, which is why they provide a repository of
geographic locations of countries with open data portals around the world (Open Data
Inception, 2016), (Portals, 2011), but they are only direct accesses and do not present an
analysis of the datasets.
Regarding measurement criteria, some international organizations (Global Open Data
Index, 2017) present indices that arise from the analysis of a set of aspects for each country,
for example, it is shown that only 11% of the data sets worldwide are open. Although this
analysis is interesting, only the points referring to licenses are studied, if the files are
readable by a machine, if they can be downloaded from the official portal, if they are
updated, among others, but this is not analysis from the point of view of the content that the
datasets have. Other studies on the impact of open data initiatives are: the Open Data
Barometer (World Wide Web Foundation, 2019), the Open Data Inventory (ODIN) (Open
Data Watch, 2020), and the Open Data Index of Argentine Cities that presents a ranking of
the current state of the release of data in an open format in the country's municipalities
(Open Data Census, 2021), these works are cases in which it was observed that they
Vol. 6, N°. 2, Abril – Junio 2021
179JOURNAL OF SCIENCE AND RESEARCH E-ISSN: 2528-8083
evaluate the coverage and openness of data to continue with open data policies, but neither
it performs an internal analysis of the content of the datasets, but rather its study is oriented
to the availability of the general structure of the files.
From the approach of evaluation models, there are international organizations such as the
International Open Data Charter (Xhardez, 2020) and (Pinto, 2004) that propose as
evaluation methodology, some parameters that can be evaluated on the content,
accessibility, functionality, navigability, up to date and design. Also, it is important that the
evaluation is oriented to the use of a guide of good standard practices (Indart, 2020) to
facilitate interoperability and accessibility (Pasini, 2018) to maintain the principles of
openness. From the quality aspect of the dataset content, there are studies carried out in
Argentina, Brazil, and Paraguay (Nicolás & Catachura, 2020) that measure quality based on
their content, for example, incomplete data, obsolete and invalid data, among others. This
leads us to think of another type of approach to quality issues, since a quality vision is not
presented from the file, but from the content of the file.
In this article, great importance is given to having aspects that must be addressed and
reconciled among various sectors of the public administration in this paradigm of
government transparency, the implementation of quality standards in open data will favor
various state organizations that not only provide public data to citizens but also to other
state entities worldwide. Based on the studies carried out, the authors found that there are
major problems, on the one hand, it could be observed that there are various drawbacks in
the structures of the datasets available in the open data portals and that the data has several
shortcomings, For example, incomplete or empty data inside or problems of structures in
which the number of columns and others is not delimited correctly, the other major
drawback is that there are no control or validation tools for the datasets, due to the fact that
there are few investigations that focus their study on the content and quality of the data
provided.
Based on the findings of this study, it is possible to affirm that the validation and analysis
tools for open data quality metrics are necessary in order to maintain the validity and
integrity of the content. These tools favor a high possibility of obtaining a reliable analysis
about a certain context. This makes it possible to obtain a study on the points to consider
and to have a "state of health" of the data sets, which could be improved, in case of
Vol. 6, N°. 2, Abril – Junio 2021
180JOURNAL OF SCIENCE AND RESEARCH E-ISSN: 2528-8083
detection of faults, for example, redundancy, lack of fields, lack of names that logically
identify each field in the data set, among others. A detection tool allows the veracity of the
content to be used and reflected in a study with added value to the citizens. Another
contribution that is presented in this work is the importance of defining various metrics that
analyze different properties of the content, such as repetitions, types of redundancies,
character validations and others, in order to understand the data , avoiding to leading to
false studies on wrong or dirty data. It should be noted that the quality metrics proposed by
the HEVDA tool that was developed in this work, allow mitigating possible errors in the
treatment of data sources, in addition, this is a positive point for collaboration in software
interoperability, so that open data can be reused. An interesting point to keep in mind is that
the HEVDA validation tool could be used in the open portals of the different state
government agencies, in order to provide a study to help those organizations that want to
make their open public data available.
This would raise awareness about the importance of the value of the data to carry out valid
studies, as well as keeping in mind that organizations will be able to validate their datasets
before being published on their websites and thus, be able to mitigate or avoid certain errors
in their contents.
CONCLUSIONS AND FUTURE WORK
The role of the technology is fundamental to promote access to information, citizen
collaboration, and the availability of the aspect of transparency in this context. Therefore, it
is necessary to consider certain essential facilitators for an adequate agreement between the
government and the citizens. Due to the importance of the quality of open data according to
the previously mentioned, it is vital to focus on various metrics that help measure the
quality of open public data exposed as datasets in governmental portals.
As shown in previous sections, for the results of this study it is observed that of the
384 datasets compiled, there are only 6.51% (25 datasets) that comply with all the
validations of the proposed metrics. This leads us to think about the long way to go in
matters of good practices and the quality of the data available on government websites.
As a result, and contribution of this research, the HEVDA validation tool allows a
better collection of state data sources, to know if they can be correctly used by software
processes by state organizations. It is important that governments perform this validation
Vol. 6, N°. 2, Abril – Junio 2021
181JOURNAL OF SCIENCE AND RESEARCH E-ISSN: 2528-8083
before uploading their datasets, to their portals and make them available, and thus,
anticipating possible deficiencies in the data. It is worth mentioning that datasets without
errors, will help to strengthen trust between citizens and the State.
As future lines of research, the scope and implementation of more quality metrics will
continue to be studied, as well as their development in the HEVDA tool and thus analyze
and detect more problems in datasets and improve both the content quality and
interoperability.
REFERENCES
5stardata.info. (22 de 01 de 2012). 5 estrellas de Datos Abiertos. Obtenido de
https://5stardata.info/es/#:~:text=Tim%20Berners%2DLee%2C%20el%20inventor,beneficios
%20involucrados%20en%20cada%20caso
Abella, A. O.-d.-U.-C.-P.-H. (2018). Indicadores de calidad de datos abiertos: el caso del portal de
datos abiertos de Barcelona, El profesional de la información (EPI). 27(2), 375-382.
Alba Cuellar, D. (2011). Detección de registros duplicados entre dos archivos digitales.
https://cimat.repositorioinstitucional.mx/jspui/bitstream/1008/239/2/TE%20370.pdf.
Argentina Unida. (2021). Datos Argentina. Obtenido de https://datos.gob.ar/
Arizo, I. (2016). Métricas basadas en datos. Universitat Politècnica de València. Tesis de Maestría
en Gestión de la Información.
Barrera, M. A. (2020). REUTILIZACION DE DATOS PUBLICOS: PROPUESTA DE
EVALUACION DEL GRADO DE APERTURA DE LOS DATOS EN PORTALES DE
INFRAESTRUCTURA DE DATOS ESPACIALES. Jornadas de Ciencia y Tecnología, 141.
Beltrán, L. E. (2017). Prototipo de software para la evaluación de la calidad de datos abiertos.
Repositorio Institucional de la Universidad Católica de Colombia. Tesis. Obtenido de
https://repository.ucatolica.edu.co/jspui/bitstream/10983/14642/1/Data%20Quality%20in%20
OpenData.pdf
brujo, E. a. (2015). Tratamiento de datos duplicados en SQL Server (1). Obtenido de
https://geeks.ms/lmblanco/2015/07/06/tratamiento-de-datos-duplicados-en-sql-server-1/
Buenos Aires Ciudad. (2021). Buenos Aires Data. Obtenido de https://data.buenosaires.gob.ar/
Buenos Aires provincia. (2017). Kit de Apertura Municipal. Obtenido de
http://escueladefiscales.com/Kit%20de%20Apertura%20Municipal%202017%20-
%20provincia%20de%20buenos%20aires.pdf
Cadena-Vela, S. F.-G. (2019). Publicando datos abiertos considerando criterios de calidad.
Vol. 6, N°. 2, Abril – Junio 2021
182JOURNAL OF SCIENCE AND RESEARCH E-ISSN: 2528-8083
Certificate, O. D. (2021). Certificado de datos abiertos ODI. Obtenido de
https://certificates.theodi.org/en/about
Chaves, L. E. (2020). TICs, comunicación y participación ciudadana en los planes de Gobierno
Abierto de Argentina, Costa Rica y México. Global Media Journal México, 17(32).
Cobo, C. (2020). Gobierno abierto: de la transparencia a la inteligencia cívica.
DATA, B. A. (2021). Historias con Datos. Obtenido de Ciudad de Buenos Aires:
https://data.buenosaires.gob.ar/historias-con-datos
Datos, D. A. (2021). Datasets. Obtenido de http://datos.salud.gob.ar/dataset
Datos, P. d. (2021). Datos - Recursos acerca del funcionamiento del sistema de justicia de la
República Argentina. Obtenido de http://datos.jus.gob.ar/dataset
datos.gob.ar. (2021). Estándares según el tipo de Datos. Obtenido de
https://datosgobar.github.io/paquete-apertura-datos/guia_abiertos/#estandares-segun-el-tipo-
de-datos
Datos.gob.es. (2020). Manual práctico para mejorar la calidad de los datos abiertos. Obtenido de
Reutiliza la información pública: https://datos.gob.es/es/documentacion/manual-practico-
para-mejorar-la-calidad-de-los-datos-abiertos
Diputados, D. A. (2021). Conjuntos de Datos. Obtenido de https://datos.hcdn.gob.ar/dataset
Everywhere, G. (2021). Principales indicadores para Calidad de Datos. Obtenido de
https://www.grapheverywhere.com/principales-indicadores-para-calidad-de-datos/
Global Open Data Index. (2017). Place overview. Obtenido de https://index.okfn.org/place/
Gobierno de Colombia. (2020). Calidad e Interoperabilidad de los datos abiertos del Gobierno de
Colombia. Obtenido de Guía de Estándares:
https://herramientas.datos.gov.co/sites/default/files/A_guia_de_estandares_final_0.pdf
Humanos, N. U. (1976). Pacto Internacional de Derechos Civiles y Políticos. Obtenido de Adoptado
y abierto a la firma, ratificación y adhesión por la Asamblea General en su resolución 2200 A
(XXI), de 16 de diciembre de 1966:
https://www.ohchr.org/sp/professionalinterest/pages/ccpr.aspx#:~:text=Art%C3%ADculo%2
019&text=de%20sus%20opiniones.-
,2.,otro%20procedimiento%20de%20su%20elecci%C3%B3n
Ibanez Gonzalez, L. M. (2019). An assessment of adoption and quality of linked data in European
open government data.
Indart, C. (2020). Datos abiertos de Investigación en Argentina. Análisis de su implementación en
portales y repositorios. Obtenido de Master en sistemas de información digital. Universidad
de Salamanca:
Vol. 6, N°. 2, Abril – Junio 2021
183JOURNAL OF SCIENCE AND RESEARCH E-ISSN: 2528-8083
https://gredos.usal.es/bitstream/handle/10366/147099/TFM_SistemasInfoDigital_Indart_Cam
ila_SI_85_2019-2020.pdf?sequence=1&isAllowed=y
Leonangeli, S. &. (2019). Hacia un paradigma de calidad de Datos Abiertos adecuado al propósito
de Gobierno Abierto. In XIII Simposio de Informática en el Estado (SIE 2019)-JAIIO 48
(Salta).
Martínez, R. R. (2020). Análisis de datasets y catálogos en los portales abiertos gubernamentales de
la República Argentina. IEEE ARGENCON 2020. V Biennial Congress of IEEE Argentina
Section.
Microsoft. (2021). IDE de Visual Studio 2019. Obtenido de
https://visualstudio.microsoft.com/es/vs/
MinTIC, E. f.–G. (2020). Guía para el uso y aprovechamiento de Datos Abiertos en Colombia.
Obtenido de https://gobiernodigital.gov.co/623/articles-9407_guia_datos.pdf
Modernización, S. d. (2019). Perfil de Aplicación Nacional de Metadatos para Datos Abiertos.
Obtenido de Presidencia de la Nación: https://datosgobar.github.io/paquete-apertura-
datos/perfil-metadatos/#condiciones-de-cumplimiento-del-perfil
Naciones Unidas. (2020). La Agenda para el Desarrollo Sostenible – Desarrollo Sostenible.
Obtenido de https://www.un.org/sustainabledevelopment/es/development-agenda/
Naciones Unidas. (2021). La Declaración Universal de Derechos Humanos. Obtenido de
https://www.un.org/es/universal-declaration-human-
rights/#:~:text=Art%C3%ADculo%2019.,por%20cualquier%20medio%20de%20expresi%C
3%B3n
Naser, A. R.-A. (2017). Desde el gobierno abierto al Estado abierto en América Latina y el Caribe.
Nicolás, M., & Catachura, C. (2020). Gobierno abierto: análisis de websites de datos abiertos
gubernamentales en Argentina, Brasil y Paraguay. Instituições parceiras do INCT/PPED:
UFRJ, UFF, UFRRJ, UFJF, UNICAMP e UERJ, 163.
OCDE. (2015). Gobierno Abierto en América Latina, estudios de la OCDE sobre Gobernanza
Pública. doi:https://doi.org/10.1787/9789264225787-es
OGP. (2021). Committed to making governments more open, accountable, and responsive to
citizens. Obtenido de Open Government Partnership: https://www.opengovpartnership.org/
Open Data Census. (2021). Índice de Datos Abiertos de Ciudades Argentinas. Obtenido de
https://2021.indicedatosabiertos.org/
Open Data Inception. (2016). Open Data Inception - 2600+ Open Data Portals Around the World.
Obtenido de https://opendatainception.io/
Vol. 6, N°. 2, Abril – Junio 2021
184JOURNAL OF SCIENCE AND RESEARCH E-ISSN: 2528-8083
Open Data Watch. (2020). Open Data Inventory (ODIN). Obtenido de
https://odin.opendatawatch.com/
Oviedo Blanco, E. (2016). Modelo de madurez para portales de datos abiertos e incorporación a la
norma técnica nacional de Costa Rica. Repositorio Institucional de la Universidad de
Alicante. Tesis Doctoral. Obtenido de http://rua.ua.es/dspace/handle/10045/54316
Pasini, A. C. (2018). Modelos de evaluación de gobiernos abiertos, aplicado a los municipios de la
provincia de Buenos Aires. In XXIV Congreso Argentino de Ciencias de la Computación.
Obtenido de In XXIV Congreso Argentino de Ciencias de la Computación (La Plata, 2018)..
Pinto, M. (2004). Calidad y evaluación de los contenidos electrónicos. Obtenido de
http://www.mariapinto.es/e-coms/calidad-y-evaluacion-de-los-contenidos-electronicos/
Portals, D. (2011). Data Portals. Obtenido de Search Data Portals: http://dataportals.org/search
Rodríguez Rojas, L. A. (2017). Metamodelo para integración de datos abiertos aplicado a
inteligencia de negocios. Repositorio Institucional de la Universidad de Oviedo. Tesis
Doctoral., http://digibuo.uniovi.es/dspace/handle/10651/44552.
Royo-Montañés, S. &.-G. (2019). Portales de datos abiertos. Metodología de análisis y aplicación a
municipios españoles. El profesional de la información, 28(6).
Schieferdecker. (2012). (Open) Data Quality. IEEE 36th Annual Computer Software and
Applications Conference , Izmir, Turquíaz, págs. 83-84. doi:doi: 10.1109 /
COMPSAC.2012.120.
Support, Open Data. (2020). Open Data & Metadata Quality. Obtenido de
https://www.europeandataportal.eu/sites/default/files/d2.1.2_training_module_2.2_open_data
_quality_en_edp.pdf
Vela, S. G. (2019). Marco de referencia para la publicación de datos abiertos comprensibles basado
en estándares de calidad. Universitat d'Alacant-Universidad de Alicante). Doctoral
dissertation.
White House. (2009). Transparency and Open Government. Obtenido de
https://web.archive.org/web/20161215181923/https://www.whitehouse.gov/the_press_office/
TransparencyandOpenGovernment
World Wide Web Foundation. (2019). The Open Data Barometer. Obtenido de
https://opendatabarometer.org/?_year=2017&indicator=ODB
Xhardez, V. (2020). Datos abiertos en la Argentina: desafíos para la apertura y reutilización de
datos públicos de gobierno. Obtenido de http://www.ciecti.org.ar/wp-
content/uploads/2020/12/DT22-Datos-abiertos_FINAL.pdf
Vol. 6, N°. 2, Abril – Junio 2021
185You can also read