Childcare Sufficiency Assessment (CSA) December 2020 - December 2021 - Suffolk County Council Early Years and Childcare Service
←
→
Page content transcription
If your browser does not render page correctly, please read the page content below
Childcare
Sufficiency
Assessment (CSA)
December 2020 –
December 2021

Suffolk County Council
Early Years and Childcare Service
December 2020
 Page 2 of 95
CONTENTS

                                 Table of Contents
COVID – 19                                                               5
1. Overall assessment and summary                                        5
     England picture compared to Suffolk                                 6
     Suffolk contextual information                                      6
     Overall sufficiency in Suffolk                                      7
     Deprivation                                                         8
     How Suffolk ranks across the different deprivation indices          8
2. Demand for childcare                                                  14
     Population of early years children                                  14
     Population of school age children                                   14
3. Parent and carer consultation on childcare                            15
4. Provision for children with special educational needs and disabilities 20
     Number of children with SEND                                        20
5. Supply of childcare, Suffolk picture                                  22
     Number of Early Years Providers                                     22
     All Providers in Suffolk - LOP and Non LOP                          22
     Number of school age providers and places                           23
6. Funded early education                                                24
     Introduction to funded early education                              24
     Proportion of 2 year olds entitled to funded early education        24
     Take up of funded early education                                   25
     Comparison of take up of funded early education 2016 -2019          25
7. Three and four-year-old funded entitlement – 30hrs                    26
     30 hr codes used in Suffolk                                         26
     Table 8                                                             26
8. Funded early education places available                               27
     Funded early education places available                             27
     Early education places at cluster level                             29
9. Hourly rates                                                          31
     Hourly rate paid by Suffolk County Council                          31
     Hourly rate charged by providers                                    31
     Mean hourly fee band for Suffolk                                    31

                                      December 2020
                                       Page 3 of 95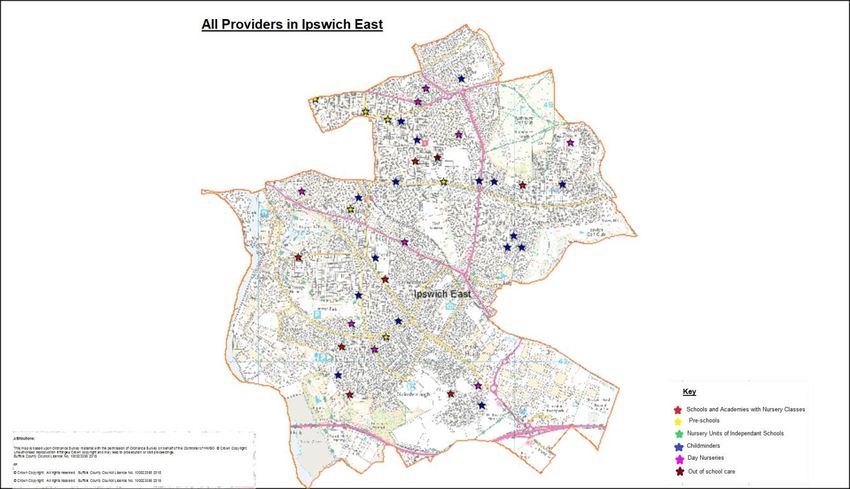
10. Quality of childcare                                                   32
     Ofsted inspection grades                                              32
11. Plans for sufficiency work in 2021                                     33
12. Methodology                                                            34
13. References                                                             36
     Appendix 1 Cluster level details                                      37
     Clusters by ward                                                      37
     Section 1.01 Cluster sufficiency overview – Bury St Edmunds           41
     Section 1.03 Cluster sufficiency overview – Forest Heath              48
     Section 1.04 Cluster sufficiency overview – Sudbury                   51
     Section 1.05 cluster sufficiency overview – Haverhill                 55
     Section 1.06 Cluster sufficiency overview – Lowestoft South           58
     Section 1.07 Cluster sufficiency overview – Lowestoft North           61
     Section 1.08 Cluster sufficiency overview –Waveney and Blyth          64
     Section 1.09 Cluster sufficiency overview – Ipswich North             67
     Section 1.10 Cluster sufficiency overview – Ipswich West              71
     Section 1.11 Cluster sufficiency overview – South Suffolk             75
     Section 1.12 Cluster sufficiency overview – Woodbridge and Kesgrave   78
     Section 1.13 Cluster sufficiency overview – Ipswich East              81
     Section 1.14 Cluster sufficiency overview – Felixstowe                84
     Section 1.15 Cluster sufficiency overview – Framlingham and Leiston   87
     Section 1.16 Cluster sufficiency overview – Stowmarket                90
     Section 1.17 Cluster sufficiency overview - High Suffolk              93

                                    December 2020
                                     Page 4 of 95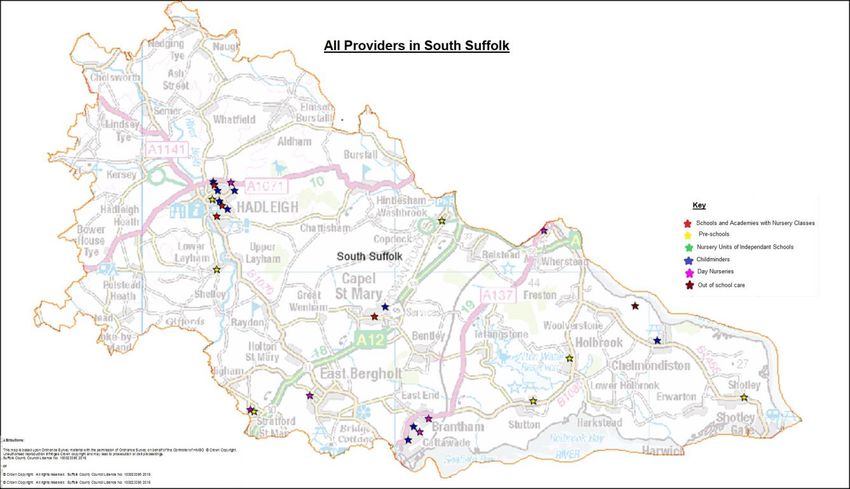
COVID – 19

At the point of this sufficiency assessment being published, the full impact of the Covid 19
pandemic has not been realised across Suffolk’s childcare provision. Some providers have
closed in Suffolk since March 2020. However, existing provision has also expanded and
new provision has opened this year. Some provision in the county has experienced lower
numbers of children whereas other providers report more hours being accessed than prior
to the Covid 19 pandemic and this mixed picture is in line with other parts of the country.
The impact of the pandemic on how we live creates an everchanging situation and we will
continue to both monitor supply and demand and work with providers to ensure sufficient
childcare places are available.

                    1. Overall assessment and summary
Suffolk County Council (SCC) is required to report annually to elected members
demonstrating how the sufficiency duty under Section 6 of the Childcare Act 2006 is met.
This act places a duty on English local authorities to secure sufficient childcare for working
parents. The expected outcome of the sufficiency duty is that parents are able to work
because childcare places are available, accessible and affordable and are delivered
flexibly in a range of high-quality providers.

There is a further requirement to make this report available and accessible for parents.

The legislation above is defined in B1 and B2 in the Statutory Guidance, page 27. The link
to the guidance is here.

B1: Secure sufficient childcare, so far as is reasonably practicable, for working parents, or
parents who are studying or training for employment, for children aged 0-14 (or up to 18
for disabled children).

B2: Report annually to elected council members on how they are meeting their duty to
secure sufficient childcare and make this report available and accessible to parents.

SCC has assessed information about the current and projected supply and demand of
childcare for particular age ranges of children, and the affordability, accessibility and
quality of provision This work is undertaken by gathering data on the number of places
available, take up of places and population.

SCC uses this information to plan work supporting the local childcare market.
This information is used to target specific areas to ensure that supply matches demand as
far as possible. The council also uses this data to respond to housing development
enquiries in order to secure provider contributions for the development of early years and
childcare places. This is to help comply with local authority duties under section 2 of
the Childcare Act 2016 and sections 6, 7, 7A, 9A, 12 and 13 of the Childcare Act 2006 to
ensure sufficient childcare for working parents.
The government promotes an offer of free childcare or free early education to parents.
After listening to the views of the providers in Suffolk a decision was taken to refer to this
as ‘funded early years childcare or education’. This is reflected throughout this document.

                                       December 2020
                                        Page 5 of 95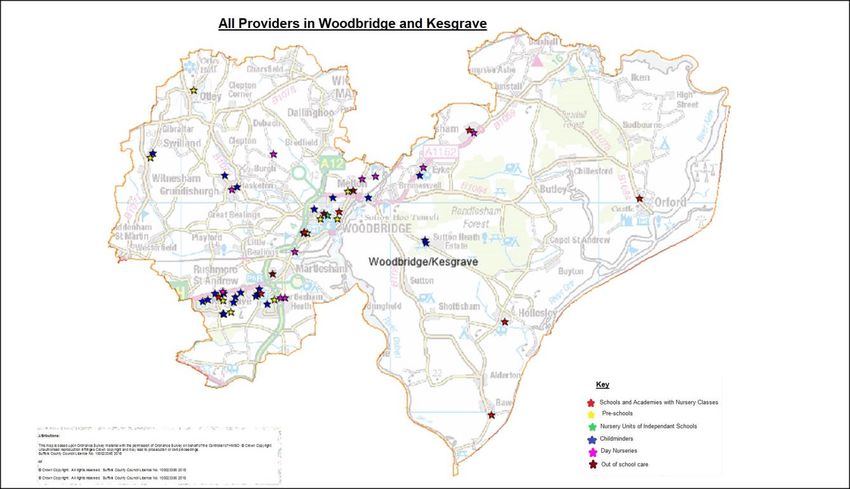
England picture compared to Suffolk

•   In England, there were an estimated 75 thousand providers offering 1.3 million Ofsted
    registered places in Spring 2020.
•   In Suffolk there are 707 providers offering 12,868 full time equivalent Ofsted
    registered places in Summer 2020.
•   56% of Councils in England report having enough childcare places for working parents to
    access their funded 30 hour place.
•   There is a deficit of -1402 early education places available in Suffolk after sold
    places have been taken into account.
•   Childcare costs for parents with children aged three and four excluding their funded
    entitlements is on average £5.04 per hour for England.
•   Childcare costs for parents with children aged three and four excluding their funded
    entitlements is on average £5.03 per hour for East of England.
•   Childcare costs for parents with children aged three and four excluding their funded
    entitlements is on average £4.50 per hour for Suffolk.
•   Nationally the take up of funded two year olds is 68%
•   In Suffolk currently 73% of eligible two year olds take up a funded place.
•   Nationally the take up of funded three year olds is 92%.
•   In Suffolk 91% of three year olds take up a funded place.
•   Nationally the take up of funded four year olds is 95%.
•   In Suffolk 96% of four year olds take up a funded place.

    Suffolk contextual information

•   There are 40,113 children under the age of five living in Suffolk.
•   Suffolk Local Authorities are planning to deliver more than 66,000 new homes over the
    next fifteen years. To meet the demand from this housing 5,665 full time equivalent (FTE)
    places, would need to be developed.
•   95% of early years providers who deliver the funded entitlements are currently graded at
    good or outstanding. There has been a steady increase in the number of providers judged
    to be outstanding and this currently stands at 17%.
•   The Early Education National Funding Formula was introduced in 2017. The impact for
    Suffolk was that less money was received from the Government to pass through to
    providers and less centrally retained to support the service.
•   Some providers in Suffolk have reported that they are struggling to meet the additional
    costs of running a childcare business having seen increases in the living wage, pension
    contributions and business rates. This affects the sustainability of the childcare market.
    The Covid19 pandemic has created further challenges for childcare providers with some
    parents no longer needing childcare due to changes in working lifestyle or in employment,
    some parents needing more childcare as working hours change and others electing to
    keep their children at home. Local knowledge would indicate some providers have fewer
    children attending more than one setting and this has had a particular impact on out of
    school provision such as breakfast clubs.

                                          December 2020
                                           Page 6 of 95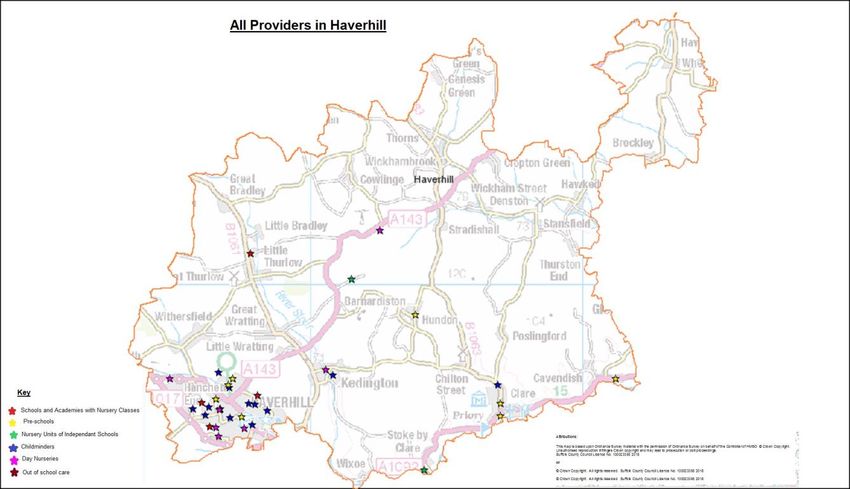
•   In the Summer of 2020, Suffolk County Council introduced a range of business and
    finance support tools to help childcare providers plan steps to recovery and to increase
    understanding of the factors to consider when running a childcare business. Providers on
    the Suffolk List of Providers have been offered support in using these tools.
•   Between Easter and the end of August 2020, SCC made available additional funding for
    providers taking vulnerable or keyworkers’ babies and children under five. All providers
    were able to keep their early education funding between March and August even if they
    remained shut. In the Autumn term 2020 providers were invited to apply for the funded
    places recovery payment if their funding was 10% or more below that in Autumn 2019.

    Overall sufficiency in Suffolk

    Early years and childcare team members are deployed within clusters and are responsible
    for having an overview of the supply and demand within a cluster area. A Quality and
    Access Co-ordinator has responsibility for overseeing sufficiency of childcare places
    across several clusters.

    This report includes a sufficiency summary for each cluster. The data is based on the
    Summer Term as this term reflects the period in a year where there is greatest demand for
    childcare places. For this specific report, 2019 data has had to be used due to the Covid
    19 situation affecting typical demand and access in childcare settings.

    In order to provide a clearer and more accurate picture of Suffolk’s sufficiency of places,
    the number of places recorded in this report as ‘available’ takes into consideration places
    sold by the childcare providers directly to parents and families. The number of sold places
    reduces the number of funded places available for universal and extended places. Sold
    places were calculated by taking a countywide sample from each type of childcare
    provider. A percentage was then calculated, and this was applied to the relevant type of
    provider across Suffolk. The sample data was based on the places sold in Summer 2019.
    This was because this term reflected the most typical term where capacity is at greatest
    demand prior to the Covid 19 pandemic.

    Across Suffolk the needs of families differ. The government’s criteria for funded two year
    old places is determined primarily by the social economic circumstances of the family.
    Areas with higher numbers of families meeting this criterion are likely to have a greater
    demand for two year old places. Suffolk also offers a two year old funded place to children
    who are, or have ever been, in care and children who are in receipt of disability living
    allowance or who have an Education Health and Care Plan (EHCP). Some parents who
    are non- European Economic Area (EAA) citizens but who cannot claim benefits may also
    be eligible. See the link below for further details.
    Help paying for childcare: Free education and childcare for 2-year-olds - GOV.UK (www.gov.uk)

    In addition, SCC works in partnership with the Family Nurse Partnership (FNP) to offer
    early funding of places for up to 15 hours per week for two year olds who have graduated
    from the FNP programme to support consistency and effective transition. Children
    accessing the FNP are eligible for funding from their second birthday. FNP engages with
    eligible teenage mothers and their intervention ceases when the child turns two. SCC
    provides the same offer to two year olds that are supported under the Young Person

                                           December 2020
                                            Page 7 of 95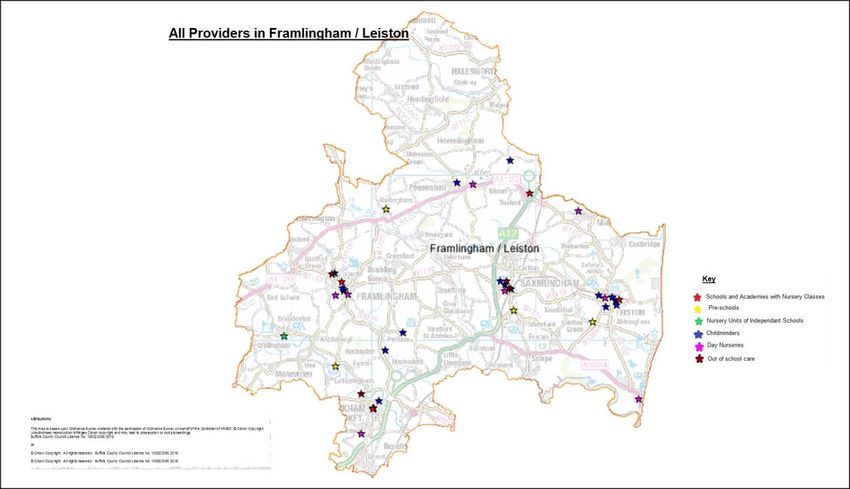
Pathway delivered by its 0-19 Healthy Child Programme to teenage mothers. An
agreement between the childcare provider and SCC is put in place for funding until the
child is eligible under the funding at two criteria.

Deprivation

Deprivation in Suffolk

The Index of Multiple Deprivation (IMD) 2019 is the official measure of relative deprivation
for small areas (or neighbourhoods) in England. The Index of Multiple Deprivation ranks
every small area, also known as Lower Super Output Area (LSOA), in England from 1
(most deprived area) to 32,844 (least deprived area).

https://www.gov.uk/government/statistics/english-indices-of-deprivation-2019

https://www.healthysuffolk.org.uk/uploads/Indices_of_Deprivation_2019_Shortpdf.pdf

Using the IMD ‘rank of average rank’ summary measure, Suffolk ranked 99 out of 151 of
Upper Tier Local Authorities in England with rank 1 being the most deprived.

While IMD is principally used for looking at small areas there is some summary data for
larger areas, for example, Local Authorities. However, the pattern of deprivation across
large areas can be complex. In some areas, deprivation is concentrated in pockets, rather
than evenly spread throughout. In other areas the opposite picture is seen, with
deprivation spread relatively evenly throughout the area, and with no highly deprived
areas.

How Suffolk ranks across the different deprivation indices

Scores are calculated across a number of domains. The table below show details on how
Suffolk ranks in each of those domains. Ranks are out of the 151 of Upper Tier Local
Authorities with a rank of 1 being the most deprived

Average rank for Suffolk in each of the domains - 2019

                             Suffolk
IMD                                                                 99
Income                                                             114
Employment                                                         105
Education, Skills and Training                                      57
Health Deprivation and Disability                                  101
Crime                                                              118
Barriers to Housing and Services                                    52
Living Environment                                                  86
Income Deprivation Affecting Children Index (IDACI)                106
Income Deprivation Affecting Older People (IDAOPI)                 121

                                       December 2020
                                        Page 8 of 95
Suffolk is more deprived in terms of education, skills and training and barriers to housing
and services and less deprived in terms of crime and income.

Deprivation at LSOA Level

The map below shows the IMD composite index quintiles of deprivation by LSOA. In 2007
and 2010 all of the areas in Suffolk within the most deprived 20% of areas in England were
found in Ipswich and Lowestoft (shown in red). By 2015 these areas of higher deprivation
have increased and spread to other parts of the county, including Felixstowe, Great
Cornard, Stowmarket, Bury St Edmunds, Mildenhall and Beccles. Since 2010, many areas
of rural Suffolk have moved from the second least deprived 20% in England (pale green)
to the mid-quintile (yellow).

IMD quintile by LSOA in Suffolk, 2019

Data source:
https://www.healthysuffolk.org.uk/uploads/Indices_of_Deprivation_2019_Shortpdf.pdf

https://www.gov.uk/government/uploads/system/uploads/attachment_data/file/845345/File_7_-
_All_IoD2019_Scores__Ranks__Deciles_and_Population_Denominators_3.csv/preview

Deprivation at district and borough and ward level

                                       December 2020
                                        Page 9 of 95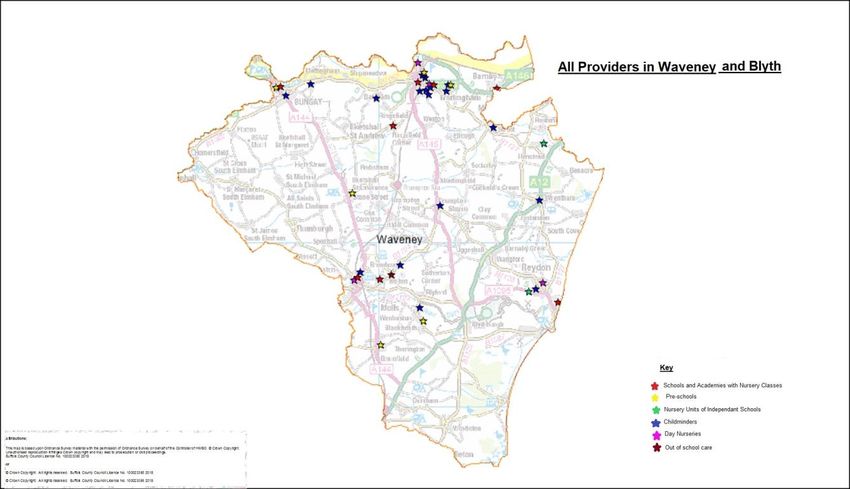
Districts and boroughs
Suffolk consists of five local authority districts or boroughs as shown in the map above;
these are Babergh, East Suffolk, Ipswich, Mid Suffolk and West Suffolk.

Babergh - Key points
     o The IMD ‘rank of average rank’ summary measure places the authority at 212
        out of 317 local authorities
     o Has no LSOA’s in the most deprived 10% or 20%
     o The most deprived LSOA is Babergh 007E

2019 - Average rank for Babergh in each of the domains
IMD                                                                       212
Income                                                                    226
Employment                                                                228
Education, Skills and Training                                            173
Health Deprivation and Disability                                         257
Crime                                                                     212
Barriers to Housing and Services                                           45
Living Environment                                                        150
Income Deprivation Affecting Children Index (IDACI)                       219
Income Deprivation Affecting Older People (IDAOPI                         243

East Suffolk – Key points
  • In April 2019 East Suffolk Council was formed by merging Suffolk Coastal and
      Waveney council areas.
  • The IMD ‘rank of average rank’ summary measure places the authority at 158 out of
      317 local authorities
  • 10 LSOAs are in the 10% most deprived areas
  • The most deprived LSOA is Waveney 007D

2019 - Average rank for East Suffolk in each of the domains
IMD                                                                       158
Income                                                                    167
Employment                                                                143
Education, Skills and Training                                            113
Health Deprivation and Disability                                         159
Crime                                                                     217
Barriers to Housing and Services                                          209
Living Environment                                                        133
Income Deprivation Affecting Children Index (IDACI)                       163
Income Deprivation Affecting Older People (IDAOPI                         202

                                          December 2020
                                           Page 10 of 95
Ipswich – Key points
• The IMD ‘rank of average rank’ summary measure places the authority at 71 out of
317 local authorities
• It is the most relatively deprived authority within Suffolk
• 45.8% of LSOAs in Ipswich are in the most deprived 30% nationally
• The most deprived LSOA is Ipswich 014B
2019 - Average rank for Ipswich in each of the domains
IMD 71
Income 85
Employment 84
Education, Skills and Training 35
Health Deprivation and Disability 69
Crime 52
Barriers to Housing and Services 203
Living Environment 78
Income Deprivation Affecting Children Index (IDACI) 84
Income Deprivation Affecting Older People (IDAOPI 95
Mid Suffolk – Key points
• The IMD ‘rank of average rank’ summary measure places the authority at 229 out of
317 local authorities
• 3.6% of LSOA’s are in either the 20% or 30% most deprived areas
• The most deprived LSOA is Mid Suffolk 008C
2019 - Average rank for Mid Suffolk in each of the domains
IMD 229
Income 261
Employment 268
Education, Skills and Training 189
Health Deprivation and Disability 285
Crime 260
Barriers to Housing and Services 43
Living Environment 119
Income Deprivation Affecting Children Index (IDACI) 250
Income Deprivation Affecting Older People (IDAOPI 252
December 2020
Page 11 of 95West Suffolk – Key points
• In April 2019 West Suffolk Council was formed by merging Forest Heath and St
Edmundsbury council areas
• The IMD ‘rank of average rank’ summary measure places the authority at 176 out of
317 local authorities
• 1% of LSOA’s are in the 20% most deprived
• The most deprived LSOA is St Edmundsbury 003C
2019 - Average rank for West Suffolk in each of the domains
IMD 176
Income 224
Employment 227
Education, Skills and Training 110
Health Deprivation and Disability 187
Crime 198
Barriers to Housing and Services 25
Living Environment 243
Income Deprivation Affecting Children Index (IDACI) 241
Income Deprivation Affecting Older People (IDAOPI 214
For areas like wards we can look at the proportion of LSOAs within the ward that lie within
each decile. Decile one represents the most deprived 10% of LSOAs in England while
decile 10 shows the least deprived 10% of areas.
In Suffolk there are 139 Wards; 44 of these wards (31%) include LSOAs in the top three
deciles (most deprived neighbourhoods in England)
The breakdown of these wards into clusters can be seen here:
Bury St Edmunds 4 wards
Felixstowe 2 wards
Forest Heath 4 wards
Haverhill 4 wards
Ipswich East 3 wards
Ipswich North 5 wards
Ipswich West 6 wards
Lowestoft North 3 wards
Lowestoft South 4 wards
Stowmarket 3 wards
Sudbury 4 wards
Waveney and Blyth 1 ward
Woodbridge & Kesgrave 1 ward
December 2020
Page 12 of 95Most deprived wards by cluster
Bury St Edmunds
3% 8% Felixstowe
3%
Forest Heath
14% 6%
Haverhill
3% Ipswich East
6%
6% Ipswich North
14% Ipswich West
11%
Lowestoft North
9% Lowestoft South
17%
Stowmarket
Sudbury
These wards have been listed in Appendix One – Cluster level profiles
December 2020
Page 13 of 952. Demand for childcare
Population of early years children
In total, there are 40,113 children under the age of five living in Suffolk. These children
may require early years childcare.
Table 1
Age Number of children
Age 0 7,323 Number of pre school aged
Age 1 7,814 children
Age 2 7,995
Age 3 8,628
Age 4* 8,393 8,628
8,393
7,995
7,814
7,323
AGE 0 AGE 1 AGE 2 AGE 3 AGE 4*
* Some four-year-olds will be in
reception classes
Data Source: ONS population estimates 2019
Population of school age children
In total there are 55,685 primary school age children aged from four to eleven, and 38,758
children aged from 12 to 16 in school living in Suffolk. These children may require
childcare before and after school, and/or during the school holidays.
Table 2
Age Number of children
Reception 7609 Number of school aged
Year 1 7774
Year 2 7819 children
Year 3 7977
Year 4 8244 8244 8186
Year 5 8186 8076
7977 7981 8023
Year 6 8076 7774 7819 7748
7609
Year 7 7981 7506 7500
Year 8 8023
Year 9 7748
Year 10 7506
Year 11 7500
Data Source: SCC Schools Data
December 2020
Page 14 of 953. Parent and carer consultation on childcare
A parental consultation in November 2020 resulted in 259 responses. The highest number
of responses came from Haverhill and the lowest from Lowestoft North and Forest Heath.
We asked parents/carers where they preferred to access childcare. Of the 259 people who
responded to this question, 76.4% said they preferred accessing childcare close to their
home.
In which location do you use or
need childcare?
4.6%
0.0% Near to home
8.5%
Near to work
10.4%
Near to place of study /
training
Near to a school
76.4%
Other (please specify):
December 2020
Page 15 of 95We also asked if parents/carers had any problems accessing childcare in their preferred
location and 255 people responded to this question - Please see table of the responses
below.
Have you any particular problems
accessing childcare at your preferred
location?
No childcare providers in
my area of choice
Childcare providers full
4.3%
5.9% 8.6% Childcare providers don't
offer the hours I need
9.4% 1.2%
Childcare providers limit
the number of funded
hours I can have
14.5%
The cost of childcare is
too high for me
71.4% 0.8%
Childcare providers do
1.6% not cater for my child's
needs
Childcare providers do
not cater for my child's
age group
I have the childcare I need
Other (please state):
December 2020
Page 16 of 95The consultation asked parents/carers the type of childcare they used. Please see table of
responses below.
Which of the following types of child
care do you use for your
children?(please tick the type of
childcare and the age of the child /
children you use it for)
200
150
Aged 9+
100 Aged 7-8
50 Aged 5-6
0 Aged 3-4
Aged 2
Aged under 2
The consultation asked why parents/carers needed childcare? Please see table of
responses below.
Why do you need childcare? (please
tick all that apply)
5.8%
To access funded early
0.4%
education for my 2 year
old
25.1% To access funded early
52.3% education for my 3 or 4
year old
To enable me to work
To enable me to take up
73.3%
training
56.8%
For my child's learning and
development
4.9%
For my child to socialise
December 2020
Page 17 of 95We asked parents/carers when they needed childcare. Please see tables of responses
below.
When do you need it? If you need
childcare for more than one child,
use a column for each child. (please
tick all that apply)
250
200
Aged 9+
150
Aged 7-8
100
Aged 5-6
50
Aged 3-4
0
Aged 2
Aged under 2
Parents/carers were asked how they would like to hear about childcare options? Please
see table of responses below.
What way(s) would you like to hear
about childcare options?
300
250
200
150
100
50 Not very likely
0 Very likely
December 2020
Page 18 of 95We asked parents/carers about their awareness and use of types of support for families
with childcare? Please see tables of responses below.
Are you aware of any of the
following that are available to
support families with childcare?
300
250
200
150
No
100 Yes
50
0
2 year old 30 hours funded Universal (15 Tax Free
funded childcare hours) early Childcare
childcare education
Do you access one of the following
benefits to help you pay for
childcare?
Tax Free Childcare
(children aged 0 to 11 or
31.4% 16 if disabled)
Tax Credits for Childcare
(children aged 0 to 15)
53.7%
Universal Credits for
Childcare (children aged
14.9%
0 to 16)
December 2020
Page 19 of 954. Provision for children with special educational needs and
disabilities
Number of children with SEND
The local authority has a duty to secure sufficient childcare for children with special
educational needs and disabilities (SEND) up to the age of 18.
The number of children with an Education, Health and Care (EHC) plan in Suffolk is 5740
Table 3
Number of
Age
children
Birth to school age 70
Primary school (reception to year six) 1986
Secondary school (year seven to thirteen) 2570
Colleges, Specialist Post 16 institutions,
other FE, apprenticeships, supported 1114
internships
All EHCP pupils @ 31 March 2020 5740
Children’s needs change over time and are identified at different ages. Among the
youngest children, SEND may only be identified when they start in childcare or school, and
it can take some time from concerns being identified to an EHC plan being issued. It is
therefore inevitable that the number of children with SEND aged 0-4 is an underestimate.
The majority of children receiving support for SEND do not have an EHC plan as their
needs are met without the need for one.
SCC strategically plans support for children with SEND in order to meet the needs of all
children as required by SEND Code of Practice: 0 to 25 years (January 2015).
Under the Equality Act 2010, admission to a provision cannot be denied or a child
excluded due to a child’s health or developmental needs. Providers must support and
enable all children with SEND to access their provision and the Early Years Foundation
Stage. They must provide an inclusive environment which reflects their duty to promote
equality and their obligations as outlined in the Act.
SCC works with parents/carers and providers to remove barriers of access to early
education and to support all children to fulfil their potential.
SCC ensures it meets its duties under the Equality Act 2010 when securing early
education places.
SCC support parents to find childcare provision to meet their child’s needs. To assist with
this the Suffolk InfoLink website has a Local Offer section for every provider. This provides
clear, accessible, and accurate information about the services available for children and
young people with SEND. To ensure the information provided meets the needs of parents
and carers, SCC co-produced a guidance document with Suffolk Parent Carer Network.
This guide outlines key information parents and carers want to see included in the record
of an organisation or provider, so that they can easily understand whether the support
December 2020
Page 20 of 95would be relevant for their child. SCC encourages all providers to complete their local offer
using this guidance.
SCC supports providers to offer an inclusive environment. All members of the LoP are
eligible to apply for the following SEND funding strands for any eligible children accessing
any part of their early education funding with them. This funding is a contribution to the
provider’s total resource to support them to meet the needs of the child and to enable the
child to be effectively included.
Inclusion funding; this fund is to support the provider to meet the emerging needs of a
children who are aged two, three and four years This is a one off payment, for one term
only.
Disability Access Fund (DAF); this funding is eligible for three and four year olds in receipt
of Disability Living Allowance (DLA).
Early Years High Needs (HN) funding; this funding is for eligible children aged, two, three
and four years, whose special educational needs are significant and complex. HN funding
payments are made directly to the provider and equate to the number of hours the child
attends the provision.
Childcare Support Funding (CSF); this funding is for children with significant additional
needs, aged from three months until the term after the child’s second birthday.
There are a small number of two, three and four year olds with SEND who have a special
school assessment nursery placement and also attend Early Years and Childcare
provision.
SCC delivers a range of training to support providers to deliver inclusive practice.
SCC challenges providers not meeting their duties under the Equality Act 2010.
Childcare providers in receipt of early education funding agree to the following terms and
conditions under the LoP.
As set out in Section G – Equality and Inclusion. SCC will promote equality and inclusion,
particularly for disadvantaged families, children in care, children in need, children with
disabilities and children with special educational.
As set out in Section F – Removal from the LoP. SCC will remove the provider from the
LoP if they fail to comply with its legal duties under the Equality Act 2010
In addition to support, guidance and challenge to our childcare providers SCC works in
partnership with colleagues in health, Suffolk Family Carers and Home-Start to deliver
EarlyBird (under five years) and EarlyBird Plus (ages four – nine). These are support
programmes for parents and carers offering advice and guidance on strategies and
approaches for supporting young children with autism.
December 2020
Page 21 of 955. Supply of childcare, Suffolk picture
Number of Early Years Providers
In total, there are 707 Ofsted registered childcare providers in Suffolk local authority.
593 are on the LoP and are in receipt of early education funding. 114 are offering childcare
which is funded directly from the parent/carer. They do not offer early education funded
places and are not on the LoP.
Table 4
Type of provision LoP Non LoP Total
Childminders* 210 107 317
Day nurseries 122 4 126
Nursery classes in schools / 103 0 103
Academy nursery classes
Nursery units of independent 14 3 17
schools
Pre school play group 144 0 144
TOTAL 593 114 707
*this includes childminder agencies. The data in this table was correct on 1 Dec 2020
LoP and Non LoP Priority support grid
All Providers in Suffolk - LOP and Non LOP
December 2020
Page 22 of 95Providers on the LOP
Childminders
Day nurseries
24%
36%
Nursery classes in schools /
2% Academy nursery classes
17% Nursery units of independent
schools
21%
Pre school play group
Providers on the Non LOP
3%
3% Childminders
Day nurseries
Nursery classes in schools /
Academy nursery classes
Nursery units of independent
schools
94%
Pre school play group
Number of school age providers and places
Tracking the supply of childcare for school age children is difficult because not all of this
provision is independently registered with Ofsted. For example, it may come within a
school’s registration. Parents may also use provision which is not considered ‘childcare’,
for example sports or arts clubs which take place after school or in the holidays. For these
reasons we have not included data on the number of places available.
SCC offers a childcare brokerage service for parents requiring assistance finding suitable
childcare. SCC proactively work with providers to address gaps in the childcare market.
December 2020
Page 23 of 956. Funded early education
Introduction to funded early education
Some children are entitled to childcare, funded by the government. These entitlements are
for 38 weeks per year. It is the local authority’s duty to administer this funding and make
the payments to the providers each term.
• All three and four year olds in England are entitled to 570 funded hours per year. It is
usually taken as 15 hours per week for 38 weeks of the year. This entitlement is available
until they start in reception class in school. This is referred to as their ‘Universal’
entitlement.
• Children aged three and four, from working families who meet the criteria set out by the
Department for Education (DFE), are entitled to ‘up to’ an additional 570 funded hours per
year. These 570 funded hours are referred to as the ‘Extended’ entitlement. Collectively
the 1140 hours is often referred to as 30 hours.
• Children aged two whose families receive certain benefits (including low income families in
receipt of in-work benefits), or those who meet additional non-economic criteria , are
entitled to 15 hours per week. In England about 40% of two year olds are entitled to this
offer, but the proportion varies by area.
Parents do not have to use all the hours of their funded entitlement. They may choose to
split them between providers. With the agreement of their provider, parents may also
spread them across the year – for example, rather than taking 15 hours for 38 weeks a
year they could take just under 12 hours for 48 weeks a year. Or rather than taking 30
hours for 38 weeks a year they could take 23.75 hours for 48 weeks a year. This is
referred to as a stretched offer.
Parents may choose to pay for additional hours on top of the funded entitlement.
In addition to securing funded places, the local authority is required to secure sufficient
childcare places for all children, including under twos and out of school care.
Proportion of 2 year olds entitled to funded early education
In Suffolk approximately 28% of 2yr olds in Suffolk are eligible for funded childcare under
the economic criteria.
However, this does not include any children eligible under additional criteria i.e CiN
children which means the actual percentage is likely to be higher.
In Suffolk 73% of eligible two year olds take up a funded place
In Suffolk this equates to 21% of all 2yr olds in Suffolk taking up a place.
2yr olds in Eligible 2yr % eligible in Funded 2yr % funded % funded
Suffolk olds (DwP) Suffolk olds (SCC) (of those (all children
(ONS 2019) eligible) in Suffolk)
7995 2273 28% 1662 73% 21%
Spring Term Census Data 2019
December 2020
Page 24 of 95Take up of funded early education
The proportion of eligible children taking up their funded place (for at least some of the
available hours) in Suffolk is:
Table 6
Age % of eligible
children
Age 2 73%
Age 3 91%
Age 4 96%
Age 3 and 4 94%
Comparison of take up of funded early education 2016 -2019
Table 7
Age 2019 2018 2017 2016
Age 2 – targeted 73% 79% 85% 81%
Age 3 and 4 94% 94% 94% 95%
December 2020
Page 25 of 957. Three and four-year-old funded entitlement – 30hrs
Parents can check their eligibility and apply for their 30 hour code online through the
Government’s Childcare Choices website. The same website is used to apply for ‘Tax Free
Childcare' and parents can apply for either or both. If a parent is eligible for a 30 hour
place for their child, the system creates a code which they can used with their chosen
childcare provider. If they are ineligible, they will still be entitled to the universal 15 hours of
early education and childcare and may choose to pay for additional hours themselves.
Prior to the 30 hours childcare policy being introduced in September 2017 the DfE
indicated that in Suffolk around 51% of three and four year olds would be eligible. The
policy came into effect from 1 September 2017. To prepare for implementation we
calculated half of the three and four year old population would require an additional 15
hours and built this into our sufficiency calculations.
After the first year of this policy implementation, analysis showed that 23% of three and
four year olds accessed their 30 hour codes, however analysis in summer 2019 showed
48% accessing their 30 hour codes. This Is very close to the 51% figure given by the DfE
initially.
We will continue to analyse this data each term and once the policy is embedded, we will
replace the estimated 51% with the actual take up percentage.
30 hr codes used in Suffolk
Table 8
Step Number of families Number of families
in Suffolk in England
Eligible codes 5070 419,130
issued
Eligible codes 4905 395,249
validated The data in this table is
% validated 97% 94% based on Department for
Education data in July
2019 (not data for 2020)
Data from DFE illustrated above shows an increase in codes validated in Suffolk from September
2018 and now exceeds England’s overall average.
December 2020
Page 26 of 958. Funded early education places available
Funded early education places available
SCC administers early education funding on behalf of the government to providers on the
LoP. Providers are not required to join the LoP and offer funded places to parents.
Providers who choose to offer funded education must publish their funded offer. Some
providers offer funding very flexibly, some restrict the number of funded places and others
restrict the times funded places are available.
Table 9
Type of provision offering early Number of
education funding providers
Childminders 210
Day nurseries 122
Nursery classes in schools / 103
Academy nursery classes
Nursery units of independent 14
schools
Pre school play group 144
ALL 593
Type of Provider offering early
education
Childminders
Day nurseries
24%
36%
Nursery classes in schools /
2% Academy nursery classes
17% Nursery units of independent
21% schools
Pre school play group
Places available – 30 hours (51%) Suffolk picture
December 2020
Page 27 of 95Table 10
Eligible 2s 3 and 4yr Total FTE Spaces Sold Places Surplus or
olds (inc 51% spaces available (FTE) Deficit after
extra) needed from sold places
Providers deducted
(FTE)
2048 23,341 11,671 12,868 2599 -1402
*Places available refers to FTE available in a week
Table 11 illustrates the total number of Full time Equivalent places needed and available
for every eligible two year, for three year olds and all four year olds have their universal
entitlement plus 51% predicted for the additional 15 hours required to fulfil the 30 hour
policy. This table shows that, based purely on statistical data and without taking additional
demand from new housing, there is a deficit of -1402 FTE places across Suffolk.
December 2020
Page 28 of 95Early education places at cluster level
Table 11
Planning proposals are not taken into account in the figures in this table
Cluster Eligible 2s, Total FTE Spaces Places Places
3 and 4 yr spaces available available available
olds needed from Surplus or Surplus or
(baseline plus Providers Deficit Deficit (with
30 hours (after SOLD migration
projection) places considered)
deducted)
Bury St. 964 693 881 188 87
Edmunds
Felixstowe 605 433 316 -117 -108
Forest Heath 1922 1404 883 -521 -579
Framlingham 602 433 462 30 89
and Leiston
Haverhill 938 679 593 -86 -90
High Suffolk 460 336 377 41 21
Ipswich East 1178 854 874 20 4
Ipswich North 1094 795 563 -232 -332
Ipswich West 1815 1279 870 -409 -296
Lowestoft North 970 674 621 -53 -129
Lowestoft South 798 568 425 -143 -68
South Suffolk 602 437 568 131 65
Stowmarket 830 604 637 33 -15
Sudbury 963 697 659 -38 -61
Thurston 700 511 394 -117 -93
Waveney and 734 526 425 -101 -138
Blyth
Woodbridge and 1023 752 721 -31 -73
Kesgrave
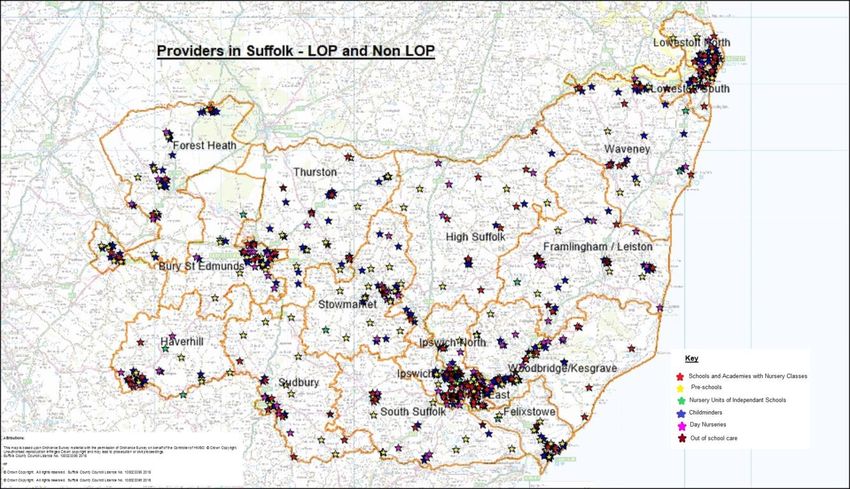
Suffolk 16198 11671 10269 -1402 -1713
Slight numerical differences may occur in calculations due to rounding up of data within Sufficiency Grid
• This data was correct and taken 7 December 2020.
Data Source: 2021 SCC Sufficiency Grid
December 2020
Page 29 of 95Migration considered by cluster
Places available - Surplus or deficit by Cluster
86.5 89 20.5 4 65
-108 -89.5 -128.5 -68 -15 -61 -92.5 -137.5 -72.5
-295.5
-331.5
-578.5
LOWESTOFT SOUTH
IPSWICH WEST
BURY ST EDMUNDS
FOREST HEATH
LOWESTOFT NORTH
STOWMARKET
WAVENEY & BLYTH
FELIXSTOWE
HAVERHILL
IPSWICH NORTH
SOUTH SUFFOLK
WOODBRIDGE/KESGRAVE
IPSWICH EAST
THURSTON
HIGH SUFFOLK
SUDBURY
FRAMLINGHAM/LEISTON
Map – surplus or deficit with migration considered
This does not include additional demand from new housing
December 2020
Page 30 of 959. Hourly rates
Hourly rate paid by Suffolk County Council
Suffolk receives funding from the government. The amount is determined by the National
Funding Formula. This is distributed to providers based on their termly claims. The funding
comprises of an hourly rate plus deprivation funding and inclusion funding for eligible
children. Providers also receive Early Years Pupil Premium (EYPP) and Disability Access
Fund (DAF) funding for eligible three and four year old children.
In December 2019 the DFE published the funding rates for Early Years and Childcare for
2020/21. The Suffolk rates are:
two year olds £5.28 per hour
three and four year olds £4.13 per hour
Hourly rate charged by providers
For early years childcare outside the funded entitlements, SCC reports on the average rate
per hour, as reported to SCC by providers.12 There may be variations to rates based on
the number of hours a family uses, with reductions for longer hours, or discounts for sibling
groups. There may be additional rates for additional services, for example, lunch and other
meals which are not included in these charges.
Hourly rate Private, voluntary Nursery Units of Childminders
and independent Independent
nurseries Schools
Average of known £5.18 2yr olds £24.81 per session £4.38
providers £4.84 3 and 4yr
olds
Source: SCC
Mean hourly fee band for Suffolk
Mean hourly Fee England East of England Suffolk
3 and 4yr old pre- £5.04 £5.03 £4.25
school children
2yr old children £5.16 £5.11 £4.50
Data source: DfE Childcare and Early Years Childcare providers survey 2019 (please note 2020 data not
published because of COVID)
December 2020
Page 31 of 9510. Quality of childcare
Ofsted inspection grades
All childcare providers must register with and be inspected by Ofsted, who gives them an
overall grade for the quality of their provision. Childminders and private and voluntary
providers are on the Early Years Register, and schools and standalone maintained nursery
schools are on the Schools Register. The grades for both registers are equivalent. Schools
with nurseries have an overall inspection grade for the whole school and many also have a
separate early years’ grade.
Both schools and early years providers have four possible Ofsted grades: ‘outstanding’,
‘good’, ‘requires improvement’, and ‘inadequate’.3 Some providers are still awaiting their
first full inspection. These providers are excluded from our calculation.
Nursery classes in independent schools do not generally have an Ofsted grade.
Outstanding Good Requires Inadequate
Improvement
All 17% 78% 4% 1%
Childminders 15% 79% 5% 1%
Childcare on non- 18% 77% 3% 1%
domestic premises
Ofsted Data as of 31st Aug 2020
Comparing inspection grades over time
% of providers ‘good’ or Aug 2020 Aug 2019 Aug 2018 Aug 2017
‘outstanding’
All 95% 94% 95% 92%
Childminders 94% 94% 96% 91%
Childcare on non-domestic 95% 94% 96% 94%
Premises
Ofsted Data as of 31st Aug 2020
December 2020
Page 32 of 9511. Plans for sufficiency work in 2021
SCC will
• use 2019 Office of National Statistics (ONS) forecasts to place plan.
• plan to forecast population three to five years ahead.
• share our sufficiency knowledge with existing and potential providers so that new provision
is developed in the places where there is a demand.
• initiate discussions with providers where we identify a deficit of provision in an area to
encourage them to review their offer and explore ways to create more places.
• support providers when necessary to address viability issues by reviewing their current
offer and suggesting changes which would better meet the needs of families.
• annually survey parent and carers to find out their childcare needs.
• monitor take up of 30 hours.
• monitor sold places impacting on early places available – developing a user friendly
system for capturing the data.
• work in partnership with Schools Infrastructure and Strategic Planning to deliver sufficient
places in response to housing development and to further refine forecasting methods and
incorporate any planned housing delivery.
• work closely with Schools Infrastructure colleagues to develop early years places along
with school building projects to achieve economies of scale.
• make best use of SCC properties and other public sector assets.
• maximise developer contributions to extend existing provision or to create new provision
• review lease agreements with providers in SCC buildings encourage providers, where
appropriate, to extend their opening hours to become ‘full day-care’ i.e. eight to six all year
round and to move away from sessional term time practices.
• share ideas and good practice with other LA’s to learn from them and trial new.
approaches.
• take advantage of any projects made available by the DfE to create additional places.
December 2020
Page 33 of 9512. Methodology
• Number of children: The data for children under five comes from the Office of National
Statistics (ONS) and the school age children data comes from the school census within the
local authority.
• Children with EHC plans: based on data held by Suffolk local authority
• Supply of childcare: based on data provided to SCC by Ofsted, who regulate early years
provision in schools and childcare provision. In some cases, we have supplemented this
with local intelligence where providers are not registered with Ofsted.
• Funded early education: data on take up of funded early education entitlements is based
on the Early Years and Schools Censuses, which are taken every January and published
by the Department for Education in the statistical collection Education provision: children
under five years of age. Data on entitlement to a funded early education place for two year
olds is provided by the Department for Work and Pensions.
• Sold places were calculated by taking a countywide sample from each type of childcare
provider. A percentage was then calculated, and this was applied to the relevant type of
provider across Suffolk. The sample data was based on the places sold in Summer 2019.
This was because this term reflected the most typical term where capacity is at greatest
demand previous to the Covid 19 pandemic.
• Price of childcare: This is an average based on the prices that childcare providers have
told us they charge
• Quality of childcare: data on childcare quality is provided by Ofsted.
• IMD data 2019 has been used for Deprivation
Cluster level data
All data used for sufficiency within the local authority is based on the summer term. This is
because SCC is aware that this will be the busiest term for childcare providers when most
four year olds will be in a setting as many move to school in the Autumn term.
To calculate sufficiency we use the same information as noted throughout this document:
• ONS population estimates for three and four year olds. We use 2/3rds (66%) of three year
olds and all four year olds, to take into account that three year olds are eligible the term
after they turn three.
• 51% of three and four year olds to calculate for 30 hour entitlement
• DfE data for number of eligible two year olds
• Provision registered on SCC List of Providers (as provided by Ofsted) to calculate places
available
December 2020
Page 34 of 95Take up data at cluster level
• SCC uses all funding claims received and removes duplicates.
• Out of county children are included in this report. This decision is based on the likelihood
that for every child funded in Suffolk who lives out of county, there will be a Suffolk child
who attends a setting in a neighbouring county and is therefore funded by them.
• SCC calculates a child’s date of birth based on the first date in the term. For summer 2019
data 01/04/2019 was used.
• As take up is calculated against a baseline we include four year olds who are in school
reception classes. However, this has less impact in the summer term.
Migration considered at cluster level
• To factor migration, we look at funding claims (detailed above).
• To calculate migration out we look at where children live (by postcode) and how many
attend a setting in the same cluster or in another cluster.
• To calculate migration in we look at all the settings within a cluster and whether the
children who attend live in the cluster or outside it (in another cluster.)
• These two figures give us a net migration percentage, this has been applied to the
population to calculate a surplus / deficit that considers migration.
December 2020
Page 35 of 9513. References
Early Education and Childcare Statutory guidance for local authorities: 2018 Department
for Education
https://www.gov.uk/government/publications/early-education-and-childcare--2
Childcare and Early Years Providers Survey: 2018 Department for Education
https://www.gov.uk/government/statistics/childcare-and-early-years-providers-survey-2019
Childcare Survey 2020 Family and Childcare Trust
https://www.familyandchildcaretrust.org/childcare-survey-2020
Education provision: children under 5 years of Age January 2020 Department for
Education
Education provision: children under 5 years of age, Reporting Year 2020 – Explore
education statistics – GOV.UK (explore-education-statistics.service.gov.uk)
Childcare Providers and inspections as at 31st August 2020 Ofsted
Childcare providers and inspections as at 31 August 2020 - GOV.UK (www.gov.uk)
Suffolk Observatory Deprivation Suffolk County Council
https://www.suffolkobservatory.info/deprivation/
https://www.healthysuffolk.org.uk/uploads/Indices_of_Deprivation_2019_Shortpdf.pdf
https://www.gov.uk/government/uploads/system/uploads/attachment_data/file/845345/File
_7_-
_All_IoD2019_Scores__Ranks__Deciles_and_Population_Denominators_3.csv/preview
December 2020
Page 36 of 95Appendix 1 Cluster level details
Clusters by ward
Bury St Edmunds
• Abbeygate
• Barrow
• Chedburgh & Chevington
• Eastgate
• Horringer
• Minden
• Moreton Hall
• Risby
• Southgate
• St Olaves
• Tollgate
• Westgate
Thurston
• Bardwell
• Barningham
• Elmswell & Woolpit
• Ixworth
• Pakenham & Troston
• Rickinghall
• Rougham
• Stanton
• The Fornhams & Great Barton
• Thurston
• Walsham-le-Willows
Forest Heath
• Brandon Central
• Brandon East
• Brandon West
• Exning
• Iceni
• Kentford and Moulton
• Lakenheath
• Manor
• Mildenhall Great Heath
• Mildenhall Kingsway and Market
• Mildenhall Queensway
• Newmarket East
• Newmarket North
• Newmarket West
• The Rows
December 2020
Page 37 of 95Sudbury
• Assington
• Box Vale
• Bures St Mary & Nayland
• Chadacre
• Great Cornard
• Lavenham
• Long Melford
• Sudbury North East
• Sudbury North West
• Sudbury South East
• Sudbury South West
Haverhill
• Clare, Hundon and Kedington
• Haverhill Central
• Haverhill East
• Haverhill North
• Haverhill South
• Haverhill South East
• Haverhill West
• Whepstead & Wickhambrook
• Withersfield
Lowestoft South
• Carlton & Whitton
• Carlton Colville
• Kessingland
• Kirkley & Pakefield
Lowestoft North
• Gunton & St Margarets
• Harbour & Normanston
• Lothingland
• Oulton Broad
Waveney Blyth
• Beccles & Worlingham
• Bungay & Wainford
• Halesworth & Blything
• Southwold
• Wrentham, Wangford & Westleton
December 2020
Page 38 of 95Ipswich North
• Alexandra
• Castle Hill
• Claydon & Barham
• Rushmere
• St Margarets (Ipswich)
• Whitton (Ipswich
Ipswich West
• Blakenham
• Bramford
• Bridge
• Gipping
• Sprites
• Sproughton & Pinewood
• Stoke Park
• Westgate (Ipswich)
• Whitehouse
South Suffolk
• Brantham
• Brett Vale
• Capel St. Mary
• Copdock & Washbrook
• East Bergholt
• Ganges
• Hadleigh North
• Hadleigh South
• Orwell
• South East Cosford
• Stour
Woodbridge/ Kesgrave
• Carlford & Fynn Valley
• Deben
• Kesgrave
• Martlesham & Purdis Farm
• Melton
• Rendlesham & Orford
• Woodbridge
December 2020
Page 39 of 95Ipswich East
• Bixley
• Gainsborough
• Holywells
• Priory Heath
• Rushmere St Andrew
• St Johns
Felixstowe
• Eastern Felixstowe
• Orwell & Villages
• Western Felixstowe
Framlingham/ Leiston
• Aldeburgh & Leiston
• Framlingham
• Kelsale & Yoxford
• Saxmundham
• Wickham Market
Stowmarket
• Bacton
• Battisford & Ringshall
• Chilton
• Combs Ford
• Haughley, Stowupland & Wetherden
• North West Cosford
• Onehouse
• Rattlesden
• St Peter’s
• Stow Thorney
High Suffolk
• Debenham
• Eye
• Fressingfield
• Gislingham
• Hoxne & Worlingworth
• Mendlesham
• Needham Market
• Palgrave
• Stonham
• Stradbroke & Laxfield
December 2020
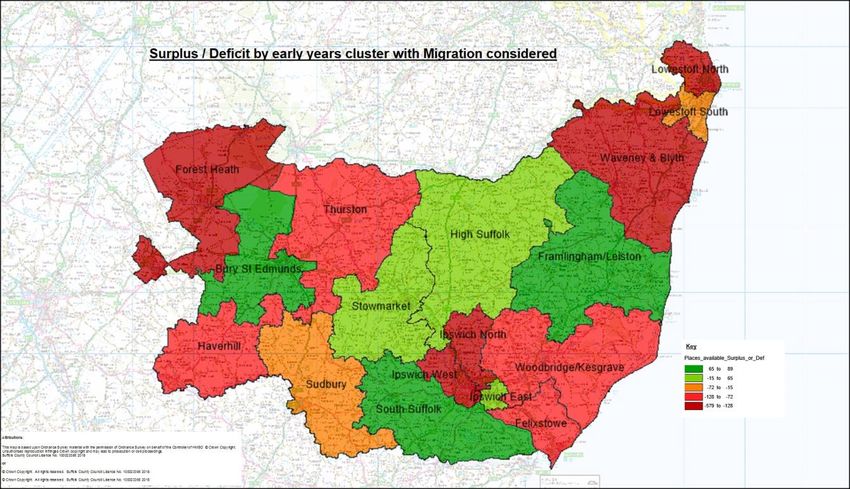
Page 40 of 95Section 1.01 Cluster sufficiency overview – Bury St Edmunds
Map of Bury St Edmunds cluster – all providers
Table 1 No. of providers for cluster
Provider Type LOP Non LOP
Childminder 18 4
Day nursery 11 1
Nursery units of 2 1
independent Schools
Pre-school playgroup 8 0
State school nursery 6 0
class
Out of school care 0 3
Data Source: LoP and Non LoP priority support grid 1 Dec 2020
Table 2 Places available for cluster (LOP only)
Total Baseline Population 964
(eligible 2s and 3s plus 4yr olds)
Total FTE needed to meet the 693
population
(baseline plus 30 hours projection)
Total places available (after SOLD 881
places deducted)
Surplus / deficit places 188
Slight numerical differences may occur in calculations due to rounding up of data within Sufficiency Grid
Data Source: 2021 SCC Sufficiency Grid
December 2020
Page 41 of 95Table 2a Places available for cluster (LOP only) with migration considered
NET migration* 5.8%*
Total Baseline Population 1103
(adjustment with migration considered)
Total FTE needed to meet the 795
population
(adjustment with migration considered)
Total places available (after SOLD 881
places deducted)
Surplus / deficit places 87
Slight numerical differences may occur in calculations due to rounding up of data within Sufficiency Grid
Data Source: 2021 SCC Sufficiency Grid
* A positive number means more children migrated into the cluster for places than
migrated out. A negative number means more migrated out.
Table 3 Current take up for cluster
Eligible 2yr olds 95%
3yr olds 103%
4yr olds 103%
Data Source: SCC take up data Summer 19
The Bury St Edmunds cluster consists of 12 wards;
Abbeygate, Barrow, Chedburgh & Chevington, Eastgate, Horringer, Minden, Moreton Hall,
Risby, Southgate, St Olaves, Tollgate, and Westgate.
Some LSOAs within the Abbeygate, Minden, St Olaves and Tollgate wards fall within
deciles one, two or three (most deprived).
The take up of funded two-year-old places at 95% exceeds Suffolk’s overall take up for
two year olds which is 73%. The take up for funded three- and four-year olds is 103% for
both age groups, higher than Suffolk’s take up of 91% for 3 year olds and 96% for 4 year
olds.
There are two main factors to consider as to why the three and four year old take up
exceeds 100% of the three and four year old population. One is because some children
will be migrating from another cluster to access provision in this cluster. These children are
not included in the population. Secondly, population data is used as a baseline and there
may be an underestimate of the number of three and four year olds living in this cluster.
The data illustrates a surplus of 188 places across the Bury cluster, but when migration of
children in and out of the cluster is taken into account there remains a surplus of 87
places. 55% of children living in Bury migrate out of the cluster. However, 60.8% of
children attending Bury cluster provision have come from other clusters, predominantly
Stowmarket. SCC is encouraging local providers to network and support each other to
meet parental demand in wards with high demand or, where there is additional housing
growth, new places are being developed.
Several full day care providers in the Bury St. Edmund’s cluster report high numbers of
children, especially babies attending their provision.
December 2020
Page 42 of 95You can also read