Distributional Impacts of Transport Schemes
←
→
Page content transcription
If your browser does not render page correctly, please read the page content below

Distributional Impacts of Transport Schemes:

Winners and Losers of Streetspace Allocation Exercises

   Case Study: Bloxwich High Street, West Midlands

             Peter Jones and James Paskins
            Centre for Transport Studies, UCL

Appendix:
 User Guide for the Distributional Impacts Spreadsheet

             James Paskins and Peter Jones
            Centre for Transport Studies, UCL

                                        Revised March 2008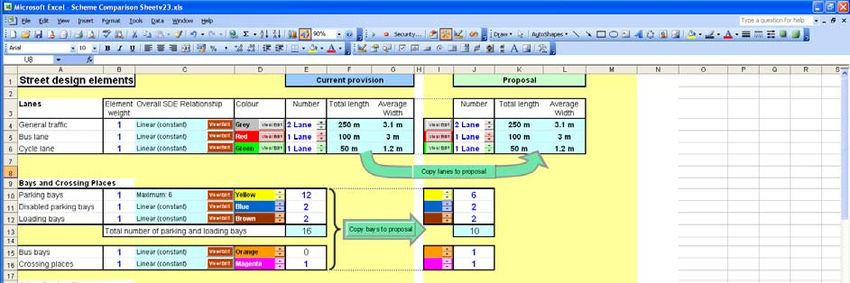
Contents

 1.      Introduction .............................................................................................................................. 3

 2.      Primary dimensions for developing street design options ....................................................... 4
      2.1     Street width ..................................................................................................................... 5
      2.2     Street length .................................................................................................................... 6
      2.3     Timing of provision ........................................................................................................ 6
      2.4     Layout/pattern of provision............................................................................................. 6

 3.      Stages of the street design and appraisal process..................................................................... 8

 4.      Stages and inputs to the street appraisal process...................................................................... 8
      4.1     Determination of street type ............................................................................................ 8
      4.2     Determination of relevant stakeholder groups and desired activities ............................. 9
      4.3     Determination of types of required street elements ...................................................... 10
      4.4     Determine desired levels of local provision.................................................................. 11
      4.5     Determine net levels of on-street provision .................................................................. 11
      4.6     Generating design options............................................................................................. 12
              Characterising key features of different street design options ..................................... 13
      4.7     Appraising design options............................................................................................. 13
              Weighting different components of the appraisal ......................................................... 14
      4.8     Assessing ‘winners’ and ‘losers’, and net benefits ....................................................... 14

 5.      Illustrative study for exploring distributional impacts ........................................................... 15

 6.      Application of the distributional impacts spreadsheet ........................................................... 16
      6.1     The main stages of the process ..................................................................................... 16
      6.2     Street User/Design Elements ‘Benefits Matrix’............................................................ 16
      6.3     Assessing scheme impacts (no weighting) ................................................................... 16
      6.4     Addition of street user/design element weightings ....................................................... 17
      6.5     Dealing with degrees of provision and diminishing returns ......................................... 19
      6.6     Customising street design element relationships .......................................................... 20

 7.      Scope for further development............................................................................................... 21
      7.1     Taking into account the duration of provision .............................................................. 21
      7.2     Taking into account the location of provision .............................................................. 21
      7.3     Varying the number of Street User Groups and Street Design Elements ..................... 22
      7.4     Empirical data on user needs ........................................................................................ 22
      7.5     The treatment of running lanes ..................................................................................... 22
      7.6     Weights ......................................................................................................................... 22

 8.     Case study: applying the scheme comparison spreadsheet .................................................... 22
      8.1    The case study area ....................................................................................................... 22
      8.2    Stakeholder street designs ............................................................................................. 24
      8.3    Final street design ......................................................................................................... 25
      8.4    Comparing all scheme options in the Bloxwich case study .......................................... 25

      References .................................................................................................................................. 27

                                                                         1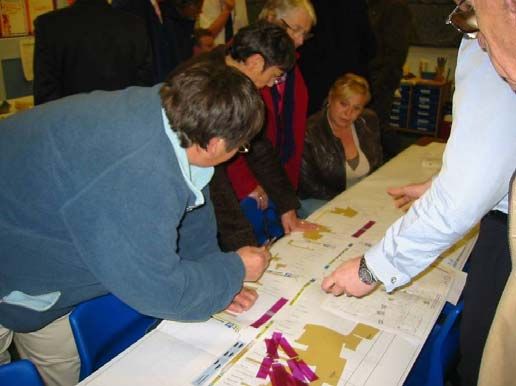
User Guide for the Distributional Impacts Spreadsheet..................................................................... 28

   Appendix A: Using the Scheme Comparison spreadsheet............................................................. 29
     Layout of the Inputs&Impacts sheet .......................................................................................... 30
     Section I ..................................................................................................................................... 31
     Street Design Element weight .................................................................................................... 31
     Relationship ............................................................................................................................... 31
     Street Design Elements present in current provision................................................................. 34
     Section II .................................................................................................................................... 37
     Section III................................................................................................................................... 38

   Appendix B: Defining custom relationships .................................................................................. 40
     Adding a straight section............................................................................................................ 41
     Adding a curved section............................................................................................................. 42
     Adding a cut off point ................................................................................................................ 43
     Resetting relationships and defining new relationships ............................................................. 44
     Storing and using a user defined relationship ............................................................................ 45
     Selecting a user defined relationship ......................................................................................... 47
     Returning to the Inputs&Impacts sheet...................................................................................... 48
     Using a user defined relationship in the Benefits Matrix........................................................... 48

                                                                          2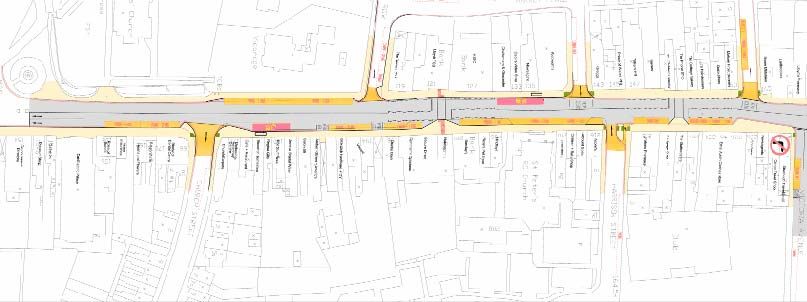
1.     Introduction
This report has been produced as part of the four-year EPSRC-funded DISTILLATE Project, which
is intended to develop improved tools and processes to assist local authorities in developing and
delivering more sustainable transport policies. This study is concerned with developing methods
for examining the distributional impacts of the appraisal of transport schemes, in particular with
appraising scheme designs that are concerned with streetspace allocation. It complements

Urban streets make physical provision for a wide variety of activities, both on the carriageway and
on the footway. These can be broadly associated either with meeting the needs of street users
undertaking ‘Link’ activities or ‘Place’ activities (Jones, Boujenko and Marshall, 2007), the former
relating to movement through the area, and the latter to the use of the street as a destination in its
own right.

Link-related activities require space allocation in the form of design elements that are largely
continuous in nature, such as traffic running lanes, bus and cycle lanes, clear footways, etc. plus
pedestrian crossings at junctions.

Place-related activities are much more varied and less continuous in their requirements (Jones,
Roberts and Morris, 2007), and can include the need for provision for:
   • Seating and other footway public amenities
   • Bus stops, and associated shelters, lighting, information and seating
   • Footway parking for cycles and kerbside parking for cars (differentiating between resident,
       blue badge and general public parking)
   • Kerbside provision for loading and for bus bays; and
   • Pedestrian crossing facilities between major road junctions.

Thus, any pattern of allocation of streetspace consists of design elements that provide specific levels
of provision of space/capacity for particular kinds of Link and Place activities carried out by certain
street user groups. Since streetspace is limited, it is not usually possible to meet the full aspirational
requirements of all groups of street users, so this usually implies that - under any streetspace
allocation design - some street user groups will gain at the expense of others.

This report describes the development and application of a method for comparing designs that have
different streetspace allocation patterns, in terms of their likely impacts on the various Link and
Place-related groups which use the street. These different design options will vary in their levels of
provision of the elements that make up a street, such as different numbers of parking bays, crossing
places or benches, for instance. Because each of the elements has a different relevance and utility
for each type of user, the different designs will impact differentially across the spectrum of street
user groups. By comparing a proposed streetspace allocation design with the existing situation, it is
possible to establish who gains and who loses under the proposed scheme(s). The approach has
been operationalised through the development of an Excel spreadsheet, which is described in more
detail in two Appendices to this report.

To the authors’ knowledge, there is no existing framework for systematically exploring the impacts
of street design options on different street user groups. The environmental justice and Accessibility
Planning literatures (see Upton and Jones, 2007) define stakeholders at a broader level of
population groups (e.g. based on household circumstances and relative geographical location). The
body of work most comparable in nature is that of ‘community impact assessment’ (Lichfield,
1996), but while it does consider the relevant stakeholder groups for a new road scheme, it does not
deal explicitly with detailed street level design options.

                                                    3
The work reported here uses the redesign of the high street in Bloxwich, West Midlands as a case
study for developing and applying the methodology, but the aim is to develop a general
distributional appraisal tool that can be applied to similar situations elsewhere. In Bloxwich, the
stimulus for the redesign exercise came from the decision of Walsall Council to implement a Red
Route along the A34, as part of a West Midlands wide initiative. This involves developing a
streetspace allocation design that meets a number of specific objectives, including reducing delays
to all road users, reducing traffic accidents and improving the number and quality of Place-related
design elements on the high street.

The planning and consultation process for the Bloxwich High Street redesign is fully described in
Jones and Thoreau (2007). This began with a ‘Planning-for-Real’ type exercise, in which design
groups composed of local business people and residents used scale colour blocks and acetates,
representing a broad range of potential street design elements, to develop streetspace allocation
design options. The final versions of these options were then computerised and converted to GIS
format in LineMap, a package developed by Buchanan Computing Ltd. LineMap can display these
options in both colour block and road line marking formats, and can automatically calculate the
numbers of each type of street element contained in each design option.

2.      Primary dimensions for developing street design options
Streets typically consist of three main components, as shown in Figure 1, namely: the Buildings, the
Footways and the Carriageway. The term ‘highway’ encompasses the ‘footway’ and the
‘carriageway’. In addition to this, the ‘street’ takes into account the buildings bordering the
highway. However, for the purposes of streetspace reallocation in this study, it was assumed that
the buildings and building line are fixed and that the main focus is on locating design elements on
the footway and the carriageway (i.e. within the Highway). However, the method could also deal
with situations where the street is more fundamentally reconfigured.

                                                  BUILDING

                                FOOTWAY                                       H         S
                                                                              I         T
                                                                              G         R
                                                       CARRIAGEWAY            H         E
                                                                              W         E
                                                                              A         T
                                                                              Y
                                FOOTWAY

                                                  BUILDING

Source: Jones, Roberts and Morris (2007), Figure 1.1
                                  Figure 1: The main components of a street

Within the Highway, streetspace allocation design options are defined and constrained in three
dimensions:

     1. The width of the street
     2. The length of the street, and
     3. The timing of provision

                                                          4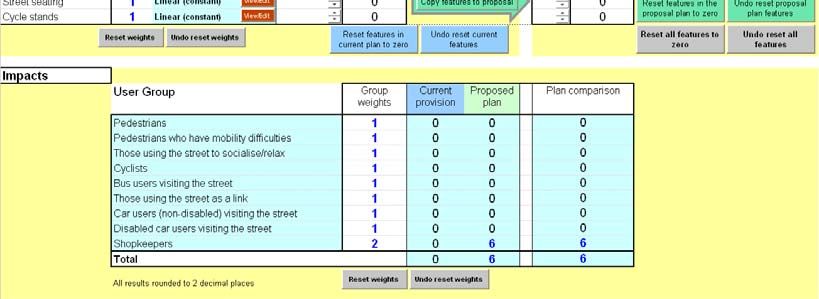
Each street design element occupies certain amounts of street width and length, and operates at
specified points in time. Unless a major redevelopment is proposed as part of the scheme, then the
overall width and length of the high street are generally fixed. In such tightly constrained
situations, the timing of streetspace provision can provide a useful way of accommodating more
user needs within a finite space, by varying the allocated uses by time of day, day of the week, or by
season.

There is also considerable scope for adapting designs to meet local needs through the details of the
layout of provision (although this is not currently captured in the LineMap summary of provision,
as discussed later in this report).

2.1          Street width
Street width is generally the most constraining of the design dimensions and, to varying degrees,
needs to accommodate three broad kinds of street activities:

      (i) Footway activities, associated both with Link and Place street user groups
      (ii) Kerbside activities, from bus bays to parking and loading provision, all generally associated
           with Place activities; and
      (iii)Main carriageway activities, catering for various mechanised transport modes passing
           through the area, all generally associated with Link user groups.

Footway activities and main carriageway activities generally have a degree of priority over most
kerbside activities (which potentially can be provided off-street, but in close proximity). So where
the total street width is very restricted, or where Link demands for through movement are very high,
then there may be a complete ban on kerbside stopping activities, with all the available space used
exclusively for moving traffic and footway activities.

From a design perspective, there are seven distinct types of ‘zones’ in cross section, where design
elements would typically be located to meet certain types of activity requirements. With the
exception of the median strip, all can potentially be duplicated on both sides of the street. The full
range of potential zones is illustrated schematically in Figure 2 – recognising that only very rarely
would there be sufficient space (or need) to accommodate all these zones.

               Footway                                                     Carriageway                                                                                              Footway
 BUILDINGS

                                                                                                                                                                                                                           BUILDINGS
                          Movement
                                     Street Furniture
                                                        Footway kerbside
                                                                           Running lanes
                                                                                           Median kerbside
                                                                                                             Median strip
                                                                                                                            Median kerbside
                                                                                                                                              Running lanes
                                                                                                                                                              Footway kerbside
                                                                                                                                                                                 Street Furniture
                                                                                                                                                                                                    Movement
              Curtilage

                                                                                                                                                                                                               Curtilage

                                            Figure 2: Potential cross sectional street design zones

                                                                                                               5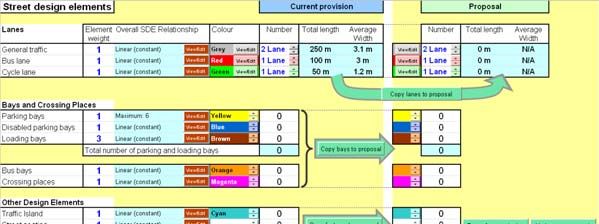
2.2    Street length
Having determined whether or not there is sufficient street width to accommodate certain broad
types of street design element (e.g. kerbside parking and loading bays), then the available street
length determines the maximum possible extent of that provision. For example, street length limits
the number of parking/ loading bays that can be provided along that section of street, or the total
length of cycle lane that can be accommodated.

However, not all of the street length can be used for adding design elements.ents. Side road junctions
can occupy a significant proportion of the street length on both sides of the highway, thereby
precluding any exclusive footway provision at these points, and any kerbside activities – both at the
junction itself and for some metres in either direction (to allow for turning movements and sight
lines). Pedestrian crossing facilities also preclude all kerbside activities at the crossing point itself
and for some distance on both approaches (within the white zig zag lines) – unless the carriageway
is sufficiently wide to allow kerbside bays to be set back from the main carriageway, with kerb
build-outs and so to be inserted ‘behind’ the zig zag lines.

2.3    Timing of provision
More intensive use can be made of the space within the envelope of the available width and length
along a street, by limiting the availability/operation of certain types of design element to particular
time periods. For example:
    • Bus lanes might be provided in peak periods, when traffic is heavy, and released for
       kerbside parking and loading at off-peak times;
    • Kerbside space might be used by street stalls on market days, and released for general
       parking and loading uses on other days of the week.
    • Footway parking or loading may be permissible outside shopping hours, when demands for
       footway space are more limited; and
    • Blue badge parking spaces might be designated during the daytime only, enabling general
       parking or loading activity at night.

To measure the extent of provision in this temporal context, it might be appropriate to record total
metre-hours or square metre-hours of provision of a particular design element, perhaps
distinguishing between weekdays and weekends.

2.4    Layout/pattern of provision
Within a particular defined street width and length, there is considerable scope to vary the location
of provision of a given set and quantity of street design elements. Elements can be arranged in both
the cross-sectional and longitudinal dimensions of the street.

Options for placement in the cross-sectional dimension:
   1. Where the provision of traffic running lanes required to meet the needs of traffic passing
      through the street takes up less than the full carriageway width, then these could be located
      in four different cross sectional configurations, as shown in Figure 3:
  EAST SIDE                   WEST SIDE                   CENTRED                    MEDIAN
                                                                                     STRIP

                  Figure 3: Cross sectional location options for traffic running lanes
                                                   6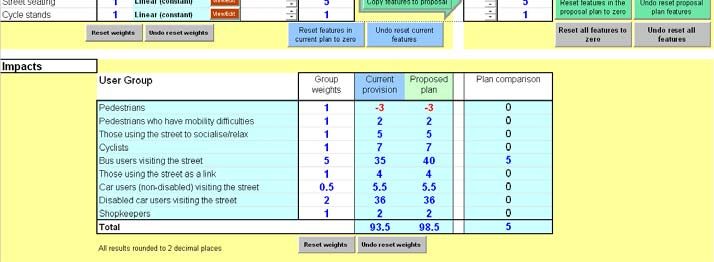
2. Where there is sufficient carriageway width to accommodate parking/loading bays, in
      addition to the running lanes, then these could be positioned at three places, in cross section,
      as shown in Figure 4:

                 Figure 4: Cross sectional location options for parking/loading bays

Options for placement in the longitudinal dimension:

The degree of flexibility when locating design elements is much greater, since there are many
permutations of the use of space along the length of the street; for example, kerbside space can be
allocated to car parking at one point and loading at another point, and these positions can be
modified in different designs. One option is illustrated in Figure 5.

Figure 5 uses the signing and colour coding conventions used in the Bloxwich consultation exercise
to illustrate one possible layout for a row of four general parking bays (in yellow) and a bus stop
bay (in orange) on the north side of a street, close to a row of shops.

                                                                    Shops

        P       4                                               Bus Stop

      Figure 5: One possible layout of parking bays and a bus bay in relation to a row of shops

If designs were compared purely on the overall numbers of bays, then this layout will be considered
to be identical to one where the locations of the bus stop and parking spaces have been reversed.
However, in the example above it can be seen that the location of the bus stop is more convenient
for those who are visiting the shops than are the parking bays; anyone parking in the latter has
further to walk to the shops and must cross a side street to reach the shops.

Thus, the location as well as the quantity of the various elements should also be taken into account
in some way when comparing designs.

                                                 7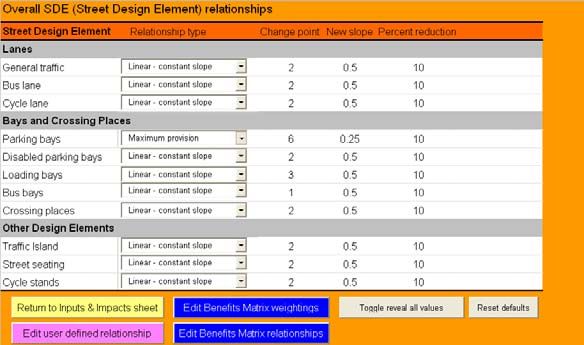
3.      Stages of the street design and appraisal process
Figure 6 shows the proposed stages and sequence of a comprehensive street design and appraisal
process, from the determination of street functions through to the assessment of ‘winners’ and
‘losers’. It also itemises the various inputs that are required at each stage, and highlights in bold the
stages that deal primarily with assessing distributional impacts.

            • Link and Place status
            • Mode priorities                 Determine Street Type
            • Land use priorities
                                              Determine Street User
            Stakeholder Guidelines            Groups and Activities

                                                                               Take into Account
                                               Determine Required
                 Design Guidelines                                             Existing Problems/
                                                Street Elements
                                                                                Policy Objectives
      Establish Numbers of People/
                                                Determine Desired
         Demand Levels, Including
                                                 Numbers/Space
       Future Street Requirements

                 Check Nearby off-             Determine Net Nos./
                   Street Provision            Space Requirements

                                   Generate Streetspace Design Options:
                                   •Types/Numbers Street Design Elements
                                   • Location of Street Design Elements

             Weightings Related to              Appraise Against                Current
             Ideal Provision Levels            Current Conditions               Street Layout

                                               Winners and Losers
                                                  Net Benefits

                 Figure 6: Stages and inputs to the street design and appraisal process

The characteristics of these various stages and the inputs that are required are described in section 4,
and a case study application of the appraisal process is presented in section 5 and subsequent
sections.

4.      Stages and inputs to the street appraisal process
4.1     Determination of street type
Streets perform a wide variety of different functions, catering for a variety of users with
requirements for different kinds of street design element. A primary distinction can be made
between ‘Link’ and ‘Place’ related functions. Link functions relate to the street as a movement
artery, enabling people and vehicles to pass along the street, with minimum hindrance; this has
implications both for the design of parts of the carriageway and the footway. Conversely, Place
functions are associated with the street as a destination in its own right, and include provision for
parking/loading as well as footway activities (e.g. window shopping, or resting); again, these affect
the use of both parts of the carriageway and the footway.

                                                   8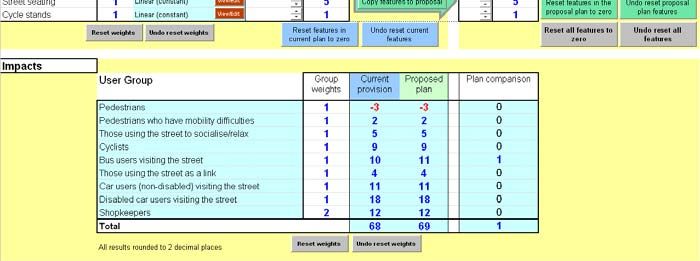
The EU ‘ARTISTS’ project developed a two-dimensional street status classification based on Link
and Place status. This has subsequently been refined in work carried out in conjunction with
Transport for London, as shown in Figure 7 (see Jones, Boujenko and Marshall, 2007). In this
example, there are five levels of street Link status (I – V), and five levels of Place status (A – E).
To this basic categorisation has been added a sub-classification that records the main land use(s)
along the street (e.g. retail, residential), and a record of any modal priorities (e.g. bus priority route).

                                                                    Place status (A, B, C, D and E)

                                                                                                            Neighbour
                                                                      National

                                                                                             District

                                                                                                                         Local
                                                                                                            hood
                                                                                    City
                                                         National    I-A           I-B       I-C            I-D         I-E
                   Link status (I, II, III, IV and V)

                                                             City    II-A          II-B     II-C            II-D        II-E

                                                                                                                                 Arterial streets
                                                          District III-A           III-B    III-C           III-D       III-E

                                                                                                                                 Non-arterial streets
                                                        Neighbour
                                                             hood
                                                                  IV-A             IV-B     IV-C            IV-D        IV-E

                                                           Local     V-A           V-B      V-C             V-D         V-E

                                                                       Link/Place classification matrix

                                                              Figure 7: Link and Place street classification

4.2     Determination of relevant stakeholder groups and desired activities
There is a very wide range of groups of people who use, or have an interest in, streets. The nature
and extent of this interest depends mainly on the street status, but also the characteristics of the local
residential population. We can characterise these people and their interests primarily in two ways,
as shown in Figure 8.
                                                                                           STREET TYPE

                                                                                 STREET USER GROUPS

                                     POPULATION ROLES:
                                     • Shopper
                                     • Car driver                                                           POPULATION CAPABILITIES:
                                                                                                            • Disabled people
                                                                                                            • Children
                                     STREET ACTIVITIES:                                                     • Elderly people
                                     • Driving through
                                     • Loading
                                     • Crossing the road

                                                                                 REQUIRED DESIGN ELEMENTS

                  Figure 8: Factors contributing to demand for street design elements

                                                                                                        9
Firstly, street users can be classified in terms of the roles they are playing while using the street
(e.g. as a shopper, resident, through car driver), and the associated activity(ies) and concerns that
are associated with these roles. Secondly, street users can be categorised in terms of their physical
and mental capabilities for operating in the street environment. Both these factors have an influence
on the types and characteristics of the street design elements that are required by, or are desirable
for, these groups.
The characteristics of the population living within the catchment area of the street can be obtained
from census or related data. Empirical relationships need to be established between the various
cells of the Link/Place street types/status levels matrix and the relevant street user groups (albeit
subject to local modification and augmentation). Such data is currently limited, but the principle is
illustrated schematically in Figure 9.
Street type
User groups … I-E … III - B … V-E
Retail
Pedestrians 9 9
Pedestrians who have mobility difficulties 9 9
Those using the street to socialise/relax 9
Cyclists 9 9
Bus users visiting the street 9
Those travelling to other destinations 9 9
Car users (non-disabled) visiting the street
t 9 9
Disabled car users visiting the street 9 9
…
Figure 9: Street user groups associated with different street types
4.3 Determination of types of required street elements
The types of street user groups and activities associated with a particular street type, along with the
set of local population capabilities, will determine the kinds and form of the street design elements
that need to be provided.
Examples might include:
• Pedestrians (including the users of mobility aids):
Requirement: a minimum uncluttered pavement width and protected crossing places
• People who want to sit and socialise or watch the world go by:
Requirement: seating and standing space
• People who arrive at the street by bicycle:
Requirement: cycle lanes and cycle stands
• People who arrive/depart by bus:
Requirement: bus shelters and information
• People travelling along the street to reach other destinations:
Requirement: free-flowing running lanes
• People accessing the street by car:
Requirement: general and disabled parking bays on the street, or in close proximity
• Shopkeepers:
Requirement: loading bays and local parking for customers
10Table 1 illustrates the kinds of street design elements that would assist in meeting the requirements
of different kinds of street user groups and their associated activities. Various guides exist that
assist in the selection and design of these street elements – but, again, further research is required.
Table 1: Examples of street design elements required by different street user groups
Lanes Kerbside provision Other
parking bays
Disabled
Loading bays
Bus bays
Crossing places
Traffic islands
Street seating
Cycle stands
General traffic
Parking bays
Cycle lanes
Bus lanes
lanes
Pedestrians ● ●
Pedestrians who have mobility difficulties ● ● ●
Those using the street to socialise/relax ●
Cyclists ● ● ● ●
Bus users visiting the street ● ● ● ● ●
Those travelling to other destinations – all modes ●
Car users (non-disabled) visiting the street ● ●
Disabled car users visiting the street ● ● ● ●
Shopkeepers ●
In addition, further design requirements might be determined by the existence of particular local
problems (e.g. a high accident rate at a junction), or by local policy objectives (e.g. improve the
quality of the urban realm).
4.4 Determine desired levels of local provision
In terms of Link-related activities, there are many national and local standards and guidelines
setting out capacity requirements (usually in the form of numbers of running lanes and lane widths).
This often specify ranges (e.g. for lane widths) in terms of maximum and minimum dimensions, or
circumstances under which uses might be shared (e.g. combined bus and cycle lane). The main
criteria here influencing recommended levels of provision relate to traffic volumes and the degree
of priority to be given to particular modes of transport.
At present we largely lack equivalent standards or empirical evidence with regard to the desired
levels of provision for different kinds of Place-related street activities. These design elements tend
to be more diverse in nature, ranging from cycle parking or loading facilities, to the provision of
seating, public toilets, etc. Such guidance is likely to emerge from a combination of normative
judgements (e.g. a street of type X should provide Y seats), and from empirical studies looking at
current levels of provision and levels of user satisfaction under different circumstances. Again,
levels of demand, in terms of numbers of street users of given types, will be an important
consideration (e.g. numbers of blue badge holders seeking to park along the street). As with the
Link-related design elements, it is likely that guidance will need to indicate ranges of provision,
from the desirable to the minimum. Again, further research is required.
4.5 Determine net levels of on-street provision
Having determined the required levels of provision of different kinds of street design elements
(where appropriate, at both desired and minimum levels of provision), it is necessary to check
whether:
11(i) Provision of certain design elements already exists off-street (e.g. through private forecourt
or rear parking and loading provision, public off-street car parking), or is available in nearby
streets (e.g. on-street parking); or
(ii) Where space is at a premium, whether suitable provision could be made off the main street.
For example, by providing a suitable cycle route for through cyclists on parallel residential
streets, or building public amenities (e.g. seating) adjacent to the street.
The outcome of this process would be a set of minimum (and possibly maximum?) design
requirements. Part of such a set of requirements is illustrated schematically below in Table 2,
comparing existing and desired levels of provision, which was used as an input to the design
exercise in Bloxwich.
Table 2: Examples of some requirements for the provision of street design elements, as an input to a street
redesign exercise
Existing Design
Spaces Spaces
Parking Bays 10 12
Loading Bays 10 14
Disabled Bays 2 4
Bus Stops 4 4
Crossings 3 3
4.6 Generating design options
Jones and Thoreau (2007) describe the development of a set of physical and computer-based tools
for generating streetspace allocation options, with the involvement of local stakeholder groups, and
their application in a case study in Bloxwich in the West Midlands.
Figure 10 illustrates a ‘hands on’ design workshop in action, and Figure 11 shows how this
information is subsequently translated into a GIS-based format for on-line editing (using the
‘LineMap’ program). Both use coloured blocks to indicate the different kinds of streetspace
allocation (e.g. yellow for general parking, and blue for disabled, blue badge parking spaces). On
completion of the exercise, LineMap provides a summary of the main design elements that have
been included (e.g. length and number of parking bays, length of cycle lane), enabling a quick
comparison between options.
Figure 10: Participants in the Bloxwich street design workshop (left) and a close up of the scale maps
and blocks used in the design workshops (right).
12Figure 11: Computer-based comparison and editing of design options
It is the data derived from this pubic engagement exercise that is used to illustrate the development
and application of the distributional impacts spreadsheet, later in this main report and in the
Appendices.
Characterising key features of different street design options
Having generated one or more design options, it is then necessary to determine how the key features
of each design will be characterised and measured, as the basis for conducting a distributional
appraisal of the option(s) against the existing situation.
Here there are two key measurement dimensions:
(i) Numbers/capacity of different street design elements
(ii) Location of design elements
At present we have not developed a suitable set of metrics for measuring the locational
characteristics and advantages of the siting of particular design elements at specific points along the
street (as discussed in section 2.4). This requires both further methodological research, and in its
application will probably require more detailed information on frontage land uses along the street.
4.7 Appraising design options
It is extremely unlikely that a design option will be able to fully satisfy all the requirements of the
various street user groups. Some judgement will, therefore, need to be made about how much
13weight should be given to different competing street users’ requirements, and whether one option is
‘better’ than another. This can be addressed by applying various explicit weighting procedures.
Weighting different components of the appraisal
The application of weights within the appraisal process is likely to involve at least three types of
consideration:
(i) How important the needs of one user group are considered to be relative to those of others.
These distributional impacts may be influenced by:
• The Link and Place status of the street
• Local or general policy considerations (e.g. presence of an agreed street user
hierarchy)
(ii) The extent to which a particular design element satisfies the requirements for a particular
group/activity; and
(iii) Any diminishing returns associated with increasing levels of provision of a particular
street design element.
For example, in relation to points (i) and (ii), there might be a policy decision to weight the needs of
blue badge holders looking for parking spaces at three-times non-disabled drivers, and to give a
lower weighting to through car traffic than to those passing through on a cycle or in a bus.
Similarly, in most circumstances, a segregated cycle lane is likely to be more attractive to a cyclist
than a shared bus/cycle lane, and this might be reflected in a differential weighting.
Sections 4.4/4.5 discussed how to identify maximum/minimum required levels of net provision for
different street elements. We can assume that, once the higher level of provision has been reached,
there will be no substantial benefit from increasing levels of provision. The issue then is how to
characterise the gain in benefit, as provision is increased from zero to the minimum and then to the
maximum level of provision (i.e. point (iii) above). Two possible functional forms are shown in
Figure 12, using parking space provision as the illustrative example. The first assumes a simple
linear relationship, and the second a concave relationship. In practice, more complex step functions
might be preferred.
Utility to car users visiting the street
Utility to car users visiting the street
Parking spaces Parking spaces
Figure 12: Two forms of relationship between level of provision and benefit
4.8 Assessing ‘winners’ and ‘losers’, and net benefits
This process involves bringing together the various kinds of data from the previous stages outlined
above, in a spreadsheet designed for this purpose. In particular, it is necessary to identify the street
user groups who will benefit from the different design elements included in the options, and then
applying any person type and scale of provision weightings, as outlined in section 4.7. The process
is illustrated in the following sections of the report.
14A further consideration concerns the spatial - and possibly temporal - extent of the impacts that are
being taken into account in the assessment. The streetspace allocation exercise will have defined a
Design Area for study, but there will also be a wider Impact Area, over which the consequences of
any reallocation of street space among street design elements will be significant. For example, if
parking is displaced from a high street, then there will be additional pressure on parking spaces in
the surrounding residential areas, and some increase in traffic searching for a parking space.
It is thus important to carry out the distributional appraisal over the wider Impact Area, as this is
where some significant consequences might be experienced.
5. Illustrative study for exploring distributional impacts
This illustrative application is based on a short section (c.120m) of Bloxwich High Street and
around 50 metres of residential streets on either side. Three design options are shown below in
Figure 13:
• Scheme A represents existing provision, in the form of a bus stop with run ins (in orange),
two disabled parking bays (in blue), four standard parking bays (in yellow) and two loading
bays (in brown);
• Scheme B adds 6 disabled parking bays in one of the residential side streets; and
• Scheme C instead adds 6 standard parking bays along the same stretch of residential side
street.
Scheme A Scheme B Scheme C
Figure 13: Three design options for part of Bloxwich High Street
A summary of the three option schemes is shown below in Table 3. It can be seen from this table
(and by comparing the scheme diagrams in Figure 13) that Scheme B benefits disabled drivers
wishing to park in the area, while Scheme C benefits anyone arriving by car and Scheme A benefits
those who want to travel along the residential street on the east side of Bloxwich High Street.
Table 3: A comparison of the three scheme options
Scheme A Scheme B Scheme C
General Parking Yellow 4 4 10
Disabled Parking Blue 2 8 2
Loading Brown 2 2 2
Bus Stop Orange 1 1 1
Where there is an existing base scheme, the method may also be used to provide relative scores, by
showing the performance of each option in comparison to the existing situation.
15Using these examples, the next section illustrates the main stages of an Excel spreadsheet that has
been developed to assess the distributional impacts of different street design options. This uses the
relative performance formulation. A fuller description is provided in the Appendices to this report.
6. Application of the distributional impacts spreadsheet
6.1 The main stages of the process
These mirror the later appraisal stages of the process shown in Figure 6 in bold. In particular:
• Develop a matrix of Street User vs. Design Elements, showing benefits and disbenefits
• Assess overall Street User Group impacts of each scheme option
• Add weightings, to reflect:
¾ Relative priority given to different Street User Groups
¾ Extent to which a street design element meets a specific user requirement
¾ Diminishing value of increasing levels of provision of particular design elements
Each stage is outlined below, and described more fully in the Appendices.
6.2 Street User/Design Elements ‘Benefits Matrix’
Figure 14 shows a simple version of the Street User/Design Elements Benefits Matrix, with the key
Street User Groups relevant for that case study street depicted along the columns, and a selection of
relevant street design elements on the rows. The relationship between users and street design
elements is simply captured at this stage based on scores of ‘0’ for no impact/relevance (these cells
have been left blank in Figure 14), +1 (benefit) and -1 (disbenefit).
Here there are no weights reflecting (i) any differences in priority given to the needs of different
Street User Groups, nor (ii) the extent to which a design element meets a user need, nor (iii) any
diminishing returns from increasing provision.
Figure 14: Benefits Matrix of Street Design Elements for different Street User Groups (without weighting)
6.3 Assessing scheme impacts (no weighting)
Using the values in this matrix, a total score for a scheme option can be produced by noting how
many of each of the street design elements are included in the design and then applying the relevant
scores from the cells in Figure 14. For example, each crossing place adds one point to the total for
pedestrians, but takes a point away from those travelling to other destinations. This process is
repeated, as appropriate, for each street design element.
Figure 15 shows how a scheme option score is built up using entries within the Inputs & Impacts
sheet. Details of each option are entered in the group of tables labelled Street Design Elements. The
16elements that make up the current provision are entered using the tables in the top left section of the
sheet (marked I in Figure 15), while the elements for the proposed provision under one of the
options are entered in the tables in the top right section (marked II in Figure 15). The resulting
impacts for each street user group (calculated using the matrix in Figure 14) are shown in the lower
table, labelled Impacts (marked III in Figure 15).
The impacts are presented separately for the current provision and a proposed scheme, and the
difference between the two is given in the right hand column; in this example, the comparison is
between Scheme A and Scheme B in Figure 13.
II
I
III
Figure 15: Using the Inputs & Impacts worksheet
The results of applying this approach to all three of the schemes in Figure 13 can be seen in Table 4,
where Scheme A has been used as the reference case (existing situation). The results show that
Scheme C is the best overall option. However, this assumes that the disabled car users gain as
much from standard parking bays as they would from disabled parking bays. The result would
change if we altered the weighting for either general or disabled parking spaces for disabled drivers.
This is considered further below (see Table 5).
Table 4: Comparison of the three schemes using the user group benefit matrix
Scheme A Scheme B Scheme C
Pedestrians 0 0
Pedestrians who have mobility difficulties 0 0
Reference case
Those using the street to socialise/relax 0 0
Cyclists 0 0
Bus users visiting the street 0 0
Those travelling to other destinations - all modes 0 0
Car users (non-disabled) visiting the street 0 6
Disabled car users visiting the street 6 6
Shopkeepers 0 0
TOTAL (NET) SCORE 6 12
6.4 Addition of street user/design element weightings
To reflect differences in the priority given to meeting the needs of different street user groups (e.g.
resulting from policy priorities or the numbers of each category of people on the street), or the
suitability of different design elements to meet a given type of requirement (e.g. a blue badge bay
17would be more suited to the needs of a disabled driver than a normal parking bay), we can apply
weights to each street user group (SUG) and street design element (SDE). In the former case, this is
equivalent to weighting columns in the Benefits Matrix (shown in Figure 14), and in the latter case
this involves a weighting of rows. Figure 16 shows the part of the spreadsheet that is used to
change the default weightings of 1.0 for the street user groups and street design elements.
Figure 16: Detail showing street design element (left) and user group (right) weighting
It is also possible to apply a specific weight to an individual SUG/SDE cell (i.e. to reflect the
particular importance of a specific street design element for one street user group, over and above
the general user group and design element weightings), by editing the individual cells in the benefits
matrix (shown in Figure 14). For example, a Traffic Island might be considered to be of particular
benefit to ‘Pedestrians who have mobility difficulties’, and given a score of ‘2’ for that group only.
An example of the consequence of doing this is illustrated in Table 5, where the value of the cell in
Figure 14 showing the weighting of general parking spaces for disabled drivers has been changed
from +1 to +0.5. As can be seen, this results in a lower net score for Scheme C, where the six
general parking bays (see Table 3) now score only 3 for disabled drivers instead of 6 units.
Table 5: Effect of changing the weighting of the ‘disabled drivers/general parking bay’ cell in Figure 14
Scheme A Scheme B Scheme C
Pedestrians 0 0
Pedestrians who have mobility difficulties 0 0
Reference case
Those using the street to socialise/relax 0 0
Cyclists 0 0
Bus users visiting the street 0 0
Those travelling to other destinations - all modes 0 0
Car users (non-disabled) visiting the street 0 6
Disabled car users visiting the street 6 3
Shopkeepers 0 0
TOTAL (NET) SCORE – Unweighted (Table 4) 6 12
TOTAL (NET) SCORE – Weighted 6 9
18After changing the weighting for disabled drivers, Scheme B appears to offer more benefits for
disabled drivers than Scheme C, although the overall net benefits to street user groups are still
higher for Scheme C – on the assumption that each group is given equal weighting. It is clear that
some care must be taken in assigning the weights to matrix cells if detailed comparisons between
schemes are to be made. Some justification should be given for the relative weights that are used.
6.5 Dealing with degrees of provision and diminishing returns
As noted in section 4.7, there is also a need to define relationships between the degree of provision
(DoP) of a street design element and the relative benefit resulting from that level of provision, since
there are likely to be diminishing returns from the increasing provision of many types of design
element. This requires the ability in the spreadsheet both to specify relationships (linear or non-
linear) and change points in those relationships (e.g. from linear increasing to flat, if there is no
additional benefit to be gained from further provision above a certain threshold level).
Figure 17 shows the spreadsheet screen for selecting an appropriate DoP relationship for each street
design element. In this example for Parking Bays, the value for the change point has been set at 5;
up to this point the relationship is linear, rising one unit with each space, while after this point each
extra parking bay only has a 0.25 benefit rather than 1. Figure 18 shows a graph of this relationship
with the Change Point set at 5.
Figure 17: Spreadsheet SelectRel screen for setting relationships
Linear - two slopes
8
7
6
5
Impact
4
3
2
1
0
0 2 4 6 8 10 12 14 16
Design Elements
Figure 18: Graph of modified relationship set up in Figure 16
Figure 19 shows the implications for scheme scores of applying this non-linear relationship in the
case where the Street User Group (SUG) and Street Design Element (SDE) weightings have been
set at 1.0. Setting the number of parking bays to five has resulted in a score of ‘5’ for the two car
user groups. However, it can be seen from the right of Figure 19 that, beyond the change point of 5,
19it takes a further four spaces to increase the benefits by one more point, to ‘6’ for each group, as
each additional space now only has a quarter point impact.
Figure 19: Result of adding a change point and a second linear section
Note that the total row score for each Street User Group (m) for a particular scheme is made up by
multiplying three weights as follows:
1
∑ n WSUGm x WSDEn x DoPSDEn
[This excludes specific SUG/SDE combination weights]
6.6 Customising street design element relationships
Section 6.5 describes how a relationship between level of provision and benefit can be defined for a
particular street design element. The default setting is that the same relationship applies to all the
street user groups, referred to in the spreadsheet as the Overall SDE relationship, where SDE stands
for street design element. If a different relationship is required for a particular pairing of street
design element and user group, this can be edited in the spreadsheet by clicking the Edit Benefits
Matrix relationships shown in Figure 17.
Figure 20 shows a version of the Benefits Matrix that includes information about the type of
relationship that is active for each cell. Cells where there is no relationship between a street design
element and a street user group, and that are blank in Figure 14, are greyed out here.
Initially all the cells in a row take on the overall street design element relationship, shown after the
street design element name on the left of the screen. Each cell contains a shortened version of the
relationship name followed by +ve or –ve, indicating whether the relationship has been defined as
positive or negative in the simple Benefits Matrix (Figure 14). All positive relationships cells are
shown in blue, all negative relationship cells are shown in red, matching the colour scheme used in
the simple Benefits Matrix.
Clicking the Edit button in any cell brings up the dialog box shown in Figure 21; this allows any
relationship to be selected for that cell, including custom relationships (described in appendix B).
Using this screen it is possible to fine tune the relationship for each pairing of user group and street
design element in the Benefit Matrix.
20Figure 20: Screen used to edit the relationships for each cell in the Benefits Matrix
Figure 21: The Set Matrix Cell Relationship Dialog box used to select relationships for individual cells
7. Scope for further development
There are several ways in which the basic spreadsheet presented here could be expanded or
reformatted, to take into account a wider range of factors. Some possible improvements are
outlined below.
7.1 Taking into account the duration of provision
In its current form the spreadsheet only takes into account the number of street design elements of a
given type, not the period of time over which they are available. Simple temporal variations could
be accommodated, for example, by making separate assessments for peak and off-peak periods (e.g.
to assess the effect of a peak bus lane and off-peak parking bays); or, more comprehensively, by
taking into account the hours of provision of a street design element during a 24 hour period. In the
process of doing so, there might be a case for varying user group and street design element
weightings by time of day.
7.2 Taking into account the location of provision
The spreadsheet does not deal with the relative benefits of locating a given number of street
elements in different configurations (see section 2.4). So, for example, there is no way of assessing
the differential benefits for various groups of locating a given number of disabled blue badge
parking bays on main roads versus adjacent side roads.
217.3 Varying the number of Street User Groups and Street Design Elements
In the current version of the spreadsheet, the number of and labels for both the street user groups
and the street design elements are fixed as shown in Figure 14 (although the user can indicate that
certain groups and street elements are not applicable in a given situation). It would be desirable in
future to make this more generic, by enabling the user to vary the number of rows and columns and
to readily change the labels for user groups and street elements.
7.4 Empirical data on user needs
The profession currently lacks empirical data relating to several of the stages outlined in Figure 6,
in particular:
• Relevant Street User Groups associated with different Street Types (see section 4.2);
• Types of Street Design Elements required by different Street User Groups (see section
4.3);and
• Desired and Minimum level of provision of selected Street Design Elements, by Street User
Group and Street Type (see section 4.4).
7.5 The treatment of running lanes
It is currently possible to include information about the characteristics of the running lanes included
in a street plan option, using a separate form in the spreadsheet; when this is done, a summary of
width and average length appears on the Inputs & Impacts sheet. However, lane lengths are
currently included in the calculations by treating a predefined length (e.g. 50m) of each lane in the
same way as the provision of a parking bay. Further thought needs to be given as to how this
representation can be refined.
7.6 Weights
A mix of additional empirical evidence and professional/political judgement is required to
determine the appropriate weights to be applied in the spreadsheet (see section 4.7) with regard to:
• Relative importance of needs of different Street User Groups;
• Extent to which a Street Design Element meets the needs of particular groups; and
• Relationships between increasing levels of provision and marginal benefits.
8. Case study: applying the scheme comparison spreadsheet
This section demonstrates an application of the scheme comparison spreadsheet to a real world
example, linked to other work carried out under the DISTILLATE project.
8.1 The case study area
Figure 22 shows a series of plans of the Bloxwich high street area, used as the case study for this
application. The area highlighted in red in Figure 22A shows the study area; it covers the running
lanes and footways for the main shopping area of the high street. Figure 22B shows a plan of the
existing provision. The schemes produced by the stakeholder design workshops, which allowed
local people to formulate their own design options, are shown in Figures 22C and 22D. Two groups
of stakeholders developed street designs with the assistance of members of Walsall Metropolitan
Borough Council. A full description of the consultation process can be found in Jones and Thoreau
(2007). Figure 22E shows the final council developed scheme that incorporated elements from both
of the stakeholder options and was presented for comment at a formal public consultation exercise
(see http://www.walsall.gov.uk/index/red_routes_bloxwich.htm).
The stakeholder scheme options (22C and 22D) and the final council scheme (22E) will be
compared against the existing provision (Figure 22B) in this section, using the spreadsheet
described in preceding sections of this report.
22A B C D E
Figure 22: Plans and scheme options for Bloxwich High Street: A. The scheme comparison area: the main movement and shopping area
B. Existing provision on the street
C. Design produced by stakeholder group 1
D. Design produced by stakeholder group 2
E. Final design put forward for consultation
23The first stage of the scheme comparison process is to describe the existing provision in terms that
can be entered into the spreadsheet. For the proposed schemes shown in Figures 22C, 22D and
22E, LineMap outputs were used to derive information on the numbers of different types of street
design elements. The existing scheme (Figure 22B) was not available as a LineMap file and
although some bays, such as bus bays, are marked, the rest of the provision has been estimated from
the street signs.
It should be noted that this comparison example is limited to the section highlighted in Figure 22A.
The highlighted section only includes the provision on the main section of the high street and does
not include any of the provision on side streets or north of the shopping section.
8.2 Stakeholder street designs
The first set of comparisons will evaluate the two stakeholder options (as shown in Figures 22C and
22D) against the existing street provision (Figure 22B).
First, the number of each of the street design elements contained in the existing provision and both
stakeholder options is determined, as shown in Table 6. Here we can see, in particular, that both
stakeholder options substantially increase the number of parking bays on this section of the high
street.
Table 6: Street design elements in the existing provision and the two stakeholder group design options
Existing provision Group 1 scheme Group2 scheme
Parking bay 15 34 30
Disabled parking bay 5 2 7
Loading bay 7 8 8
Bus bay 4 2 3
Crossing places 2 2 2
Traffic Islands 0 0 0
Table 7 shows the net impacts for each street user group, and in total, using the scoring system
previously described in the development of the scheme comparison spreadsheet (though without the
addition of any weightings).
Table 7: Comparing the impacts of the two stakeholder design options against existing provision
Street user group Group 1 scheme Group2 scheme
Pedestrians 0 0
Pedestrians who have mobility difficulties 0 0
Those using the street to socialise/relax* 0 0
Cyclists* 0 0
Bus users visiting the street -2 -1
Those using the street as a link 0 0
Car users (non-disabled) visiting the street 19 15
Disabled car users visiting the street 16 17
Shopkeepers 1 1
Total 34 32
*The street plans available for the comparison did not include details of street seating or cycle stands.
Table 7 shows the overall impact of each scheme to be positive in comparison to the reference case,
in this case the existing provision, although there is a small net disbenefit for bus users. These
results, however, do not fully take into account any differences in the traffic carrying capacity of the
high street between the three designs. Enhancing the way that the spreadsheet deals with running
lanes is one of the recommended improvements (see Section 7.5).
24You can also read