Teagasc submission made in response to the Department of Agriculture, Food and the Marine CAP Public Consultation Process
←
→
Page content transcription
If your browser does not render page correctly, please read the page content below
Teagasc submission made in response to the
Department of Agriculture, Food and the Marine
       CAP Public Consultation Process
Prepared by:
Teagasc Working Group on CAP Reform: Trevor Donnellan, John Finn, Kevin
Hanrahan (Chair), Thia Hennessy, Catherine Keena, James McDonnell, Pat
Murphy, Daire Ó hUallacháin, Fintan Phelan (Secretary), Fiona Thorne

Editors: Kevin Hanrahan and Thia Hennessy

October 29, 2013

                                     0
Table of Contents
1 Introduction                                                                      1
2 Background                                                                        2
3 Technical issues                                                                  4
       3.1 Definition of Permanent Pasture and Grassland                            4
       3.2 National Reserve                                                         5
       3.3 Transfer of Entitlements                                                 5
       3.4 Greening                                                                 6
       3.5 Permanent Grassland                                                      7
       3.6 Ecological Focus Areas                                                   7
       3.7 Young Farmers’ Scheme                                                    9
       3.8 Small Farmers’ Scheme                                                    10
       3.9 Areas of Natural Constraint Scheme                                       11
4 Analysis of CAP Reform Implementation Options                                     11
       4.1 CAP Reform implementation scenarios analysed                             12
       4.2 Analysis using the SPS database                                          15
                 4.2.1 Methodology                                                  15
                 4.2.2 Results using SPS database                                   17
       4.3 Analysis using the Teagasc NFS database                                  20
                 4.3.1 Methodology                                                  21
                 4.3.2 Results of Analysis Using the Teagasc National Farm Survey   22
                        4.3.2.1 Dairy Farms and dairy output                        24
                        4.3.2.2 Tillage Farms and crop output                       25
                        4.3.2.3 Sheep Farms and sheep output                        26
                        4.3.2.4 Cattle Farms and beef output                        27
                        4.2.2.5 All Farms and all Output                            31
                        4.2.2.6 The Impact of a Redistributive Scenario             32
       4.4 CAP Reform implementation scenario analysis: Conclusions                 33

References                                                                          33
Appendix: Greening Measures on Tillage Farms                                        35

                                             i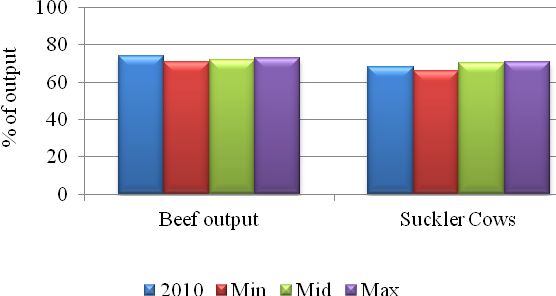
Executive Summary
This submission has two principal parts. The first part outlines Teagasc’s responses to some
elements of the DAFM Consultative Paper’s questionnaire. The Teagasc position in relation
to the definition of permanent grassland and areas of natural constraint, the operation of
the Greening Scheme and the Young Farmers Scheme is presented.
The second part of the submission describes the findings of an economic analysis of a
number of scenarios relating to the Basic Payment Scheme, Voluntary Coupled Support
Scheme and Redistributive Scheme. Five scenarios are analysed, each with the same basic
convergence model (the so-called internal convergence model) but with differing levels of
the Pillar I direct payments budget allocated to coupled support and redistributive
payments. The details of the five CAP reform policy implementation scenarios analysed are
as follows:
MIN: assumes the minimum level of redistribution with no Voluntary Coupled
Support Scheme (VCSS) and no Redistributive Payment Scheme (RPS)
MID: half of the allowable VCSS fund is used and paid on both suckler cows and
ewes
MAX: all of the allowable VCSS fund is used and paid on both suckler cows and ewes
MAX Cows: all of the allowable VCSS fund is used but paid only on suckler cows
REDIST: assumes no VCSS payments but the full allowable RPS fund is used and an
additional payment is made on the first 32 hectares.
In general, greater numbers of farmers gain under the MID and MAX scenarios relative to
the MIN scenario. However, for most farms the income changes (gains and losses) are small,
i.e. less than 10 percent, of those experiencing more substantial income changes, the effect
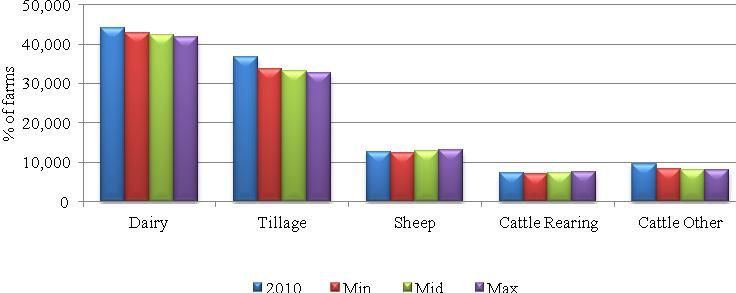
tends to be negative rather than positive. Similarly with farm output, approximately 25
percent of aggregate farm output is generated by farms that would lose 10 percent of their
income or more under the MIN scenario, with the proportion increasing to 30 percent of
output under the MAX scenario. This suggests that those farms that gain from the coupling
of direct payments to production tend to account for a smaller proportion of output than
those that lose.
The results show that, as expected, Cattle Rearing and Sheep farms benefit from coupling
and would experience higher incomes under MAX relative to MID or MIN. Average Cattle
Rearing farm income increases by €750 going from MIN to MAX, but the average income
decreases by €1,000 on Tillage farms, by €750 on Dairy farms and by €200 on Cattle Other
farms. However, an income gain of €750 represents a larger proportion of income on Cattle
Rearing farms than on Dairy farms. While coupled payments increase the profitability of
suckler cow production, the effect is found to be marginal. For all farmers the net benefit of
the coupled payment is less than the gross amount of the VCSS coupled payment. On Cattle
Rearing farms that are currently loss making the receipt of the coupled payment is often
insufficient to make them profitable.
Over 50 percent of farms would experience an increase in their income under the REDIST
scenario relative to their current position and up to one-third of farmers would see their
income increase by more than 10 percent. However, those farms that gain the most tend to
ii
account for a relatively small proportion of output. The one-third of farms that would
experience a more than 10 percent increase in their income account for 11 percent of
national output, while those losing 10 percent of their income or more account for almost
40 percent of total farm output. The negative impact of the REDIST scenario on farm output
is even more pronounced in certain sectors. Less than 1 percent of Tillage farms would
experience an income increase of 10 percent or more under the REDIST scenario, while 38
percent of Tillage farms would see their income falling by 10 percent or more. Furthermore,
61 percent of crop output is generated on farms losing 10 percent of their income or more.

                                            iii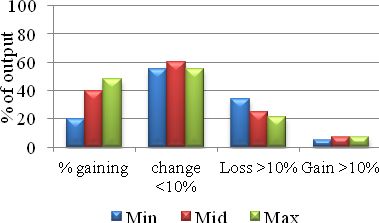
Glossary
ANCS       Areas of Natural Constraint Scheme
BPS        Basic Payment Scheme
CAP        Common Agricultural Policy
CSO        Central Statistics Office
DAFM       Department of Agriculture, Food and the Marine
EFA        Ecological Focus Areas
EU         European Union
GPS        Green Payment Scheme
MFF        Multiannual Financial Framework
NFS        National Farm Survey
RPS        Redistributive Payment Scheme
SFS        Small Farmers’ Scheme
SPS        Single Payment System
SFP        Single Farm Payment
VCSS       Voluntary Coupled Support Scheme
YFS        Young Farmers’ Scheme

                                     iv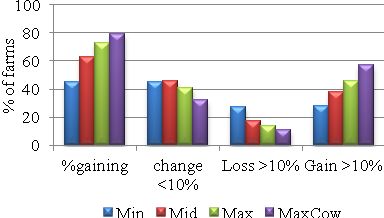
1 Introduction
The CAP reform agreement of June 2013, and specifically the agreement on the Direct
Payments Regulation, presents EU Member States with choices as to how to implement
the new direct payments regulation. Within the regulation there are three mandatory
payment schemes - Basic Payment Scheme (BPS), Greening Payment Scheme (GPS) and
the Young Farmers’ Scheme (YFS) that Member States must implement and four
optional payment schemes - Voluntary Coupled Support Scheme (VCSS), Redistributive
Payment Scheme (RPS), Areas of Natural Constraint Scheme (ANCS), and Small Farmers’
Scheme (SFS) that Member States can choose whether or not to implement.

Within each of the mandatory and optional schemes there are further choices in terms
of how these schemes are implemented by Member States. For example, under the
optional VCSS, Member States have a choice over how much of the national direct
payment ceiling should be allocated to this scheme (up to a maximum of 8%) and what
agricultural activities the payment is to be coupled to.

In July 2013 the Department of Agriculture, Food and the Marine (DAFM) launched a
CAP reform public consultation process. As part of this process the Department
published a summary of the CAP reform agreed politically in June 2013 (DAFM, 2013a),
a guide to the financial ceilings under the direct payments regulation (DAFM, 2013b)
and a consultative paper on the CAP reform outcome (2013c). This last document
includes a questionnaire that those responding to the DAFM call for submissions are
asked to use in framing their contribution. In the DAFM consultative paper’s
questionnaire there is a total of 44 questions relating to the Direct Payments regulation.
Many of these questions are beyond the remit of Teagasc as a public sector body to
answer. However there are questions posed within the DAFM consultative paper which
Teagasc as the Irish Agriculture and Food Development Authority is well placed to
provide input on.

This submission has two principal parts – the first part relates to Teagasc’s responses to
elements of the DAFM consultative paper questionnaire that are not explicitly
redistributive (Section 3) and the second part is based on economic analysis of the more
explicitly redistributive elements of the CAP reform implementation options associated
with two optional elements of the CAP reform agreement - the Voluntary Coupled
Support Scheme (VCSS) and the Redistributive Payment Scheme (RPS). It is important to
note, however, that even where the issues addressed are of a technical nature, e.g. “the
Definition of Permanent Grassland and Pasture”, policy choices with regard to these
issues will have an impact on the distribution of direct income support payments
amongst Irish farmers.

There are specific questions within the questionnaire that Teagasc does not address in
its submission. These questions and the different sections of this submission within
which the numbered questions in the DAFM questionnaire are addressed are set out in
Table 1.

                                            1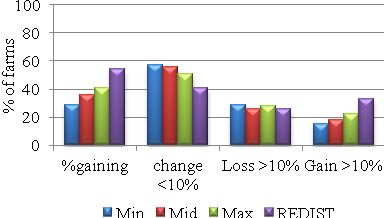
Table 1: DAFM Consultative Paper Questionnaire Questions addressed in Submission
                                   Question      Not          Section 3 Section 4
                                   No.           Addressed
Definition of Permanent Grassland 1, 2, 3                     X
Active Farmer                      4             X
Flexibility between Pillars        5, 6          X
Allocation of Entitlements under 7, 8, 9         X
the Basic Payment Scheme
Convergence                        10 - 15                                X
National Reserve                   16            X
National Reserve                   17                         X
Transfer of Entitlements           18            X
Redistributive Payment             19, 20, 21                             X
Greening                           22, 23, 24                 X
Permanent Grassland                25                         X
Ecological Focus Areas             26, 27, 28                 X
Young Famers’ Scheme               29, 30, 31,                X
                                   32
Coupled Support                    33, 34, 35,                            X
                                   36
Small Farmers’ Scheme              37            X
Small Farmers’ Scheme              38, 39, 40                 X
Areas of Natural Constraint        41, 42        X
Areas of Natural Constraint        43, 44                     X

2 Background
The CAP reform agreement on the Direct Payments regulation allows for a total of 7
schemes, 3 of which are mandatory and 4 of which are optional. With each of the
mandatory and optional schemes there are choices to be made by Member States
regarding implementation. In this section we briefly review the schemes and the shares
of the national financial ceiling that can be associated with each scheme.

The mandatory elements of the Direct Payments regulation relate to the Basic Payment
Scheme (BPS), the Greening Payment Scheme (GPS) and the Young Farmers’ Scheme
(YFS). Under the reformed CAP Member States can choose to implement a convergence
model under which levels of income support per hectare allocated under the BPS fully
converge on a national or regional average level by 2019 or they can choose to
implement an internal convergence model under which levels of direct income support
under the BPS converge on but do no reach a common rate by 2019. Under this latter
model, where an initial unit value of entitlement is less than 90% (or 100%) of the
national average, this unit value is increased by at least 1/3 of the difference between
the initial unit value’s level and 90% of the average level (or 100% of the average level)
by 2019. All entitlement unit values must reach at least 60% of the national average
entitlement value under the BPS by 2019. The increases in the BPS payment per hectare

                                            2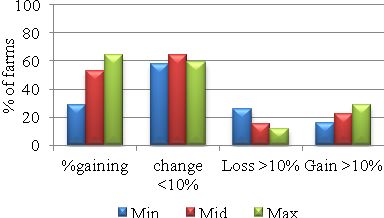
received by farmers under the internal convergence model are “funded” by decreases in
the BPS payments received by farmers with initial BPS unit values that are greater than
average. The magnitude of the proportionate decreases in unit value imposed on
farmers with above average initial unit values is that which in aggregate is sufficient to
fund the aggregation of the individual farm level gains in BPS payments under internal
convergence.

The share of the national direct payments financial ceiling that is allocated to the BPS
depends on the share of the national direct payments financial ceiling allocated to the
other mandatory and optional schemes. The share allocated to the BPS is the balancing
item in a fixed budgetary ceiling. If the share allocated to another scheme increases the
share allocated to the BPS must decrease. If all optional schemes are allocated the
maximum allowed share of the national ceiling, the GPS receives its minimum 30% of
the ceiling and the YFS its maximum allowed share of the national ceiling (2%) the
proportion of the direct payments ceiling allocated under the BPS can be as low as 25%.
Alternatively, if no optional schemes are implemented the share of the national direct
payments financial ceiling allocated under the BPS can be as high as 68%.

Member States must also allocate at least 30% of their direct payments budget to the
GPS. The allocation of this budget can be on a flat area basis (meaning that each eligible
hectare by 2019 would attract the same level of “greening” payment) or the allocation
can be on a basis proportional to BPS receipts under the implementation of the internal
convergence model. In the latter case farm level receipts under both the BPS and GPS
are determined by the internal convergence model.

Each Member State must have a Young Farmers Scheme (YFS), however the budget
allocation to this scheme is not mandated within the agreement; rather a maximum
allocation is set out (2%). The extent to which a Member State would need to allocate
the maximum share of the budget allowed to the YFS will depend on the implementation
choices allowed for under the agreement (see the discussion in section 3).

There are 4 optional schemes under the agreement on the direct payments regulation
these are the voluntary coupled support scheme (VCSS), the redistributive payments
scheme (RPS), the areas of natural constraint scheme (ANCS) and the small farmers
scheme (SFS). For these schemes there are maximum amounts of the Pillar I direct
payments budget that can be allocated, however Member States retain the discretion
over the magnitude of the budget allocated (within the maximums) and over important
implementation details of the schemes. The maximum, and where applicable the
minimum, direct payments ceiling shares of each of the mandatory and optional direct
payment schemes are presented in Table 2.

                                            3
Table 2 National Direct Payment Financial Ceiling Shares: Maximums & Minimums
                                                     National Financial Ceiling Share
Basic Payment Scheme (BPS)                Mandatory     Variable
Greening Payment Scheme (GPS)             Mandatory     Minimum 30%
Young Farmers Scheme (YFS)                Mandatory     Maximum 2%
Voluntary Coupled Support Scheme          Optional      Maximum 8%
(VCSS)
Redistributive   Payment    Scheme        Optional      Maximum 30%
(RPS)
Areas of Natural Constraint Scheme        Optional      Maximum 5%
(ANCS)
Small Farmers’ Scheme (SFS)               Optional      n.a.

3 Technical issues
In this section issues and questions in the DAFM consultative paper that were judged to
be of a more technical nature are addressed. As noted earlier these issues often have
direct incomes support distributional implications. Subsections on each of the blocks of
questions identified in Table 1 are used to address the issues raised in the DAFM
consultative paper (DAFM, 2013c).

3.1 Definition of Permanent Pasture and Grassland (Q1, Q2 and Q3)
       Q1 Should land where ‘grasses and other herbaceous forage’ are not predominant
       be considered as permanent grassland and consequently be eligible land for the
       purposes of direct payments?

       Q2 If land where ‘grasses and other herbaceous forage’ are not predominant is
       considered as permanent grassland, should Ireland apply a reduction coefficient so
       that the declared number of hectares converts into a reduced number of eligible
       hectares?

       Q3 Should Ireland apply a reduction coefficient to permanent grassland which is
       located in areas of natural constraints due to difficult climate conditions especially
       due to altitude, poor soil quality, steepness and water supply?

The areas which could be deemed eligible for the purposes of direct payment but where
“grasses and other herbaceous forage” do not predominate in an Irish context are taken
to refer to generally upland areas where heather predominates but could also include
limestone pavement in karstic regions such as the Burren. In both types of landscape
grazing is an integral part of landscape and habitat maintenance and where grazing is
shown to be currently taking place they are eligible for direct payments under the SPS.
The full inclusion of such areas as eligible for direct payments purposes would be
consistent with the current implementation of the CAP and its definition of eligible area.

Estimating the magnitude of a reduction coefficient to be applied to such areas on the
basis of agronomic or environmental attributes would be a large exercise. While the
implementation of such an adjustment would prevent large windfall gains from accruing

                                             4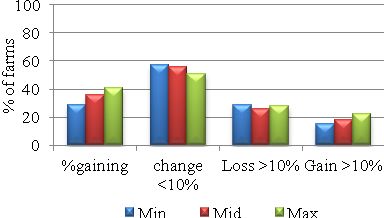
to land holders with large amounts of currently ineligible land, such concerns are likely
to be addressed in a less administratively burdensome manner via the implementation
of the internal convergence model that will limit the increase in entitlement values
under the BPS to 60% of the average BPS payment level per hectare..

There seems little basis for applying a reduction coefficient to permanent grassland
located in areas with natural constraints. Under the internal convergence model the
level of direct income support remains largely determined by historical levels of support
under the SPS. Many farms in areas of natural constraint, due to the physical
characteristics of their holding, were unable to farm at intensity levels during the
Fischler reform reference period that would have led them to be allocated high levels of
SPS entitlement per hectare. Given that the capacity to generate market based income
from agricultural activity in such areas is likely to be lower than in areas without natural
constraints it would not appear to make any sense to reduce the entitlement of farmers
in such areas to direct payment income support. The application of a reduction
coefficient to permanent grassland located in such areas would, other things equal,
further disadvantage such farms in terms of decoupled direct income support per
hectare.

3.2 National Reserve (Q17)
       Q17 Should Ireland apply additional criteria for ‘young farmers’ and for ‘farmers
       who commence their agricultural activity’ as regards appropriate skills and/or
       educational requirements?

The national reserve is to be created by the allocation of up to 3% of ceiling available to
the BPS in 2015, in subsequent years the reserve is replenished by unused entitlements
and potentially by the application of a clawback on entitlement transfers (see Q18).
Member States may add further criteria to the eligibility criteria set out in the
agreement. The additional criteria that should apply in determining eligibility for
payments funded from the national reserve should be equivalent to those that are
currently applied to determine eligibility for preferential tax treatment of farm
transfers. These additional eligibility criteria should be harmonised with the criteria for
eligibility for payments under the aegis of the mandatory Young Farmers’ Scheme (see
section 3.7).

3.3 Transfer of Entitlements (Q18)
       Q18 Should Ireland apply claw-back to entitlements transferred without land? If so,
       to which one or more types of transfer should claw-back be applied?

In principle the application of a clawback on entitlement transfers (without land) is a
sensible means of ensuring that the national reserve has sufficient funds over the course
of the period 2014-2020. The rate at which any clawback is applied should however not
be such that the funds raised are in excess of those likely to be needed to address the
issues for which the national reserve is designed to deal with.

                                             5
3.4 Greening (Q22, Q23 and Q24)
Q22 Should the greening payment be made on a flat-rate basis or as a fixed
percentage of a farmer’s Basic Scheme payment?
Q23 Should Ireland restrict the option of farmers using ‘equivalent practices’ to
meet the greening measure requirements?
Q24 Should Ireland use National Certification schemes enabling farmers to meet
their greening measure requirements?
Proportional greening, whereby individual greening payments received by farmers are
in proportion to the subsidies received under the BPS will see those farmers in receipt of
the largest BPS payments receiving the largest “greening” payment. In so far as such
farmers are those likely to incur higher costs to comply with the greening criteria a
proportional approach to greening would seem to be warranted on the basis of the
additional variable costs incurred.
However, the provision by farmers of environmental goods and services as well as the
costs of complying with greening criteria are likely to vary from farm to farm. To the
extent that large extensive farms supply valued environmental goods and services the
low level of greening payment that these farms would receive under the proportional
greening model may adversely affect their willingness to provide such environmental
goods and services on an ongoing basis. Whether applied on a proportional or a flat rate
basis, the Greening Payment Scheme (GPS) is an untargeted scheme. in effect.
Untargeted schemes are unlikely to succeed in changing the level of environmental
goods and services supplied by Irish agriculture or correctly compensate farmers for
additional compliance costs associated with the Greening criteria.
Despite the fact that (under proportional greening) tillage farmers on average will be
amongst the Irish farmers with the largest greening payment levels per hectare, they are
also the farmers that will have to incur the greatest greening compliance costs in Irish
agriculture. An appendix to this submission provides more detailed information (based
on the 2011 Teagasc NFS) on the number of farms with a tillage enterprise that are
likely to be negatively affected by the crop diversity and the ecological focus area
provisions of the new CAP greening payment criteria.
Regarding the use of equivalent practices (Q23) and national certification measures
(Q24), for most Irish farms satisfaction of the greening criteria will not lead to large
additional costs of compliance (except in the case of some tillage farmers, see the
Appendix to this submission). There would be additional administrative costs associated
with allowing farmers to meet greening criteria through these routes. However where
farms are green by definition under the agreement (e.g. organic) and such a designation
is associated with a national certification scheme, such measures should continue to
enable farmers to meet greening criteria.
63.5 Permanent Grassland (Q25)
Q25 Should the obligation for the maintenance of permanent grassland be applied
at national, regional, sub-regional or individual farmer level in Ireland?
Member States must ensure that the ratio of permanent grassland to total agricultural
area (established in 2012) does not decline by more than 5% when measured at one of
national, regional, sub-regional or individual farm levels. Member States have the option
to choose at which level of spatial aggregation the ratio is established. Given that at a
national level the 5% is unlikely to be exceeded but that at an individual farm level there
may be instances where a farm responding to market opportunities would exceed the
5% threshold, it may make sense to apply the limit at a level above that of the individual
farmer. How any penalties arising from exceeding the 5% threshold would be allocated
is also an issue that should be considered. Should farms, which under a regional or
national level implementation of the permanent grassland, did not exceed the 5%
threshold of reductions permanent grassland on their farms, suffer negative
consequences (in terms of direct payments under the GPS) if the actions of other
farmers led to the national or regional 5% threshold? Any additional administrative
and/or monitoring burdens associated with the implementation of the Permanent
grassland threshold at scales other than the individual farm scale should also be
considered.
3.6 Ecological Focus Areas (Q26, Q27 and Q28)
Q26 Which of the following areas should be considered as an eligible area in
Ireland?
•Land laying fallow;
•Terraces;
•Landscape features (hedgerows etc), including such features situated
adjacent to the arable land;
•Buffer strips including buffer strips covered by permanent grassland
•Areas of Agro-forestry that receive support under Article 44 of Regulation
(EU) No 1698/2009;
•Strips of land along forest edges;
•Areas of short rotation coppice with no use of mineral fertilizer and/or
plant protection products;
•Afforested areas in accordance with the provisions of Article 25(2)(b)(ii) –
SPS eligible afforestation.
•Areas of catch crops or green cover established by the planting and
germination of seeds;
•Areas of nitrogen fixing crops such as protein crops.
Q27 Should Ireland provide for collective arrangements to meet the EFA
obligations?
Q28 Should Ireland provide for the regional arrangements to partially meet the
EFA obligations?
7In general, Irish farmland contains a higher amount of common farmland habitats than
many equivalent types of EU farming systems, although less is known about tillage than
grassland systems. It would be beneficial (both for the cost-effectiveness and
environmental sustainability of the farming enterprise) for these existing farmland
areas to be considered as EFA, rather than imposing a requirement to create new EFA
that may be of lower ecological quality. Here, we provide specific comments on each of
the specific areas that are listed in the DAFM Consultative Paper:
Land laying fallow- this land should be eligible for consideration as EFA,
provided that it is managed for farmland wildlife
Terraces: these are not relevant to Irish situation.
Landscape features (hedgerows etc), including such features situated adjacent to
the arable land: Such areas should be eligible for inclusion as EFA, the current
restrictions on the width of such features (e.g. hedgerows) under the SPS should
not apply if these features are EFA (provided these features are managed for
farmland wildlife).
Buffer strips including buffer strips covered by permanent grassland: These
should also be eligible for inclusion in EGA provided that they are managed for
biodiversity and/or water quality.
Areas of Agro-forestry that receive support under Article 44 of Regulation (EU)
No 1698/2009: These areas should be eligible as EFA provided that they do not
replace existing farmland habitat of conservation value.
Strips of land along forest edges: Yes these should be eligible as EFA.
Areas of short rotation coppice with no use of mineral fertilizer and/or plant
protection products: These areas should be eligible as EGA since they can
promote wildlife and function as a buffer strip when adjacent to watercourses.
However, they should not replace existing farmland habitat of conservation
value.
Afforested areas in accordance with the provisions of Article 25(2)(b)(ii) – SPS
eligible afforestation: These areas should not be eligible for inclusion in EFA.
Areas of catch crops or green cover established by the planting and germination
of seeds: These areas should be eligible for inclusion as EFA if they are not
intended for use as grazing land but are rather intended to deliver on specified
environmental objectives, and provided that they do not replace existing
farmland habitat of conservation value.
Areas of nitrogen fixing crops such as protein crops. In Ireland, protein crops
are dominated by peas and beans. The total area planted in 2010 was
approximately 4,500 ha (circa 0.1 percent of total agricultural area). Teagasc
recommends that nitrogen is not added to these crops. Thus, Teagasc could
recommend inclusion of nitrogen-fixing protein crops as they address the
specific environmental objective of a land use type that reduces greenhouse gas
emissions.
Other areas that could also be considered as potential EFA would be
Margins along permanent field boundaries that are not defined as landscape
features
Species-rich grasslands
Other wildlife habitat areas that are not defined as permanent grassland and
pasture, including scrub, woodland, bog and wet rushy meadows that currently
area ineligible for support under the SPS.
Should Ireland provide for collective arrangements to meet EFA obligations (Q27)?
Collective arrangements involve groups of local farmers co-operating toward the
management of a landscape-scale environmental issue. In terms of improving the
8effectiveness of policy measures, this is likely to enhance effectiveness to a considerable
extent. Examples include catchment-scale approaches to manage water quality and
aquatic biodiversity, and multi-farm approaches to manage farmland habitats and rare
species with local distributions. For this reason, Teagasc suggest that collective
agreements should be encouraged and included in Agri-Environment Schemes (under
Pillar II). In the case of the specific conditions of EFA implementation in Ireland (which
will be mostly related to larger tillage farms), they should be considered as an option,
but in practice they may be of very limited practical relevance in Ireland.
Should Ireland provide for regional arrangements to partially meet the EFA obligations
(Q28)? Such arrangements should be allowed since this would allow existing features of
ecological benefit to contribute to the EFA obligations and lessen the need for creation of
new EFA. In general, Irish farmland has a relatively high proportion of ecological
features (compared to EU averages on comparable systems). Provision for regional
arrangements would be economically beneficial for a farming enterprise, and also help
to conserve existing ecological features that may be of higher ecological value than
newly established EFA.
3.7 Young Farmers’ Scheme (Q30, Q31 and Q32)
Q30 Should Ireland apply additional criteria for the Young Farmers Scheme as
regards appropriate skills and/or educational requirements?
Q31 What is the maximum number of hectares between 25 and 90 to which the
Young Farmers payment should be applied?
Q32 Which of the four methods for calculating the payment should be applied in
Ireland?1
The recently published Census of Agriculture 2010 reveals that the age profile of Irish
farming is getting older. To encourage the rejuvenation of agriculture in Ireland (and the
wider EU) the June 2013 Agreement requires all Member States to have a Young
Farmers’ Scheme (YFS). There are a number of options open to Member States in terms
of how they implement the YFS and over the maximum area over which the YFS
payment can be claimed. The different implementation options are likely to imply
different levels of expenditure on the YFS in an Irish context. It is possible that one or
more of the four YFS payment options and/or the use of a maximum area of 25 hectares
on which to claim the YFS payment (as opposed to the maximum allowed 90 hectares)
could lead to a level of expenditure less than the 2% of the national direct payments
ceiling maximum.
Option A will link the value of the YFS payment to the historical value of SPS
entitlements. It is not clear why it is necessary to differentially incentivize generational
change on the basis of historically held SPS entitlements.
1Details of the four different implementation options under the YFS can be found on pages 8 and
9 of the DAFM Consultative Paper (DAFM, 2013c).
9Option D, whereby the YFS is an annual lump sum payment based on 25% of the
national average payment per hectare (based on the total national ceiling) multiplied by
a fixed number of hectares. The fixed number of hectares allocated to all participating
farmers is the same and is calculated as the total number of eligible hectares of those
eligible for the scheme in the first year divided by the number of farmers applying for
the scheme in the first year. The one of nature of the fixed number of hectares
calculation may create incentives for young farmers to artificially increase the size of
their holding in the first year of the YFS operation. On this basis options B or C would
appear to be preferable to options A or D.
A choice to allocate the maximum budget possible to the YFS, either as a function of
which of the four YFS options implemented or the maximum claim level, has
consequences for the size of the financial ceiling available to fund the BPS. Due to
unavailability of data on potential farm successors and their farm areas it has not been
possible to analyse in detail the distributional impact of the mandatory YFS – however
given the information to hand on the age distribution of Irish farmers most will be
ineligible for this payment.
The criteria (including additional educational and training criteria) that will determine
eligibility for the YFS should be the same as those that will apply for the preferential
eligibility of young farmers to entitlements from the National Reserve (see section 3.2).
3.8 Small Farmers’ Scheme (Q37, Q 38, Q 39 and Q40)
Q 38 If so, should farmers with payment below €1250 be automatically included in
the scheme (with option to opt out)?
Q 39 Which of the four methods for the calculation of the payment (a, b, c or d)
should be applied?
Q 40 If one of options c. or d. is selected, should payments below €500 be rounded
up to €500?2
The Small Farmers’ Scheme (SFS) is an optional scheme. If applied in Ireland it would
reduce the administrative burden on farmers with very low levels of direct payment
entitlements. It may however have consequences for agricultural land mobility and
impede restructuring of agricultural holdings since farmers receiving the small farmers’
scheme payment would be required to have land (entitlements) on which the SFS is
established. If implemented farmers with total payments less than or equal to the
€1,250 threshold should be automatically included in the scheme with an option to opt
out if they choose it. Option C is preferred on the basis of simplicity in that eligible
farmers would receive the same payments on the same basis as all other farmers but
without the administrative burdens or the necessity to meet the greening criteria that
apply to the farmers that are ineligible for the SFS.
2Details of the four implementation options under the optional SFS can be found on page 10 of
the DAFM Consultative Paper (DAFM, 2013c).
103.9 Areas of Natural Constraint Scheme (Q41, Q 42, Q 43 and Q 44)
Q43 Should the payment be allocated to areas of natural constraints or be restricted
to specific subdivisions within such areas?
Q44 If applying the measure, should Ireland set a maximum number of hectares per
holding to which the payment is applied and, if so, what should that maximum be?
Due to lack of data it has not been possible to analyse the distributional implications of
implementing the optional Areas of Natural Constraint (ANC) Scheme.
This Pillar I measure, if implemented, would be in addition to payments made under a
Pillar II Rural Development Aid for Areas of Natural Constraint. The decision to
implement an ANC scheme under Pillar I should be made in conjunction with the
decision on the priorities for Ireland’s Rural Development (Pillar II) programme and the
level of funding available for areas of natural constraint under Pillar II. Due to the
voluntary nature of the Pillar I ANC scheme the decision to implement the Pillar I ANC
scheme will necessarily reduce the size of the budgetary ceiling available to fund the
BPS for which all farmers are eligible. The discussion of Q3 in Section 3.1 pointed the
reduced ability of farms in areas of natural constraint to carry high levels of stock and
the consequence of this for SPS entitlement levels. In so far as the application of the
internal convergence model leads to significant increases in levels of entitlements per
hectare in areas of natural constraint, the need for additional optional schemes that
advantage farms in such areas is reduced.
4 Analysis of CAP Reform Implementation Options
In this section the impact on the distribution of direct payment income supports, family
farm income and agricultural output of a defined set of CAP reform implementation
options are analysed using two datasets. The first dataset used comprises of individual
and anonymised farm records for 2010 from the Single Payment System database
augmented with linked anonymous farm level data from the Animal Identification and
Movement System (AIMS) database and the Sheep and Goat census database. The
second dataset used is the Teagasc National Farm Survey (NFS). The Teagasc NFS is an
annual representative survey of Irish farmers use to collect and report official statistics
on agricultural output, costs and farm.
The two datasets and the analysis conducted with each are complementary. The first
dataset allows us to derive the per hectare and per unit of agricultural activity subsidies
associated with each of the CAP reform implementation scenarios analysed and allows
for the analysis of the implications of different CAP reform implementation options on
the distribution of direct income support subsidies across the 132,752 farmers within
the SPS system. The Teagasc 2010 NFS sample is a stratified random sample of the Irish
agricultural farm population and its sampling frame is designed to be representative of
98% of Irish agricultural production. However, because the Teagasc NFS sampling frame
is narrower than the full population of Irish farms that are eligible for direct income
supports under the CAP it cannot be used to derive the per hectare and per unit of
agricultural activity payment levels associated with different CAP reform
implementation options. The key advantage offered by the Teagasc NFS that is exploited
11in the analysis presented in this submission is the capacity to provide microeconomic
information on agricultural output and family farm income levels. While the SPS
database contains information on standardised output levels for each farm, the absence
of cost of production information (such as that contained in the Teagasc NFS) means
that it cannot provide information on the income and potential output impacts of a CAP
reform policy implementation choice.
The remainder of this section is structured as follows in Section 4.1 we define the 5 CAP
reform implementation scenarios analysed. This is followed in Section 4.2 by a brief
description and the results of the analysis undertaken using the SPS dataset. In Section
4.3 the analysis undertaken using the Teagasc NFS dataset and the results obtained are
presented. Section 4.4 summarises the research findings and links the analysis
presented in Sections 4.2 and 4.3 to the questions contained within the DAFM
Consultative paper questionnaire.
4.1 CAP Reform implementation scenarios analysed
As outlined in the DAFM Consultative paper there are a wide range of implementation
choices facing Ireland (and other Member States) relating to the Direct Payments
regulation. Teagasc has not attempted to analyse all of the possible CAP reform
implementation options. The discussion in Section 3 addresses some of the questions
raised in the DAFM consultative paper and in this Section of the submission we report
the results of the analysis of 5 CAP reform implementation scenarios that examine the
impact of policy choices relating to the optional voluntary coupled support scheme
(VCSS) and the redistributive payment scheme (RPS).
In all of the scenarios analysed the internal convergence model is used to determine
farm level entitlement levels under the Basic Payment Scheme (BPS) and the
implementation of the Greening Payment Scheme (GPS) is proportional to the BPS. This
means that a farmer’s GPS payment per hectare is proportional to their BPS payment
level per hectare with the proportionality factor applied to all farms equal to the ratio of
the budgetary ceiling allocated to the GPS (fixed at 30% of the national payment ceiling)
and the budgetary ceiling available to the BPS. This ratio will vary across the different
CAP reform implementation scenarios because the budgetary ceiling available to the
BPS is a function of the budget allocated to the optional VCSS and RPS.
In all of the scenarios analysed the internal convergence model uses a minimum payment
level per hectare for 2019 equal to 60% of the average BPS payment level per hectare. In
all of the scenarios farmers with initial BPS unit values of between 90% and 100% of the
average BPS payment level see no change in their BPS payment level under the internal
convergence process. Farmers with less than 90% see their BPS payment level increase
over the period 2015 to 2019, while farmers with initial BPS payment levels per hectare
in excess of the average level see their BPS payments per hectare decline over the period
2015 to 2019.
In all of the scenario analysis presented below we look at the income support
distribution, family farm income impacts and potential agricultural output impacts using
12the financial ceilings for 2019 that are detailed in DAFM (2013b). This means that the
deduction of up to 3% of the BPS ceiling in 2015 to fund the National Reserve does not
complicate our analytic outcomes.
The five scenarios analysed are outlined in Table 3. The first scenario analysed is called
MIN. In this scenario no optional scheme is implemented (the budgetary allocation to
the VCSS and RPS is set to zero). Under this scenario the share of the national direct
payment ceiling that is allocated via the Basic Payment Scheme (BPS) is maximised.
With proportional greening and an assumption that the share of the national ceiling
allocated to the Young Farmers’ Scheme (YFS) is zero, 100% of the national direct
payment ceiling is allocated using the internal convergence model.
Three of the scenarios (MID, MAX and MAX Cows Only) look at different
implementations of the voluntary coupled support scheme (VCSS). The maximum share
of the direct payments ceiling that can be allocated to the VCSS in Ireland is 8%. In the
MID scenario 4% of the direct payments financial ceiling in 2019 is allocated to the VCSS
(the mid point in the range 0%-8%). In the MAX scenario we allocate 8% of the national
direct payments ceiling to the VCSS. In both the MID and MAX scenarios eligibility for
the VCSS payment and the value of the per farm payment are determined by the number
of suckler cows and breeding ewes farmed in 2010. In the MAX Cows Only scenario the
share of the budget ceiling allocated to the scheme is again set at the maximum
allowable level (8%) but per farm payments is linked exclusively to the number of
suckler cows farmed in 2010.
The final CAP reform implementation scenario examined looks at the impact of the
Redistributive Payment Scheme (RPS). Under the RPS Member States can allocate up to
30% of the national budgetary ceiling to a flat per hectare payment that, in Ireland,
would be paid on the first 32 hectares of a farm’s eligible agricultural area. In the
scenario analysed we set the allocation of the budget to the RPS at its maximum level
(30%). Table 3 sets out the budgetary allocations associated with each of the 5 scenarios
analysed.
Table 3 CAP Reform Implementation Scenario Budgetary Ceiling Shares by Scheme
BPS Budget GPS Budget VCSS Budget RPS Budget
Share (%) Share (%) Share (%) Share (%)
MIN 70 30 0 0
MID 66 30 4 0
MAX 62 30 8 0
MAX Cows Only 62 30 8 0
Redistributive 40 30 0 30
Payment Only
For each of the 5 scenarios analysed the SPS database is used to derive the average BPS
payment level using the eligible area associated with the 132,752 farms in the database
in 2010, the total receipts on each of these farms under the SPS, and the direct payment
ceiling available to the BPS in 2019. The average payment level under the BPS is highest
13in the MIN scenario and lowest in the Redistributive Payment scenario – reflecting the
change in the budgetary ceiling for the BPS under the different scenarios. These average
BPS payment levels per hectare and the associated 60% minimum payment level under
the BPS as well as the 90% threshold used in the application of the internal convergence
model are reported in Table 4.
Table 4: CAP Reform Implementation Scenario Subsidy Rates
MIN MID MAX MAX Redistributive
Scenario Scenario Scenario Cows Only Payment
Scenario Scenario
Average BPS (€/ha) 180 169 159 159 103
Minimum BPS (€/ha) 108 102 95 95 62
90% Threshold (€/ha) 162 153 143 143 92
VCSS (€/cow) n.a. 33 65 84 n.a.
VCSS (€/ewe) n.a. 5 10 n.a. n.a.
RPS (€/ha) n.a. n.a. n.a. n.a. 119
Proportional Greening 0.42857 0.4918 0.52632 0.52632 0.75
Factor
The SPS database (which includes data on eligible agricultural area per farm in 2010 and
suckler cow numbers and breeding ewe numbers per farm in 2010) is also used to
calculate the subsidy rates associated with the implementation of the MID, MAX, MAX
Cows Only and Redistributive Payment Only scenarios.
For the scenarios that analysed the impact of the implementation of the VCSS (MID, MAX
and MAX Cows Only) the number of suckler cows and breeding ewes on the 132,752
farms within the database are first converted into livestock (LU) equivalents. The
budgetary ceiling associated with each scenario was then divided by the total number of
LU eligible at a national level for the subsidy to give a subsidy rate per LU for each
scenario. Given the LU and animal number equivalences used (1 suckler cow equalling 1
LU and 1 breeding ewe equalling 0.15 of a LU), the per LU subsidy rates are reconverted
into per animal unit subsidies.
To calculate the RPS subsidy rate per hectare under the Redistributive Payment Only
scenario, the number of hectares on each farm within the SPS database up to an
including 32 ha was calculated and the sum of these areas across all 132,752 farms
within the database gives the total area eligible for a RPS payment. The RPS payment
level associated with the Redistributive Payment Only scenario of €119 per eligible
hectare is derived by dividing the total budgetary ceiling available under a 30%
allocation by the total area eligible for the RPS payment.
The subsidy rates for each of the 5 scenarios are reported in Table 4. Table 4 also
reports the coefficients used to determine the magnitude of each farm’s “greening”
payment under proportional greening. This coefficient is equal to the ratio of the
budgetary ceiling available to the GPS and that available to the BPS.
144.2 CAP Reform implementation scenario analysis using the SPS database
In this Section analysis using the SPS database developed and its use in analysing the
distributional implications of different CAP reform implementation options is described.
The impact of the five CAP reform implementation options outlined in Section 4.1 on
distribution of direct income support subsidies within Irish agriculture is described. The
five CAP reform implementation options are compared with one another on the basis of
which option delivers the highest total direct income subsidy on a per farm basis for all
of the farms within the database, with the results presented by farm type.
Section 4.2.1 Methodology
Each of the 132,752 farms within the SPS database is first allocated to one of seven farm
types using the European Farm Typology (CEC, 2009), information contained within the
SPS database (as augmented by the AIMS and Sheep and Goat Census databases) and
standard output coefficients used by the CSO and the Teagasc National Farm Survey.
Figure 1 shows the allocation of the SPS farm population across the 7 farms types
(Dairy, Mixed Livestock, Cattle Rearing, Cattle Other, Sheep, Tillage and Other). What is
clear from Figure 1 is the dominance (in terms of number of farms) of the two cattle
farm types (Cattle Rearing and Cattle Other), which together account for over 57% of
farms.
Figure 1 SPS Farm Population by Type of Farm
For each farm within the SPS database its initial unit value under the BPS in 2019 for
each of the 5 scenarios is then determined. To do this each farms SPS payment per
eligible hectare declared is multiplied by each farm’s eligible area declared in 2010 to
give each farms total SPS receipt. The sum of these individual farm level receipts in 2010
gives us the global budget spent by the SPS system in 2010. The ratio of the 2019
budgetary ceiling for the BPS in 2019 under each of the scenarios analysed determines
the factor by which individual farmer SPS entitlement values per hectare are reduced by
15in order to determine their BPS initial unit value. This reduction factor accounts for the
allocation of budgetary ceilings to the mandatory GPS, to the optional VCSS and RPS and
also accounts for the roughly 3% reduction in Ireland’s Pillar I budgetary ceiling for
direct payments that will occur between 2010 and 2019. Table 5 provides the
adjustment factors used across the 5 scenarios to determine each farm’s BPS Initial unit
value level.
Table 5 Adjustment coefficients used to determine BPS Initial Unit Values
MIN MID MAX MAX Cows Redistributive
Scenario Scenario Scenario Only Payment Only
Scenario Scenario
Adjustment 0.6775 0.5904 0.5517 0.5517 0.3872
coefficient
Given a BPS initial unit value for each farm and under each scenario, all farms within the
SPS database are allocated to one of the three farm categories defined under the internal
convergence model. These three categories are i) those farms with a BPS initial unit value
less than 90% of the average BPS initial unit value, ii) those farms with BPS initial unit
values in excess of the average BPS initial unit value, and iii) those farms with BPS initial
unit values greater than or equal to 90% of the average but less than or equal to 100% of
the average BPS unit value.
The first category of farms are those farms that see their BPS payment per hectare
increase under the internal convergence model, the second category for farms are those
farms that see their BPS payment per hectare decline while the final category of farms
are those farms that see no change in the level of BPS payment per hectare under the
internal convergence model. Which category a farm falls into is not affected by which
scenario is analysed but by the level of SPS per hectare received in 2010.
Figure 2 illustrates the distribution of farms across the three internal convergence
categories (gaining, losing and no change) by farm type. What is obvious from Figure 2 is
that the proportion of each farm type that falls in each internal convergence category is
very different. Most dairy farmers and tillage farmers will see reductions in BPS per
hectare under the internal convergence process while most sheep farmers will see gains
in BPS per hectare. On cattle rearing farms a small majority of farms gain under
convergence (51%). On cattle other farms the number of farms gaining from
convergence (48%) is larger than those losing under convergence (45%).
16Figure 2 Farms Categorised by impact of internal convergence on BPS Payment levels
Section 4.2.2 Results using SPS database
Having categorised each farm on the basis of its BPS initial unit value each farm’s total
subsidy entitlement in 2019 was calculated for each CAP reform implementation
scenario on the basis of the farm’s eligible area, the number of suckler cows on the farm
and the number of breeding ewes on the farm in 2010.
The magnitude in millions of euro that farms in the category of farms that gain
additional per hectare BPS payment levels under the internal convergence model is
presented in Table 6 for each of the scenarios analysed. Those farms with BPS initial
unit values in excess of the average will see their BPS payment levels fall under internal
convergence. The magnitude of the reduction in BPS payment per hectare is calibrated
to ensure that the funds raised exactly matches the funds required to increase the BPS
levels of those farms with BPS initial unit values less than 90% of the average level.
Each farm with an initial payment level under the BPS in excess of the average level will
see the difference between their initial level and the average level of payment under the
BPS proportionately reduced. This proportionate reduction in the difference between
initial and average BPS unit values experienced by farms with BPS initial unit values in
excess of the average level, also reported in Table 6, is the same across all scenarios
analysed. Under the MIN model, the average level of BPS payment per hectare is €180, a
farmer with an initial BPS payment level of €280 would by 2019 see their payment
reduced by approximately €39.24 euro (or approximately 14%), while a farm with an
initial payment level one euro greater than the average level under the BPS would see an
absolute reduction in their payment level of approximately €0.39 which is close to a 0%
reduction in overall BPS payment per hectare.
17Table 6 BPS transfers from losers to gainers under the internal convergence model
MIN MID MAX MAX Cows Redistributive
Scenario Scenario Scenario Only Payment
Scenario Scenario
Increase in 78.9 74.4 69.9 69.9 45.1
BPS receipts
of gainers
(€m)
Proportionate 0.3924 0.3924 0.3924 0.3924 0.3924
reduction
factor
Each farm’s “greening” payment per hectare is then calculated for each scenario using
the proportional greening coefficient reported in Table 4. Each farm’s receipts under the
VCSS and RPS under each of the 5 scenarios are calculated using their levels of the
supported agricultural activity or eligible area in 2010 and the subsidy rates reported in
Table 4.
For each farm within the SPS database the total subsidy receipt in 2019 is calculated as
the sum of the receipts under the BPS, the GPS, the VCSS and the RPS. Farms that lose
under the process of internal convergence (that determines levels of support under the
BPS and GPS) may see those losses mitigated by gains under the VCSS and RPS. Given
the receipts of each farm under each of the CAP reform implementation scenarios it is
possible to rank the scenarios on the basis of which CAP reform implementation option
delivers the highest total subsidy receipt, referred to here as the “preferred scenario”.
In Figure 4 the MIN, MID and MAX scenarios are compared with one another in terms of
numbers of farms (by farm type) that prefer one of these three scenarios over the
others. What is clear from Figure 4 is that no farm prefers the MID scenario. If a farm
prefers MID to MIN this occurs because the gain from the coupled payment outweighs
the loss from the reduced BPS payment received. In all instances where MID is preferred
to MIN, MAX is preferred to MID. The preference for MAX over MIN and for MIN over
MAX is very different from farm type to farm type. Dairy and Tillage farmers
overwhelmingly “prefer” the MIN implementation scenario where no payments are
coupled to beef cows and ewes. This outcome arises because the reductions in the BPS
payments levels incurred by these farms to “fund” the establishment of the VCSS are not
fully offset by gains under the VCSS. The opposite is generally the case for most Cattle
Rearing and Sheep farms where the MAX option is generally preferred. On some Cattle
Rearing and Sheep farms with very high levels of SPS entitlement per hectare the gains
from the coupled payment scheme (VCSS) are insufficient to completely offset the losses
in BPS payment level required to fund the establishment of the VCSS. On Cattle Other
farms (farms that generally fatten purchased cattle for slaughter) the majority of farms
would “prefer” the MIN scenario over the MAX since on such farms the losses in BPS per
hectare required to fund the establishment of the VCSS are greater than the magnitude
of the gains per hectare from the VCSS.
18Figure 4 CAP reform implementation scenarios: MIN, MID and MAX
Under the MID and MAX scenarios the eligibility for the coupled payment is based on
numbers of suckler cows and breeding ewes held in 2010. If the eligibility criteria for
the coupled payment are narrowed to suckler cows only, as in the MAX Cows Only
scenario, the preferred scenario changes. Under the MAX Cows Only scenario the per
cow subsidy increases over the MAX subsidy rate and as a result those Cattle Rearing
farms that preferred the MAX scenario almost uniformly switch to preferring the MAX
Cows Only implementation scenario. Sheep farmers unsurprisingly still prefer a CAP
reform implementation option which continued to link the coupled payment to their
principal agricultural activity (MAX).
Figure 5 CAP reform implementation scenario: MIN, MID, MAX & MAX Cows Only
19The final scenario analysed is the Redistributive Payment Only scenario. Under this
scenario 30% of the national financial ceiling for direct payments is allocated to the RPS
and this ceiling is used to fund a flat rate payment of €119 per hectare that is payable on
the first 32 hectares of all farms. The 32 hectare maximum claim limit means that the
RPS preferentially allocates subsidy entitlement to farms of average and below average
size. The preferences of farms when all 5 scenarios are examined are reported in Figure
6. Across all farm types many farms with either entitlement values that are less than the
national average and/or farms of average to less than the average size prefer the
Redistributive Payment Only scenario. The preference for farms of 32 ha or less for the
redistributive payment is intuitive, they get the Redistributive Payment on all of the area
they farm whereas farms with greater than average size only receive the Redistributive
Payment on the first 32 hectares farmed. However, even for farms of greater than 32
hectares the Redistributive Payment Only implementation option may sometimes be
preferred. This outcome occurs where such farms have very low BPS initial unit values.
Under the Redistributive Payment only scenario their payment per hectare increases all
the way to the national average on the first 32 hectares farmed. The gains from the
transition to a flat area payment on the first 32 hectares may be sufficient to outweigh
the losses incurred on areas in excess of 32 hectares that receive a lower level of BPS
payment as a result of the implementation of the voluntary redistributive payment.
Figure 6 Reform implementation scenarios: MIN, MID, MAX, MAX Cows Only &
Redistributive Payment Only
4.3 CAP Reform implementation scenario analysis using the Teagasc NFS database
In Section 4.1 the information required to simulate the static impact of the 5 scenarios
using data on farms within the Teagasc NFS was presented. In this Section the impact of
the five scenarios are reported.
20You can also read