Half Year 2019 Results Presentation - 1 August 2019
←
→
Page content transcription
If your browser does not render page correctly, please read the page content below
Half Year 2019
Results Presentation
            1 August 2019
Contents

           Bill Winters                                             2 and 18
           Group Chief Executive

           Andy Halford                                                   5
           Group Chief Financial Officer

           Appendix                                                      27
              Macroeconomic outlook and interest rate sensitivity         28

              Group financial analysis                                    31

                Client segment financial analysis                         35

                Region financial analysis                                 43

              Fixed income information                                    50

              Definitions and important notice                            66

                                                                               1
Bill Winters

Group Chief Executive

                        2
From turnaround to transformation: 1H’2019

Good progress; on track

•   We made good progress in the first half
    ▪ Income up 4% and profit up 13% at constant currency1

•   Our focus on our clients and strategic priorities is paying off
    ▪ Network and affluent income grew; productivity is improving; multiple digital initiatives underway

•   We are on track to achieve our financial targets
    ▪ Return on tangible equity – our primary performance measure - improved 88bps to 8.4%

•   Sentiment in our markets is delicately balanced
    ▪ Geopolitical conditions remain turbulent
    ▪ Global growth has slowed and interest rates face downwards pressure …
    ▪ … but growth is still being driven disproportionately by markets in our footprint

•   We are investing now to create optionality for the future

             1.   Income up 1% and underlying profit up 11% reported basis
                                                                                                           3
Our strategic priorities and financial framework

Strategic priorities                                                                         Financial framework 2019-2021

                                                                                                 RoTE1:                             > 10% by 2021
                          Deliver our
                           network

                                                                                                 Income:                            5-7% CAGR1
   Transform                                           Grow our
   and disrupt                                          affluent
   with digital           Purpose                      business                                  Expenses:                          Cost growth < Inflation2
                            and
                           people                                                                                                   Positive jaws3

                                             Optimise                                            Capital:                           13-14% CET1 ratio1
            Improve                             low-
           productivity                      returning
                                              markets                                                                               2x dividend4
                                                                                                                                    Invest/distribute surplus5

              1. RoTE: underlying return on tangible equity / CAGR: compound annual growth     4. The FY’18 full-year ordinary dividend per share has the potential to double by 2021
                 rate / CET1: common equity tier 1                                             5. Subject to regulatory approval
              2. Excluding the UK bank levy                                                                                                                                             4
              3. Positive jaws = income growth > cost growth, excluding the UK bank levy
Andy Halford

Group Chief Financial Officer

                                5
We delivered an encouraging financial
performance in 1H’19                                                                                                          Financial framework                Strategic priorities

($bn)                                     1H’18       1H’19        YoY1         Ccy2
Operating income                           7.6          7.7         1%           4%               •     Income up 1%; 4% constant currency
Operating expenses                         5.1          5.0         3%          (0)%
                                                                                                  •     Operating expenses 3% lower; flat constant currency
Pre-provision operating profit             2.5          2.7         8%          10%
                                                                                                        ▪ Strong operating leverage with 4% positive jaws
  Credit impairment                        (0.3)       (0.3)        13%
                                                                                                  •     Pre-provision operating profit up 8%
  Other impairment                         (0.1)       (0.0)        59%
  Profit from associates                    0.2         0.2         (7)%                          •     Further reduction in credit impairment / loan-loss rate
Underlying profit before tax               2.4          2.6         11%         13%               •     1H’19 tax charge includes $179m for entity restructuring
  Provision for regulatory matters           -         (0.2)         nm
                                                                                                  •     Risk-weighted assets3 broadly flat compared to 1H’18
  Restructuring and other items            (0.0)        0.0          nm
                                                                                                        ▪ Maintain guidance of RWA < income growth 2019-21
Statutory profit before tax                2.3          2.4         3%           5%
                                                                                                  •     Statutory EPS down 7% due to provisions and higher tax
Risk-weighted assets3                      272          271        (0)%
                                                                                                  •     CET1 remains strong, in the middle of 13-14% target range
Underlying EPS (cents)                    44.9         49.1          9%
                                                                                                        ▪ Stated after full 39bps impact of $1bn buy-back
Statutory EPS (cents)                     40.7         38.0         (7)%

Dividend per share (cents)                 6.0          7.0         17%                           •     Interim ordinary dividend of 7 cents per share, up 1c / 17%
CET1 ratio (%)                            14.2         13.5       (68)bps
                                                                                                  •     Return on tangible equity up 88bps to 8.4%
Underlying RoTE (%)                        7.5          8.4       88bps

                 1. YoY = year-on-year variance is better/(worse) other than for risk-weighted assets (RWA) and common equity Tier 1 (CET1), which is increase/(decrease)
                 2. Ccy = year-on-year variance on a constant currency basis
                 3. Risk-weighted assets (RWA) are a measure of the Group’s assets adjusted for their associated risks                                                                  6
Our primary performance measure RoTE1
continues to improve Financial framework Strategic priorities
RoTE increased 88bps driven by strongly positive jaws and improved impairment combined with lower equity
0.3%
0.2% 8.4%
0.7% 0.6%
(0.3%)
7.5% (0.5%)
NFI
1H’18 Net interest income Fees and Expenses Impairment Tax Equity 1H’19
other income
1. RoTE: underlying return on tangible equity
71H’19 income up 1%; 4% constant currency Financial framework Strategic priorities
1H’19 YoY growth driven by Transaction Banking and Financial Markets, partially offset by Treasury
Income ($m)
+4%
7,696
7,649
7,425
(224)
1H’18 Foreign 1H’18 Transaction Financial Retail Wealth Lending & Corporate Treasury 1H’19
exchange constant Banking Markets Products Management1 Portfolio Finance & Other
adjustment currency Management
1. Wealth Management includes $28m in 2Q’19 relating to the increased recognition of part of an annual bancassurance bonus vs 2Q’18
82Q’19 income up 3%; 6% constant currency Financial framework Strategic priorities
Income in 2Q’19 was up 6% on a constant currency basis
Income ($m)
+6%
3,883
3,776
3,669
(107)
2Q’18 Foreign 2Q’18 Financial Transaction Wealth Retail Corporate Lending & Treasury 2Q’19
exchange constant Markets Banking Management1 Products Finance Portfolio & Other
adjustment currency Management
1. Wealth Management includes $28m in 2Q’19 relating to the increased recognition of part of an annual bancassurance bonus vs 2Q’18
9Every client segment generated positive
jaws and improved RoTE1 in 1H’19 Financial framework Strategic priorities
3% growth in client segment income and 6% on a constant currency basis
Corporate &
Institutional Banking 1H YoY2 Retail Banking 1H YoY2
Income $3.6bn 5% 2Q = 6% Income $2.6bn (1)% 2Q = 4%
Costs $2.1bn 4% Jaws = +9% Costs $1.8bn 3% Jaws = +2%
Profit Profit before
$1.4bn 24% $0.6bn 0%
before tax tax
RWA3 $138bn (1)% RWA3 $43bn 0%
RoTE1 10.0% 2.4%pt RoTE1 14.6% 0.4%pt
Commercial Banking 1H YoY2 Private Banking 1H YoY2
Income $0.7bn 6% 2Q = 6% Income $0.3bn 13% 2Q = 24%
Costs $0.4bn 8% Jaws = +14% Costs $0.3bn 8% Jaws = +21%
Profit before Profit before
$0.3bn 104% $0.1bn nm
tax tax
RWA3 $32bn (5)% RWA3 $7bn 6%
RoTE1 9.1% 4.8%pt RoTE1 15.7% 16.6%pt
1. Return on tangible equity: Group average tangible equity is allocated to client segments based on average RWA and the global level underlying effective tax rate is
applied uniformly
2. 1H YoY = Year-on-year (1H’19 vs 1H’18) variance is better/(worse) other than for risk-weighted assets (RWA), which is increase/(decrease) 10
3. RWA = risk-weighted assetsWe saw broad-based improvement in
operating profit in most markets Financial framework Strategic priorities
Strong profit improvement in ASEAN & South Asia and Africa & Middle East; Europe & Americas impacted by DVA2
Greater China &
North Asia 1H YoY1 ASEAN & South Asia 1H YoY1
Income $3.1bn (1)% 2Q = 1% Income $2.1bn 3% 2Q = 9%
Costs $1.8bn 4% Jaws = 3% Costs $1.3bn 5% Jaws = 8%
Profit before Profit before $0.8bn 29%
$1.3bn 3%
tax tax
RWA3 $85bn 2% RWA3 $94bn (2)%
Africa & Middle East 1H YoY1 Europe & Americas 1H YoY1
Income $1.3bn (3)% 2Q = (9)% Income $0.8bn (9)% 2Q = 1%
Costs $0.9bn 8% Jaws = 5% Costs $0.7bn 3% Jaws = (6)%
Profit before Profit before
$0.4bn 14% $0.0bn (85)%
tax tax
RWA3 $52bn (4)% RWA3 $43bn 4%
1. 1H YoY = Year-on-year (1H’19 vs 1H’18) variance is better/(worse) other than for risk-weighted assets (RWA), which is increase/(decrease)
2. DVA = debit valuation adjustment, being an adjustment to the fair value of derivative contracts that reflects the possibility that the Group may default and not pay the full
market value of contracts 11
3. RWA = risk-weighted assetsLower contribution from Central & other items Financial framework Strategic priorities
Segment Centrally managed Region
Treasury Markets Treasury Capital
Principal Finance
Associates and Corporate Centre costs
Joint Ventures Portfolio Management
Strategic investments
Other non-segment
specific items UK bank levy Other global items
Central & other items (segment) Central & other items (region)
($m) 1H'19 1H'18 YoY%1 ($m) 1H'19 1H'18 YoY%1
Income 442 601 (26) Income 346 233 48
Costs 344 280 23 Costs 286 199 44
Profit before tax 251 511 (51) Profit before tax 66 5 n.m.
RWA 51 52 2 RWA (2) (2) (8)
Income: Income:
▪ Higher rates paid on liabilities by Treasury Markets ▪ Favourable change in hedge ineffectiveness in Treasury
Capital
▪ The adoption of IFRS 16 and India tax refund in 2018
▪ Partially offset by favourable change in hedge ineffectiveness
in Treasury Capital
1. YoY = Year-on-year (1H’19 vs 1H’18) variance is better/(worse) other than for risk-weighted assets (RWA), which is increase/(decrease)
12Tight control over expense growth is
creating capacity to invest Financial framework Strategic priorities
Annual investment spend to continue at elevated FY’18 level of around $1.6bn
Operating expenses1 ($bn)
9.9 10.1
5.1 5.0 • Operating expenses down 3%; flat constant currency
▪ Regulatory costs declined 14%; lower than in 1H’17
4.8 5.1 5.0 • Gross cost efficiencies contributed to 4% positive jaws
2017 2018 2019 • Continue to target annual cost growth below inflation …
1H 2H
Cash investment ($bn) • … and positive jaws between 2019-2021
• Intend to maintain investment at around FY’18 level
1.6 ~1.6
▪ Costs in 2H’19 > 1H’19 due mainly to project
1.5 phasing
1.0
0.9
0.6 0.6 0.7
2017 2018 2019
1H 2H
1. Excludes the UK bank levy, which is paid in the second half of the year 13Credit quality has improved overall YoY1 Financial framework Strategic priorities
Sustainable growth, solid foundations
Loan / credit impairment ($m)2
583
-13% • Credit quality improved YoY
293
583 • Credit impairment down 13%
293 254
▪ Includes $48m release in Private Banking
1H’17 1H’18 1H’19 ▪ 17bps3 of loans and advances (FY’18: 21bps)
Credit quality ($bn)4 • Gross stage 3 NPLs5 down $706m
1.0 ▪ 2.3% of gross loans and advances (FY’18: 2.6%)
1.5 • Cover ratio after collateral remains stable at 81%
6.9 1.4
4.8
4.1 • Investment grade % of corporate book down 5%pt to 57%7
7.7 6.9 6.2 • Other impairment $21m: ship leasing now in restructuring
30.06.18 31.12.18 30.06.19
Stage 3 Early Alerts CG126
1. YoY = year-on-year (1H’19 vs 1H’18) 5. NPL: non-performing loan
2. IFRS9 became effective from 1 January 2018. Comparable periods have not been restated 6. Credit Grade 12 accounts
3. Credit impairment for loans & advances to customers over average loans & advances to 7. Decline mainly due to the reduction in repurchase agreements with 14
customers (2018 includes both ongoing business and the liquidation portfolio) clearing brokers
4. 2018 includes the liquidation portfolio transferred into ongoing business from 1 Jan 2019Balance sheet growth, NIM stable1 Financial framework Strategic priorities
Broad-based balance sheet growth… …with an improving mix
Average assets ($bn)2 YoY1
1H’18 1H’19 YoY
129 112 116
Gross asset yield (bps) 299 339 40bps
253 260 266 5%
Gross liability rate paid (bps) 160 207 47bps
6%
301 302 319 Net interest margin (bps) 159 159 - -
1H’18 2H’18 1H’19 Net interest income3 ($bn) 4.4 4.6 6%
Non-interest earning assets
Other interest earning assets
Customer interest earning assets • Higher asset yields: rising interest rates, change in mix
Average liabilities ($bn)2 YoY1
• Growth: interest-earning assets > interest-bearing liabilities
144 148 138 ▪ Partly offset by increases in rate paid on liabilities
55 53 53 (4)%
• Targeting funding efficiencies, including via regional hubs
487 482 509 5% ▪ ~$300m annualised NII benefit by 2021
• Interest rate risk in the banking book
1H’18 2H’18 1H’19
▪ Estimated 1yr earnings sensitivity to +/- 50bps c.$200m4
Other non-interest bearing liabilities and shareholder funds
Non-interest bearing customer accounts & deposits to banks
▪ Assume parallel shift in yield curves at beginning of period
Interest bearing liabilities
1. YoY = year-on-year (1H’19 vs 1H’18) / NIM = net interest margin (net interest income divided by average interest earning assets)
2. IFRS9 became effective from 1 January 2018
3. Net interest income (NII) is the difference between interest received on assets and interest paid on liabilities 15
4. See ‘Macroeconomic outlook and interest rate sensitivity’ in AppendixStrong capital is supporting both growth
and share buy-backs Financial framework Strategic priorities
CET1 ratio1 (%)
-13bps
0.7
14.2
(0.2)
• 60bps from buy-back2, entity restructuring and provisions
(0.4)
13.6
13.5 • Underlying CET1 reduction of 13bps
(0.2)
(0.6)
▪ 73bps profit accretion offset by dividends and RWA1
2018 Buy- Restructuring 2018 Underlying Dividends3 RWA and 1H’19
backs2 and underlying profit after other
regulatory CET1 tax
Risk-weighted assets ($bn)
+$12bn
• RWA1 flat YoY; up 5% / $12bn from FY’18 to $271bn
3.5
11.5
1.2 270.7 ▪ Credit RWA increase from asset growth and IFRS 16
(0.4)
(2.7) (0.6)
▪ Market RWA growth driven by Financial Markets
258.3
▪ RWA optimisation initiatives ongoing
• Income RoRWA1 = 5.7% (up every year since FY’15)
• Maintain guidance of RWA < Income growth 2019-21
2018 Credit Market Operational RWA Model FX 1H’19
Risk Risk Risk Efficiencies Changes4
1. Common equity tier 1 ratio: a measure of CET1 capital as a percentage of RWA / RWA = risk-weighted assets / RoRWA = annualised profit as a percentage of RWA
2. CET1 ratio impact of $1bn share buy-back programme and the acquisition of shares to satisfy remuneration-related employee awards to avoid share count dilution
3. Dividends include paid and foreseeable Tier 1 (preference share and Additional Tier 1) distributions and ordinary share dividends
16
4. Model changes includes +$0.7bn Credit Risk and +$0.5bn Market RiskGood early progress delivering the
financial framework outcomes Financial framework Strategic priorities
2019-2021 target 1H’19
1 +88bps • 1H’19 RoTE 8.4% (2H includes levy)
RoTE >10% by 2021
(YoY) • Continue to target >10% by 2021
• 4% in 1H’19 constant currency …
1 4% • … and 5% also excluding DVA
Income 5-7% CAGR (constant
currency) • 1% on a reported basis
• FX likely to keep reported FY’19 cost growth, excluding the UK bank levyBill Winters
Group Chief Executive
18Investing in our network continues to
deliver income growth at premium returns Financial framework Strategic priorities
Clients 1H YoY1
‘Next + New’ income2
+24%
• Improving penetration of ‘Next and New’ clients2
▪ Particularly with OECD-based clients
Income
2.4
• Network income is growing relatively quickly …
Network³ 2.2
2.0 +9%
($bn) • … and delivering premium returns
• Reconfiguration of supply chains at an early stage…
Network %4 66% 68% 69% +53bps
• ... but is already creating opportunities
Network Capital-lite %5 55% 59% 60% +81bps
• Continued focus on supporting China opening
ROTE ▪ Awarded ‘Best Global RMB Bank’6
Network3 10% 13% 18% +530bps • ASA and AME footprint has enabled strong
sovereign client flows
Corporate & 5% 8% 10% +239bps
Institutional Banking
1H’17 1H’18 1H’19
1. 1H YoY = year-on-year (1H’19 vs 1H’18) variance is better/(worse) 4. Network income as a % of Corporate & Institutional Banking Income
2. ‘Next’ clients are those that have the potential to deliver significant and sustainable income (excluding risk management, trading and ship leasing)
growth; ‘New’ clients are new-to-bank, mainly based in OECD markets 5. ‘Capital-lite’ income is that generated from products with lower capital usage 19
3. ‘Network’ income is that generated outside of a client’s headquarter country (excluding risk or of a non-funding nature
management, trading and ship leasing) 6. Asset Asian Awards (Triple A), April 2019Our affluent business showed resilience in
less buoyant conditions Financial framework Strategic priorities
Clients 1H YoY1
• We are attracting new affluent clients …
Number of Retail +14%
Banking Priority clients2 • … that generate higher returns
Private Banking Net New 1.7 +$1.7bn • Private Banking in-flows picked up significantly
Money ($bn) 0.6 0.0 • Priority segment income is growing as a proportion
Income
• Product income mix is improving
Wealth Management + 56% 60% 65% +500bps
Deposits % of Retail Banking
• Deposit balances from Priority and Premium up 9%
1.7 1.8
1.5
Affluent3 ($bn) +5% ▪ Now 75% of total Retail Banking deposits
• Investing to strengthen our affluent proposition
Affluent3 % of Retail Banking
+ Private Banking 58% 60% 63% +275bps ▪ FX Derivatives platform award:
“Best Initiative of the Year in relationship
ROTE management”4
Affluent³ 28% 30% 32% +169bps
• ‘Premium‘ banking service available in eight markets
Retail Banking + 10% 12% 15% +241bps ▪ Two more planned for 2H’19
Private Banking
1H’17 1H’18 1H’19
1. 1H YoY = year-on-year (1H’19 vs 1H’18) variance is better/(worse)
2. Number of qualified priority banking clients in the top 10 Retail Banking Priority markets, based on May YTD for all periods
3. Affluent income is that generated from Priority and Premium clients in the Retail Banking segment and from clients in the Private Banking segment 20
4. Financial Times PWM Wealth Tech Awards 2019Returns in our four targeted markets
improved in 1H’19 Financial framework Strategic priorities
India Korea UAE Indonesia
Income
Reported / constant currency (YoY) 4% / 11% (5)% / 1% (8)% / (8)% 4% / 8%
Profitability
Cost-to-income ratio1
Underlying profit before tax1 24% (8)%2 34% 26%
• Digitisation / reset • Cost, capital and RWA • Streamline / reset cost • Higher quality MNC
Aggregate PBT (1H’19) cost base actions base income
✓ 2/3 clients now ✓ $650m capital return ✓ Implementing ✓ Global Subsidiaries
digitally active ✓ RWA reduced rationalisation income +34%
$380m ✓ Headcount -1,300 initiatives ✓ Network income ~2x
• Higher quality income • Grow differentiated • Grow Affluent and • Test disruptive retail
(+14% YoY) ✓ Global Subsidiaries income Network businesses digital platforms
income +18% ✓ Network income ✓ Network income – Early stage
✓ RWA down; capital- +14% +4%
lite income up ✓ Priority NTW 3 clients
per RM up ~70%
1. indicates a lower (better) cost-to-income ratio YoY / indicates a higher (worse) cost-to-income ratio YoY
2. Korea 1H’19 Profit Before Taxation growth was +7% excluding a one-off PDRS (Personal Debtor Rehabilitation Scheme) recovery in 1H’18
3. NTW = new-to-wealth, being Priority clients with no product holdings in last 12 months and a Wealth Management product purchased in the current reporting period 21We are driving operational improvements
to scale revenue and improve efficiency Financial framework Strategic priorities
Clients
1H YoY1
• Client onboarding turn-around-times are improving
Retail Banking %
16% 21% 25% +350bps
of digital sales2
• 3% (~2.5k) YoY reduction in full-time employees
16
Corporate & Institutional ▪ ~2k reduction in non-employed workers6
8 7 -1 day
Banking on-boarding³ (Days)
• Investing in digitisation to enhance customer
Income productivity experience and support productivity improvements
177 ▪ Refreshed CIB client digital platform with unified
Income per FTE4 170
+4% Trade and FX capabilities
($000s) 165
▪ Launched real-time client onboarding for digital
channels in Retail Banking
RAR per client-facing FTE5 457 517
+13% • Aligning the organisation around client journeys, eg:
($000s)
376
▪ Cash Management cross-border payments
Cost efficiency ▪ Retail credit card and personal loan on-boarding
Cost:income ratio 66% 67% 65% -233bps
• Establishing a capital and liquidity hub in Hong Kong
to make more efficient use of the balance sheet
1H’17 1H’18 1H’19
1. 1H YoY = year-on-year (1H’19 vs 1H’18) variance is better/(worse) 5. Risk-adjusted revenue (income minus impairment) over
2. Digital sales as a % of total sales the past 12 months divided by the 12 month rolling
3. Days to on-board a new Corporate & Institutional Banking client average of FTE client-facing employees 22
4. Income over the past 12 months divided by the 12 month rolling average of full-time equivalent (FTE) 6. Workers contracted through a single or multiple
employees supplier(s)/ vendor(s) and not paid through payrollWe are executing multiple exciting digital
initiatives to transform our business Financial framework Strategic priorities
Retail Banking 1H YoY1
Greater China & North Asia
Mobile adoption² 19% 26% 32% +541bps • Virtual bank preparations underway in Hong Kong
• Launch of real-time FX trading via mobile
Digital adoption³ 42% 47% 52% +423bps
▪ Hong Kong transactions up 15% YoY
• Blockchain supply chain financing with Linklogis
Corporate & ASEAN & South Asia
Institutional Banking
• Real time on-boarding for credit cards and
+11% personal loans in India and Singapore
FM Digital volume4
• Launched open digital platform for SMEs in India
• First bank in Singapore to partner with soCash5
Commercial Banking
Africa & Middle East
S2B utilisation7 55% 64% 67% +277bps
• Digital-only banks now in 8 Africa markets
• Launch of SC Keyboard6 in 4 Africa markets
1H’17 1H’18 1H’19
1. 1H YoY = year-on-year (1H’19 vs 1H’18) variance is better/(worse) 5. SoCash is a mobile app that offers customers the opportunity to withdraw cash from retail outlets
2. Mobile adoption by active clients 6. SC Keyboard allows clients to transfer money, pay bills and check balances in messaging platforms
3. Mobile and online adoption by active clients 7. % of Commercial Banking clients active on the Group’s proprietary Straight2Bank (S2B) application 23
4. Financial Markets sales income originated via E-platformsOur priorities are driven by our purpose
and delivered by our people Financial framework Strategic priorities
Our purpose: Driving commerce and prosperity through our unique diversity
We understand our We will lead We will maximise We support the
responsibilities sustainable financing return from investment communities where we
across emerging in our people work and live
markets
• Emissions white paper1: how we will measure, manage and reduce the impact of our financing activities on the environment
• Launched our first emerging markets-focused EUR500m Sustainability Bond: 7x oversubscribed
• World’s first sustainable deposit for corporate and institutional clients, financing sustainable assets in emerging markets
• Mapped our sustainable activities to the UN sustainable development goals2
• Created a sustainability bond framework to increase our green, social and sustainability bond issuance programme
• Awarded ‘Best Sustainable Finance Bank in Africa’3
Selected 1H’19 actions
1. www.sc.com/en/sustainability/
2. www.un.org/sustainabledevelopment/sustainable-development-goals/
3. Euromoney 24From turnaround to transformation: 1H’2019
Good progress; on track
• We made good progress in the first half
▪ Income up 4% and profit up 13% at constant currency1
• Our focus on our clients and strategic priorities is paying off
▪ Network and affluent income grew; productivity is improving; multiple digital initiatives underway
• We are on track to achieve our financial targets
▪ Return on tangible equity – our primary performance measure - improved 88bps to 8.4%
• Sentiment in our markets is delicately balanced
▪ Geopolitical conditions remain turbulent
▪ Global growth has slowed and interest rates face downwards pressure …
▪ … but growth is still being driven disproportionately by markets in our footprint
• We are investing now to create optionality for the future
1. Income up 1% and underlying profit up 11% reported basis
2526
Appendix

           27
Appendix:
Macroeconomic outlook and interest rate sensitivity
28Macro fundamentals remain solid, but uncertainties are weighing on
sentiment
Economic uncertainty remains high Our markets continue to grow, but at a slower rate
Real GDP growth1 (%) 2018 2019e
Potential headwinds
Hong Kong 3.0 1.4
•
GCNA
Trade tensions
China 6.6 6.5
• Slowing Chinese economy
• Oil price volatility Korea 2.7 2.2
• Currency pressure across emerging markets
India 6.8 7.0
ASA
Indonesia 5.1 5.1
Singapore 3.2 1.0
Potential tailwinds
Nigeria 1.9 2.4
AME
• Major central banks turn more dovish
• Growth fundamentals remaining positive UAE 1.7 1.7
• China opening initiatives continue UK 1.4 1.2
• Opportunities from supply chain realignments EA
USA 2.9 2.3
1. Source: Standard Chartered Global Research, India’s financial year starts in April each year. The forecasts for 2019 reflect Global Research projections, and not
necessarily those of the Board
29Interest rate sensitivity to a 50bp parallel movement
Estimate of banking book NII sensitivity to instantaneous +/(-) 50bps change in interest rates across all currencies1
Annualised benefit ($m)
+50bps -50bps
210 210
Interest rate sensitivity in the banking book updated:
• Sensitivity broadly unchanged since December 2018
• 1-year impact of 50bps instantaneous increase = $210m
• Corresponding impact of 50bps decrease = $180m
• Asymmetry in +/- scenarios likely offset in operating income
• Benefit from rising interest rates due to reinvesting at higher
yields and assets re-pricing faster than deposits
(180) (180)
FY’18 HY’19 FY’18 HY’19
USD HKD, SGD & KRW OCY
1 Estimate includes significant modelling and behavioural assumptions and is subject to change 30Appendix:
1H’19 Group financial analysis
31Group financial summary
1 1 1
($m) 1H'19 1H'18 YoY % 2Q'19 1Q'19 2Q'18 QoQ % YoY %
Operating income 7,696 7,649 1 3,883 3,813 3,776 2 3
Other operating expenses (4,969) (5,117) 3 (2,554) (2,415) (2,648) (6) 4
UK bank levy - - - - - - - -
Operating profit before impairment and
2,727 2,532 8 1,329 1,398 1,128 (5) 18
taxation
Credit impairment (254) (293) 13 (176) (78) (102) nm (73)
Other impairment (21) (51) 59 (19) (2) (27) nm 30
Profit from associates 157 168 (7) 91 66 100 38 (9)
Underlying profit before taxation 2,609 2,356 11 1,225 1,384 1,099 (11) 11
Provision for regulatory matters (204) - - (18) (186) - 90 -
Restructuring and other items 9 (10) nm (35) 44 60 nm nm
Statutory profit / (loss) before taxation 2,414 2,346 3 1,172 1,242 1,159 (6) 1
Taxation (918) (753) (22)
Profit for the year 1,496 1,593 (6)
1. Variance is better / (worse)
32Operating income by product
1
($m) 1H'19 1H'18 YoY % 2Q'19 1Q'19 4Q'18 3Q'18 2Q'18
Transaction Banking 1,952 1,840 6 990 962 942 936 924
Trade 559 589 (5) 282 277 257 277 285
Cash Management 1,223 1,081 13 621 602 604 577 553
Securities Services 170 170 0 87 83 81 82 86
Financial Markets 1,496 1,401 7 747 749 580 631 677
Foreign Exchange 603 530 14 304 299 232 239 280
Rates 2 357 298 20 136 221 63 194 121
Commodities 89 104 (14) 44 45 50 38 53
Credit and Capital Markets 2 285 193 48 145 140 83 48 87
Capital Structuring Distribution Group 156 147 6 74 82 91 71 92
Other Financial Markets 6 129 (95) 44 (38) 61 41 44
Corporate Finance 651 665 (2) 330 321 434 324 334
Lending and Portfolio Management 269 278 (3) 140 129 117 123 141
Wealth Management 975 991 (2) 511 464 343 465 452
Retail Products 1,921 1,896 1 973 948 925 929 953
CCPL and other unsecured lending 625 696 (10) 320 305 294 320 345
Deposits 991 825 20 499 492 481 476 431
Mortgage and Auto 256 332 (23) 128 128 127 114 156
Other Retail Products 49 43 14 26 23 23 19 21
Treasury 559 628 (11) 251 308 253 342 338
Other (127) (50) nm (59) (68) 1 (26) (43)
Total operating income 7,696 7,649 1 3,883 3,813 3,595 3,724 3,776
1. YoY variance is better / (worse)
2. Following a reorganisation of certain product teams within Financial Markets, $46 million of income that was in H1 2018 reported within Credit and Capital Markets has
been transferred to Rates during Q3 2018. Prior periods have not been restated 33Ongoing business and liquidation portfolio
30.06.19 31.12.18
($m) Ongoing Liquidation
Total Total
business portfolio
268,055
261,837
6,218
(4,460)
(757)
(3,703)
263,595
261,080
2,515
60 / 81
1,416
4,068
57
1. Includes reverse repurchase agreements and other similar secured lending held at amortised costs of $2,704 million at 30.06.19 and $3,151 million at 31.12.18
34Appendix:
1H’19 client segment financial analysis
35Underlying performance by client segment
Corporate &
Retail Commercial Private Central &
Institutional Total
Banking Banking Banking other items
1H'19 ($m) Banking
Operating income 3,607 2,595 746 306 442 7,696
Operating expenses (2,124) (1,823) (425) (253) (344) (4,969)
Operating profit before impairment 1,483 772 321 53 98 2,727
Credit impairment (110) (154) (35) 47 (2) (254)
Other impairment (19) - - - (2) (21)
Profit from associates and joint ventures - - - - 157 157
Underlying profit before taxation 1,354 618 286 100 251 2,609
Statutory profit before taxation 1,377 617 286 99 35 2,414
1H'18 ($m)
Operating income 3,451 2,620 706 271 601 7,649
Operating expenses (2,218) (1,884) (460) (275) (280) (5,117)
Operating profit/(loss) before impairment 1,233 736 246 (4) 321 2,532
Credit impairment (81) (119) (106) (1) 14 (293)
Other impairment (59) - - - 8 (51)
Profit from associates and joint ventures - - - - 168 168
Underlying profit / (loss) before taxation 1,093 617 140 (5) 511 2,356
Statutory profit / (loss) before taxation 1,020 613 139 (11) 585 2,346
1
YoY%
Operating income 5 (1) 6 13 (26) 1
Underlying profit / (loss) before taxation 24 0 nm nm (51) 11
1. YoY variance is better / (worse)
36Corporate & Institutional Banking
Financial analysis
($m) 1H'19 HoH % 1 YoY % 1 Progress
Operating income 3,607 6 5 • Continued to deepen relationships with existing clients and new OECD-
based clients. New OECD clients income rose 24 per cent
Transaction Bank ing 1,519 4 6
• Quality of income continues to improve driven by capital-lite income up 15
Financial Mark ets 1,339 24 7 per cent and network income up 9 per cent
Corporate Finance 601 (15) (2) • Maintained balance sheet quality, with investment-grade clients
representing 56 per cent of customer loans and advances (2018: 63 per
Lending and Portfolio Mgmt 159 13 (9) cent) and high-quality operating account balances3 improving to 57 per
cent of Transaction Banking customer balances (2018: 49 per cent1)
Other (11) nm 35
• Continued to invest in our platforms to drive client experience, digitization
Operating expenses (2,124) 2 4
and automation
• Entered into strategic partnership with Linklogis, a supply chain financing
Credit impairment (110) 32 (36) focused fintech in China
Other impairment (19) 79 68 • Strong Financial Markets performance supported by global Credit
initiatives across key network corridors
Underlying profit before taxation 1,354 38 24
Performance highlights
Statutory profit before taxation 1,377 nm 35 • Underlying profit before taxation of $1,354 million was up 24 per cent,
primarily driven by higher income and lower costs
Key metrics 1H'19 HoH % 1 YoY% 1 • Income of $3,607 million was up 5 per cent4, primarily driven by Cash
Management and Financial Markets income which partially offset margin
Loans and advances to customers ($bn) 2 153 4 7 compression in Trade Finance. Good balance sheet momentum, with
loans and advances to customers up 6 per cent
Customer accounts ($bn) 240 (1) (3)
• Proportion of low-returning client risk-weighted assets (RWAs) at 15.2 per
Risk-weighted assets ($bn) 138 7 (1) cent (December 2018: 15.5 per cent)
Underlying RoTE 10.0% 273bps 239bps • RoTE improved from 7.6 per cent to 10.0 per cent
1. Variance is better / (worse) other than for loans and advances to customers, customer accounts, RWA which is increase / (decrease)
2. Loans and advances to customers including FVTPL
3. June 2019 operating account (OPAC) balance restated for new OPAC methodology
4. Excluding debit valuation adjustments and Shipping Operating Leases impact, CIB underlying income up 8 per cent 37Retail Banking
Financial analysis
Progress
($m) 1H'19 HoH % 1 YoY % 1
• Increased the share of income from Priority clients from 47 per cent in
Operating income 2,595 7 (1) 2018 to 49 per cent as a result of strong Wealth Management and Deposit
income growth and increasing client numbers
Greater China & North Asia 1,520 8 2
• Launched the Côte d’Ivoire model digital bank in four markets: Kenya,
Uganda, Tanzania, Ghana in Q1 2019 followed by another three markets
ASEAN & South Asia 707 10 (1)
in Botswana, Zambia and Zimbabwe in June
Africa & Middle East 349 (3) (14) • Successful application for HK digital bank licence in partnership with
PCCW, HKT and Ctrip Finance which will redefine customer experience of
Europe & Americas 19 - - banking services
• Launched real-time onboarding for Credit Cards and Personal Loans
Operating expenses (1,823) 2 3 (CCPL) in India and Singapore, enabling more efficient CCPL applications
with significantly improved customer experience
Credit impairment (154) (4) (29)
• A further improvement in digital adoption, with 52 per cent of clients now
Other impairment - 100 - actively using online or mobile banking compared with 47 per cent
Performance highlights
Underlying profit before taxation 618 49 0
• Underlying profit before taxation of $618 million was flat as lower
expenses were offset by lower income and higher credit impairment
Statutory profit before taxation 617 75 1
• Underlying income of $2,595 million was down 1 per cent (up 3 per cent
on a constant currency basis). Growth of 2 per cent (up 5 per cent on a
Key metrics 1H'19 HoH % 1 YoY% 1 constant currency basis) in Greater China & North Asia offset a 1 per cent
decline (up 3 per cent on a constant currency basis) in ASEAN & South
Loans and advances to customers ($bn) 2 101 (0) (0) Asia and a 14 per cent decline (down 7 per cent on a constant currency
basis) in Africa & Middle East
Customer accounts ($bn) 139 2 5
• Strong income momentum from Deposits with improved margins and
Risk-weighted assets ($bn) 43 (0) 0 balance growth at 21 per cent. Together, Wealth Management and
Deposits income, representing 65 per cent of Retail Banking income, grew
Underlying RoTE 14.6% 504bps 35bps 7 per cent
• RoTE improved to 14.6 per cent from 14.3 per cent
1. Variance is better / (worse) other than for loans and advances to customers, customer accounts, RWA which is increase / (decrease)
2. Loans and advances to customers including FVTPL
38Retail Banking
Regional performance
Greater China & ASEAN & Africa & Europe &
Total
North Asia South Asia Middle East Americas
($m) 1H'19 1H'18 YoY %1 1H'19 1H'18 YoY %1 1H'19 1H'18 YoY %1 1H'19 1H'18 YoY %1 1H'19 1H'18 YoY %1
Operating income 1,520 1,485 2 707 712 (1) 349 404 (14) 19 19 - 2,595 2,620 (1)
Operating expenses (979) (972) (1) (531) (559) 5 (301) (338) 11 (12) (15) 20 (1,823) (1,884) 3
Credit impairment (65) (31) nm (63) (65) 3 (26) (23) (13) - - - (154) (119) (29)
Other impairment - - - - - - - - - - - - - - -
Underlying profit before taxation 476 482 (1) 113 88 28 22 43 (49) 7 4 75 618 617 0
Statutory profit before taxation 476 481 (1) 112 85 32 22 43 (49) 7 4 75 617 613 1
($bn) 1H'19 1H'18 YoY %1 1H'19 1H'18 YoY %1 1H'19 1H'18 YoY %1 1H'19 1H'18 YoY %1 1H'19 1H'18 YoY %1
Loans and advances to customers 2 67 67 0 28 28 (0) 5 6 (10) 1 1 (1) 101 102 (0)
Customer accounts 96 91 5 34 31 9 8 9 (6) 1 1 (6) 139 132 5
1. Variance is better / (worse) other than for loans and advances to customers, customer accounts, RWA which is increase / (decrease)
2. Loans and advances to customers including FVTPL
39Commercial Banking
Financial analysis
($m) 1H'19 HoH % 1 YoY % 1 Progress
• Onboarded 3,100 new clients in H1 2019 while monetising 6,400 new
Operating income 746 9 6 clients onboarded in 2018. These clients generated around $78 million
of income and $3 billion in cash liabilities
Greater China & North Asia 301 4 2
• Continued to reshape the income mix towards capital-lite products:
ASEAN & South Asia 278 7 6 share of Cash and FX income increased from 42 per cent of total
income in H1 2018 to 45 per cent
Africa & Middle East 167 23 13 • Network income grew 12 per cent, notably from Chinese and Indian
clients, as we continue to support Commercial Banking clients and
Operating expenses (425) 8 8 capture international opportunities
• Strengthened foundations in Credit Risk management and improved
Credit impairment (35) 75 67 asset quality: RWAs efficiency3 improved to 74 per cent (H1 2018: 79
per cent) and credit impairments are down 67 per cent, primarily from
Other impairment - - - lower Stage 3
• Continued to improve client experience: reduced client turnaround time
Underlying profit before taxation 286 nm 104
from nine days to five days
Statutory profit before taxation 286 nm nm • Leveraging partnerships to accelerate client acquisition: partnered with
a digital-blockchain supply chain platform in China
1 1 Performance highlights
Key metrics 1H'19 HoH % YoY%
• Underlying profit before taxation of $286 million was up 104 per cent
Loans and advances to customers ($bn) 2 28 4 (1) driven by lower impairments, income growth and lower costs
• Underlying income of $746 million was up 6 per cent mainly driven by
Customer accounts ($bn) 32 (9) (3) growth from Cash Management and Financial Markets. Income was up
2 per cent in Greater China & North Asia, up 6 per cent in ASEAN &
Risk-weighted assets ($bn) 32 4 (5) South Asia and up 12 per cent in Africa & Middle East
Underlying RoTE 9.1% 646bps 478bps • RoTE improved from 4.3 per cent to 9.1 per cent
1. Variance is better / (worse) other than for loans and advances to customers, customer accounts, RWA which is increase / (decrease)
2. Loans and advances to customers including FVTPL
3. RWA efficiency calculated based on Credit RWA divided by Assets and Contingents 40Commercial Banking
Regional performance
Greater China & ASEAN & Africa &
Total
North Asia South Asia Middle East
($m) 1H'19 1H'18 YoY % 1 1H'19 1H'18 YoY % 1 1H'19 1H'18 YoY % 1 1H'19 1H'18 YoY % 1
Operating income 301 295 2 278 263 6 167 148 13 746 706 6
Operating expenses (177) (198) 11 (143) (160) 11 (105) (102) (3) (425) (460) 8
Credit impairment (9) (17) 47 (13) (25) 48 (13) (64) 80 (35) (106) 67
Other impairment - - - - - - - - - - - -
Underlying profit / (loss) before taxation 115 80 44 122 78 56 49 (18) nm 286 140 nm
Statutory profit / (loss) before taxation 115 79 46 122 78 56 49 (18) nm 286 139 nm
($bn) 1H'19 1H'18 YoY % 1 1H'19 1H'18 YoY % 1 1H'19 1H'18 YoY % 1 1H'19 1H'18 YoY % 1
Loans and advances to customers 2 14 15 (4) 9 9 (0) 5 5 6 28 29 (1)
Customer accounts 19 20 (7) 10 9 4 3 3 8 32 33 (3)
1. Variance is better / (worse) other than for loans and advances to customers, customer accounts, RWA which is increase / (decrease)
2. Loans and advances to customers including FVTPL
41Private Banking
Financial analysis
Progress
($m) 1H'19 HoH % 1 YoY % 1
• Drove sharper client segmentation to deliver our distinct advisory and
Operating income 306 25 13 product proposition, and grow profitability
Corporate Finance 2 - - • Deepened client engagement through stronger Relationship Management,
Product Specialist coverage model and sales discipline
Wealth Management 195 44 15 • Stepped up brand visibility of our key differentiators with the launch of a
Private Banking marketing campaign around uncovering biases for making
Retail Products 109 (1) 8 better financial decisions, underscoring our unbiased and open architecture
Advisory proposition
Operating expenses (253) 1 8
• Continued to tap into wealth opportunities in Greater China and South Asia
Credit impairment 47 nm nm • Continued to further enhance our open architecture derivatives platforms
through full automation and straight-through-processing of the transactions
Other impairment - - - • Continued investments in building a senior team of frontline relationship
managers across our markets
Underlying (loss) before taxation 100 nm nm
Performance highlights
Statutory (loss) before taxation 99 nm nm • Underlying profit of $100 million includes a $48 million credit impairment
release, improving from a loss of $6 million in the prior period driven by top-
line income growth and costs reduction
1 1
Key metrics 1H'19 HoH % YoY%
• Underlying income of $306 million was up 13 per cent, making a second
Loans and advances to customers ($bn) 2 16 14 14 consecutive year of top-line growth. Income increase mainly driven by
higher Wealth products income (up 15 per cent) and improved product
Customer accounts ($bn) 18 (6) (7) margins
• Assets under management increased $6 billion or 10 per cent from 31
Risk-weighted assets ($bn) 7 13 6 December 2018, mainly driven by $1.7 billion of net new money and positive
market movements
Underlying RoTE 15.7% 1694bps 1660bps
• RoTE increased from negative 1.0 per cent to 15.7 per cent
1. Variance is better / (worse) other than for loans and advances to customers, customer accounts, RWA which is increase / (decrease)
2. Loans and advances to customers including FVTPL
42Appendix:
1H’19 region financial analysis
43Underlying performance by region
Greater
ASEAN & Africa & Europe & Central &
1H'19 ($m) China Total
South Asia Middle East Americas other items
& North Asia
Operating income 3,080 2,136 1,340 794 346 7,696
Operating expenses (1,826) (1,292) (850) (715) (286) (4,969)
Operating profit before impairment 1,254 844 490 79 60 2,727
Credit impairment (70) (84) (49) (66) 15 (254)
Other impairment (8) - - - (13) (21)
Profit from associates and joint ventures 153 - - - 4 157
Underlying profit before taxation 1,329 760 441 13 66 2,609
Statutory profit / (loss) before taxation 1,326 767 439 (2) (116) 2,414
1H'18 ($m)
Operating income 3,097 2,073 1,376 870 233 7,649
Operating expenses (1,903) (1,360) (919) (736) (199) (5,117)
Operating profit before impairment 1,194 713 457 134 34 2,532
Credit impairment (17) (138) (70) (68) - (293)
Other impairment (44) 7 - 17 (31) (51)
Profit / (loss) from associates and joint ventures 156 7 - 3 2 168
Underlying profit before taxation 1,289 589 387 86 5 2,356
Statutory profit / (loss) before taxation 1,263 677 346 84 (24) 2,346
YoY% 1
Operating income (1) 3 (3) (9) 48 1
Underlying profit before taxation 3 29 14 (85) nm 11
1. YoY variance is better / (worse)
44Greater China & North Asia
Financial analysis
($m) 1H'19 HoH % 1 YoY % 1 Progress
• Actively participated in the opening of China’s capital markets, helping
Operating income 3,080 1 (1)
overseas investors do business through channels such as Bond
Connect, Stock Connect and the Qualified Domestic Institutional Investor
Hong Kong 1,854 (3) 0 initiative
Korea 505 6 (5) • Continuing good progress in Retail Banking in Hong Kong. We attracted
around 32,500 new Priority clients during the year and increased our
China 445 12 5
active qualified Priority clients by 11 per cent
• We were granted a virtual banking licence from the Hong Kong Monetary
Other 276 (2) (5) Authority on 27 March 2019: one of the first to receive a licence under
Hong Kong’s new virtual banking scheme teamed up with PCCW, HKT
Operating expenses (1,826) 4 4 and Ctrip Finance
• Continued to transform the Korea franchise to improve returns and focus
Credit impairment (70) (30) nm on China’s opening. China generates more network income for the
Group than nearly every other market
Other impairment (8) 88 82
Performance highlights
Profit from associates 153 nm (2) • Underlying profit before taxation of $1,329 million was up 3 per cent, with
lower expense partly offset by higher credit impairment
Underlying Profit before taxation 1,329 23 3
• Underlying income of $3,080 million was broadly flat, with broad-based
growth across the markets and segments, particularly in Hong Kong and
Statutory profit before taxation 1,326 33 5 China, offset by weak Treasury income performance. Retail Banking
income grew 2 per cent, driven by Deposits with improving margins and
strong balance sheet growth partly offset by a subdued performance in
Key metrics 1H'19 HoH % 1 YoY% 1 Wealth Management. Private Banking performed well with income up 26
Loans and advances to customers ($bn) 2 134 3 1 per cent, driven by Wealth Management. Corporate & Institutional
Banking and Commercial Banking income grew 4 per cent and 2 per
cent respectively driven by strong Cash Management and Financial
Customer accounts ($bn) 197 0 4
Markets
Risk-weighted assets ($bn) 85 5 2 • Balance sheet momentum was sustained with loans and advances to
customers up 1 per cent while customer accounts remained up 4 per
cent
1. Variance is better / (worse) other than for loans and advances to customers, customer accounts, RWA which is increase / (decrease) 45
2. Loans and advances to customers including FVTPLASEAN & South Asia
Financial analysis
Progress
($m) 1H'19 HoH % 1 YoY % 1 • Operating profit grew in all client segments and in nine out of 12
Operating income 2,136 13 3 markets
• Double-digit growth in high-returning businesses such as Priority
Singapore 870 24 3 Banking and Global Subsidiaries, and capital-lite income contributing
to 60 per cent of overall income
India 502 7 4 • Attracting more than 8,000 new Priority Banking clients and 1,000 new
Commercial Banking clients
Other 764 5 2
• Sharpened our value propositions with Priority Private for affluent
clients in Singapore and Malaysia, and launched the ASEAN
Operating expenses (1,292) 4 5
proposition for Commercial Banking
Credit impairment (84) 54 39 • Launch of instant onboarding for credit cards and savings accounts in
Singapore and India helped accelerate digital adoption and improved
Other impairment - 100 (100) client advocacy
• In aggregate, India and Indonesia experienced double-digit growth in
Profit from associates - (100) (100) operating profit; India’s cost-to-income ratio improved from 71 to 65
per cent
Underlying profit before taxation 760 99 29 Performance highlights
Statutory profit before taxation 767 93 13 • Underlying profit before taxation grew by 29 per cent to $760 million,
underpinned by 3 per cent income growth and 39 per cent lower credit
impairments from improved credit quality
1 1
Key metrics 1H'19 HoH % YoY% • Underlying income of $2,136 million is 3 per cent higher, with double-
digit income growth in Corporate & Institutional Banking, Commercial
Loans and advances to customers ($bn) 2 83 1 1 Banking and Private Banking offsetting a marginal income decline in
Retail Banking
Customer accounts ($bn) 102 5 7
• RWAs declined by 2 per cent while customer loans and advances
were up 1 per cent, reflecting improved credit quality. Customer
Risk-weighted assets ($bn) 94 7 (2)
accounts were up 7 per cent with retail current and savings accounts
and cash liabilities growing 6 per cent
1. Variance is better / (worse) other than for loans and advances to customers, customer accounts, RWA which is increase / (decrease)
2. Loans and advances to customers including FVTPL
46Africa & Middle East
Financial analysis
Progress
($m) 1H'19 HoH % 1 YoY % 1
• A number of marquee Corporate & Institutional Banking transactions
Operating income 1,340 9 (3) across the region with sovereign clients in particular are reflective of the
strong client franchise
UAE 327 17 (8)
• Network income was 13 per cent higher and the Group’s Global
Subsidiaries business grew by 10 per cent
Other 1,013 7 (1)
• After a successful launch of a digital-only bank in Côte d’lvoire in the first
Operating expenses (850) 5 8
half of 2018, roll-out was extended to seven additional markets (Uganda,
Tanzania, Ghana, Kenya, Zimbabwe, Botswana and Zambia)
Credit impairment (49) 74 30 • Despite continued geopolitical and macroeconomic headwinds, improved
asset quality and good risk discipline led to lower credit impairments
Other impairment - - - • Cost efficiencies have allowed investments to continue through the cycle
Profit from associates - - -
Performance highlights
• Underlying profit before taxation of $441 million was 14 per cent higher
Underlying profit before taxation 441 nm 14 with lower expenses and improved credit impairment offset by a
decrease in income
Statutory profit before taxation 439 nm 27 • Underlying income of $1,340 million up 3 per cent on a constant currency
basis, down 3 per cent on reported basis, with good performance in our
Corporate & Institutional Banking and Commercial Banking Business
Key metrics 1H'19 HoH % 1 YoY% 1 across the region. On a constant currency basis, Africa was up 9 per cent
and the Middle East and Pakistan were 1 per cent down.
Loans and advances to customers ($bn) 2 30 1 (3)
• Strong performances in Financial Markets and Corporate Finance were
Customer accounts ($bn) 30 (1) (6) offset by margin compression in Retail Banking and lower Wealth
Management in UAE and Botswana
Risk-weighted assets ($bn) 52 (3) (4) • Since December 2018, loans and advances to customers were up 1 per
cent and customer accounts were down 1 per cent
1. Variance is better / (worse) other than for loans and advances to customers, customer accounts, RWA which is increase / (decrease)
2. Loans and advances to customers including FVTPL
47Europe & Americas
Financial analysis
Progress
($m) 1H'19 HoH % 1 YoY % 1
• Good progress in improving the share of business from targeted
Operating income 794 (1) (9)
multinational corporate clients, with income up 25 per cent and 9 per cent
from ‘New’ OECD and ‘Next’ client initiatives respectively
UK 330 (13) (25)
• Continued growth in our key Greater China corridor providing high
US 365 9 10 network returns from Europe & Americas clients
• The Group is well prepared for Brexit with Standard Chartered Bank AG
Other 99 13 3
(Germany) operational and providing a strong base to grow our
continental Europe franchise
Operating expenses (715) 0 3
• Launched sustainable finance business and issued inaugural sustainable
Credit impairment (66) nm 3 bond focused on emerging markets
Performance highlights
Other impairment - - (100)
• Underlying profit before taxation of $13 million, down 85 per cent primarily
Profit from associates - - (100) due to lower operating income, partially offset by reduced costs
• Underlying income of $794 million was down 9 per cent due to an adverse
Underlying profit before taxation 13 (81) (85)
swing in the debit valuation adjustment (DVA) in Financial Markets,
Statutory profit/(loss) before taxation (2) nm nm
resulting from an improvement in the Group’s own credit risk, and lower
Treasury income. This offset strong performance in Transaction Banking
and Financial Markets
1 1
Key metrics 1H'19 HoH % YoY% • Income generated by Europe & Americas clients, but booked elsewhere in
Loans and advances to customers ($bn) 2
59 4 16
our network, increased by 4 per cent
• Improvement in credit quality of assets combined with good income
Customer accounts ($bn) 117 3 (1) growth resulted in an increase in the returns originated from Europe &
Americas clients
Risk-weighted assets ($bn) 43 5 4
1. Variance is better / (worse) other than for loans and advances to customers, customer accounts, RWA which is increase / (decrease)
2. Loans and advances to customers including FVTPL
48Performance by key markets
Operating income Underlying profit / (loss) before taxation
1 1
($m) 1H'19 1H'18 YoY % 1H'19 1H'18 YoY %
Hong Kong 1,854 1,849 0 872 828 5
Korea 505 534 (5) 122 132 (8)
China 445 422 5 232 236 (2)
Singapore 871 845 3 380 267 42
India 502 482 4 133 107 24
UAE 327 357 (8) 91 68 34
UK 330 441 (25) (27) 90 nm
US 365 333 10 19 (17) nm
1. YoY variance is better / (worse)
49Appendix:
Fixed income information
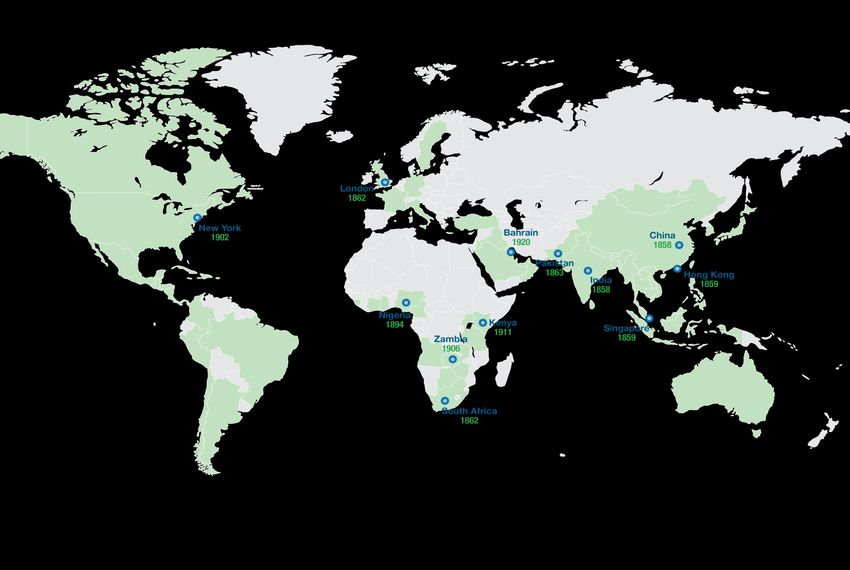
50Standard Chartered overview
Over 160 years in some of the world's most dynamic markets 1H’19 Performance highlights
60 >80% 4 $7.7bn $2.6bn
(1H’18: $7.6bn) (1H’18: $2.4bn)
markets income from Asia, 4 client segments & Operating income Profit before taxation
Africa & 4 regions
Middle East 13.5% 8.4%
(1H’18: 14.2%) (1H’18: 7.5%)
Common equity tier 1 ratio Return on tangible equity
Group income by region and segment Group income by product
Trade Cash Mgmt & Custody
5% Financial Markets Corporate Finance
7% 7%
10% 6% 3% Lending Wealth Management
4% CCPL Deposits
13% 18%
9% GCNA CIB Mortgage Treasury
40% ASA RB $7.7bn
17% 11%
$7.7bn 8%
47% AME CB
Financial FX
EA PB 19% Markets 19% 40%
13% Rates
34% $1.5bn
C&OI C&OI 4% 8% Commodities
6% Credit & Cap Mkt
CSDG
28% 24%
Other FM
51Balance sheet diversity
1H’19 Balance sheet assets 1H’19 Customer loans & advances by country and segment
Hong Kong CIB
9% 18% Korea RB
Loans & advances to customers 5%3% 24%
11% China CB
Investment securities 9%
5% Singapore PB
43% Cash & balances at central banks
7% $307bn India
$713bn 50% C&OI
Derivatives
14% 33% 10% UAE
8%
Loans & advances to banks
UK
Other assets 4% 5%
US
22% 5%
15% Other
1H’19 Balance sheet liabilities 1H’19 Customer accounts by country and segment
Customer accounts Hong Kong CIB
8% 15%
2% Korea RB
6% Other debt securities in issue 4%4% 27%
7% China CB
Senior debt 6%
8% Singapore PB
$662bn Derivatives $445bn India C&OI
5% 54%
31% UAE
4% 67% Deposits by banks 19% 8%
UK
Subordinated liabilities 5%
US
& other borrowed funds 2%
Other liabilities 4% 14% Other
1. Loans & advances to customers includes FVTPL
52Liquid and resilient balance sheet
Total customer deposits ($bn) 1 Liquidity Coverage Ratio ($bn)
388 398 408 154%
151%
139%
171 175 189
148 150 155
218 223 219 98 97 111
1H'18 FY'18 1H'19 1H'18 FY'18 1H'19
HQLA Net outflows Liquidity Coverage Ratio
CASA Time deposits & other
Advances to deposits ratio ($bn) 1 1H’19 LCR eligible assets by region and type
65% 63% 64%
Greater China & Level 1
North Asia
8% 2%
ASEAN & South Level 2A
35% Asia
388 398 408 Level 2B
48% $155bn Africa & Middle East
252 251 260
Europe & Americas
90%
1H'18 FY'18 1H'19
15%
Loans and advances to customers Customer accounts 2%
Advances-to-deposits ratio
1. Excludes repurchase agreements and other similar secured borrowing
53Customer Loan Portfolio: diverse & higher quality
Diverse loan book by industry Key indicators 2
1H’19 FY’18 19-18 FY’14 19-14
Customer loans and advances (gross) Stage 3 / NPL
(IFRS 9) (IFRS 9) Mvt. (IAS 39) Mvt.
2% 1%
IG % corp. 3 57% 62% 42%
7% 4%
8% 6% 13%
7% 9% Tenor profile % (Funding
Currency mix ($bn) 1, 3 2019 SC PLC issuance of ~$3.9bn across 4 currencies 3
USD
USD EUR GBP Other USD 2bn Senior – Dual tranche benchmark dollar
Total
• 6NC5 and 11NC10
Senior 12.4 3.4 0.8 3.3 19.9 • First >10Y senior from SC PLC since 2016
Tier 2 8.7 3.3 0.9 0.5 13.4
USD 100m Senior – Formosa zero coupon
AT1 6.5 0.0 0.3 0.6 7.4 • 30NC5+5 at IRR 4.90%
• Inaugural SC PLC zero coupon issuance
Total 27.5 6.7 2.0 4.4 40.6
AUD 1bn Senior – Dual tranche Kangaroo
• 6NC5 split between fixed and float
Maturity profile ($bn) 2
• Inaugural SC PLC AUD issuance
EUR 500m Senior – EM focused sustainability bond
2.9 • 8NC7 Sustainability Bond – 1st emerging markets focused
2.0
2.2 • Use of proceeds aligned to UN SDGs 4
2.1 2.0
2.8 2.0
2.8 2.0 2.0 SGD 750m AT1 – Inaugural SGD AT1
0.5 1.0
• PNC5.25 at a coupon of 5.375%
2H'19 2020 2021 2022 2023 • Diversified market access in a key market for the Group
AT1 Tier 2 PLC Senior
1. SC PLC only
2. SC PLC & SCB: modelled on earlier of call date or maturity date
3. Priced prior to 30 June 2019 55
4. United Nations Sustainable Development GoalsYou can also read