The French passenger rail transport market - Observatory of transport and mobility - Arafer
←
→
Page content transcription
If your browser does not render page correctly, please read the page content below
autorité de régulation des activités
ferroviaires et routières

       Observatory of transport and mobility
                                       The French passenger
                                        rail transport market
                                                    2015-2016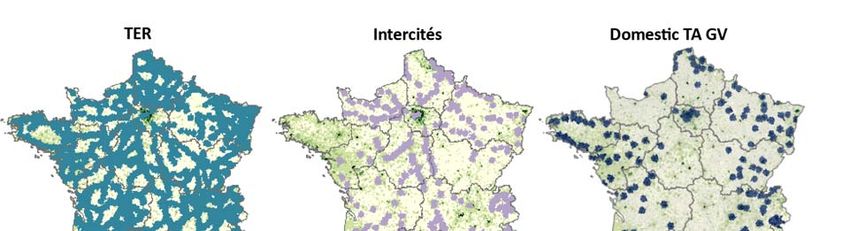
Contents

OVERVIEW .......................................................................................................................................................4

INTRODUCTION ...............................................................................................................................................8

1. CHARACTERISTICS AND DEGREE OF USE OF THE NATIONAL RAIL NETWORK (RFN) ............................ 10

   1.1. 2nd European railway, mostly used for passenger transport, with significant geographical
   disparities in its intensity of use ................................................................................................................. 10

   1.2. The RFN has 2,996 railway stations and train stops, located in 2,634 municipalities .................. 11

2. COMPARATIVE CHANGES IN PASSENGER RAIL TRANSPORT ................................................................. 12

   2.1. With a modal share of 9.2% in 2016, down since 2011, rail transport has not been benefitting
   from the development of mobility observed in France ............................................................................. 12

   2.2. Between 2010 and 2015, the European passenger transport market was more dynamic than in
   France .......................................................................................................................................................... 13

3. OVERVIEW OF THE MARKET IN 2015/2016.......................................................................................... 14

   3.1. 1.4 billion passengers transported by train in 2016, with 88% in TER and Transilien ................... 15

   3.2. The commercial supply realised in 2016 contracted much more than the demand ...................... 16

   3.3. The average occupancy rates were between 25% for TER and 67% for TGV .................................. 17

   3.4. More than 26,500 domestic rail routes (excluding Transilien) are offered in 2016, with 2,300 by
   several parallel rail services ....................................................................................................................... 18

4. QUALITY OF SERVICE OF PASSENGER RAIL TRANSPORT ....................................................................... 20

   4.1. In 2016, 5% of scheduled trains were cancelled and 11% of circulating trains arrived with a delay
   of more than 6 minutes at their terminal station ...................................................................................... 21

   4.2. Descheduling focuses on a few days during which the initially planned TER and Intercités supply
   was reduced by more than 40% (-24% for TGV) ........................................................................................ 22

   4.3. The rates of delay increase in peak periods, and are higher for long-distance services ................ 23

   4.4. 55% of the minutes lost by passenger trains are linked to so-called “manageable” causes by
   SNCF Réseau and the railway companies ................................................................................................. 25

5. FINANCIAL RESULTS OF THE RAILWAY SECTOR ..................................................................................... 26

   5.1. Passenger rail companies earned €13.4 billion of income in 2015: €8.3 billion of commercial
   income and €5.1 billion from public subsidies ......................................................................................... 26

   5.2. Commercial income per passenger-km decreased by 5.7% in 2016, and amounted to
   8.4 eurocents on average (all services included) ..................................................................................... 28

   5.3. The income per train-km increases for TGV but declines for public service obligations................. 29

                                                                                                                                                                          2 / 45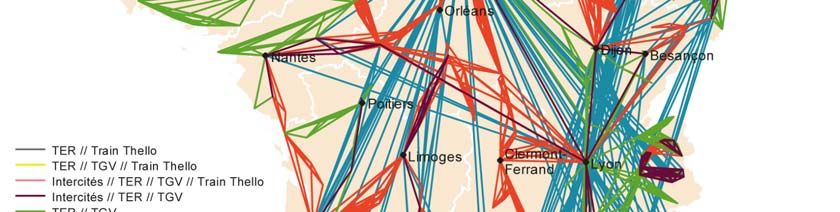
5.4. Fees paid by the railway undertakings represent on average 31% of their income in 2015, 38%
    for the domestic TAGV activity .................................................................................................................... 30

6. FOCUS ON THE REGIONAL PUBLIC SERVICE OBLIGATIONS (TER ANDTRANSILIEN) ............................. 32

    6.1. Characteristics of the regional rail networks: nearly 10% of the RFN is located in the Rhône-Alpes
    Region, but compared to the regional area the rail network is the densest is in Île-de-France and Nord-
    Pas-de-Calais ............................................................................................................................................... 32

    6.2. Intensity of use of the network and railway mobility per inhabitant: Île-de-France stands out
    greatly in terms of intensity of supply and demand, followed by Alsace; Picardie also has a relatively
    high demand intensity linked to its geographical position bordering Île-de-France................................ 33

    6.3. With more than 103 billion seats-km offered in 2016 (including 50% in Île-de-France), the most
    abundant supply of seats in relation to the population is in Île-de-France, as well as Bourgogne and in
    Picardie ........................................................................................................................................................ 33

    6.4. The demand of regional services is increasing in Île-de-France, Alsace, Picardie and in Bretagne.
    ...................................................................................................................................................................... 37

    6.5. The average occupancy rate of the regional services is stable for TER and increases in Île-de-
    France , but it remains lower than or equal to 30% in all Regions .......................................................... 37

    6.6. Financial results of regional services ................................................................................................. 38

             6.6.1. In 2016, public subsidies accounted for 73% of income from regional public service
             obligations (69% in 2015); the share of public competitions in Transilien's income increased by 8
             percentage points over one year (+1 point for the TERs) ................................................................. 38

             6.6.2. The decline in commercial income from the TER services (-5.2%) is due both to the drop in
             the number of travelers and to the decrease in the commercial income received per passenger-
             km, with notably an erosion from non-subscriber travelers .............................................................. 39

             6.6.3. In 2016, for every kilometer traveled per passenger on a regional public service obligation,
             the user pays an average of 6.5 euro cents, and the transport authority pays the supplementary
             amount (to the railway undertaking) of 17.7 euro cents .................................................................. 42

             6.6.4. Track access charges represent an average of 26% of income for regional public service
             obligations, down 0.5 points year-to-year; this weight varies from 20% to 32% depending on the
             Regions ................................................................................................................................................. 42

             6.6.5. Operating expenses amounted to 4 million euros, down 0.5% compared to 2015............. 43

             6.6.6. More than 40,000 employees of SNCF Mobilités operate the regional public service
             obligation (TER and Transilien), with an average ratio of about 18 agents per 100,000 trains-km
             produced in 2015 ................................................................................................................................ 44

First page photo credits:

SNCF Media Library (Intercités), Thalys (Thalys) photo collection, Thello (Thello) photo collection, Christophe Recoura (TER), Alain Montaufier-Lisea (TGV Tours-Bordeaux) et Eurotunnel

(Eurostar)

                                                                                                                                                                                           3 / 45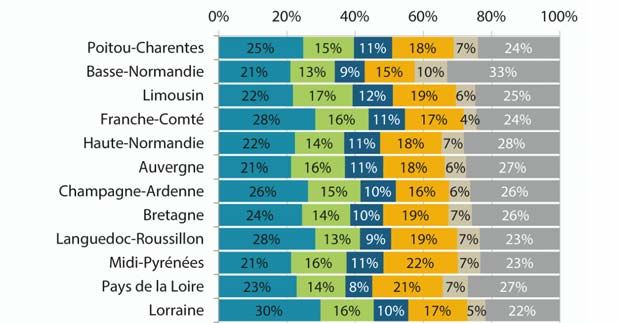
OVERVIEW
The first detailed market report of Passenger Rail Transport in France

ARAFER publishes the first annual market report of Passenger Rail Transport in France. It is based on
data collected from railway companies and infrastructure managers. The results and contents presented
below are therefore largely unpublished and provide a detailed overview, from the point of view of supply
(including quality of service) and demand, as well as financial results for railway undertakings.

This work complements statistics published by other French and European bodies1. This base of
essential information will be updated regularly, and intermodal analyses will also complete the
observation plan of the passenger rail transport sector in France.

An extensive national rail network, mainly operated for passenger traffic, with major disparities in the
intensity of use

With 28,800 kilometres of railway lines operated2 in 2015 and nearly 3,000 stopping points (railway
stations and train stops), France has the second-largest railway network in Europe, after Germany.

The French rail network (RFN3), with an average age4 of 31 years, is 55% electrified and has
2,030 kilometres of high-speed lines5, making it Europe's second largest high speed network after
Spain.

In 2016, total traffic on the RFN was 473 million trains-km, 85% of which were passenger trains. The rail
network’s intensity of use is characterized by large disparities, since 80% of passenger train movements
is concentrated on 27% of the rail network, while 31% of the network condenses only 1% of the
passenger train movements.

The modal share of rail in passenger transport has declined since 2011 in France, while it has been
growing in other European countries

For fifteen years, the development of the TAGV6 and TER7 enabled the rail mode to reach a modal share
of 10% in 2011, coming from a low point in 1995 (7.1%). During this period, the annual growth rate of
rail traffic was regularly higher than that of other modes.8

Nevertheless, this trend has been reversed since 20119, with passenger rail service (measured in
passenger-km) declining, while other modes continue to grow. At the European level, if France has a
modal share of the railways10 higher than that observed in most of its close European neighbours
(+1 point with the United Kingdom, +2 points with Germany, +3 points with Spain, +4 points with Italy),
this has decreased since 2011, whereas, on the contrary, it is in growth in these countries11 over the
same period.

1 Such as the Statistical Data and Surveys Service (SDES), the Quality of Service Authority in Transport (AQST), Eurostat, etc.
2 Excluding Rail network of Corsica, port networks and isolated rail lines.
3 The French rail network is called “Réseau Ferré National” (-RFN).
4 See definition and formula for calculating the average age of the network in Appendix 1.1.
5At the end of 2017, the RFN will have nearly 2,800 km of high-speed lines, particularly with the commissioning of the Sud-Europe-

Atlantic and Bretagne-Pays-de-la-Loire high-speed lines.
6 Train à grande vitesse (TAGV) = High-Speed Trains.
7 Train Express Régional (TER) = regional public service obligation by train.
8 Air transport, coaches & buses, and private vehicles.
9 In 2016, the modal share of the railways is 9.2% in France (source SDES - Transport accounts 2016).
10 Modal share of rail in land transport - 2015 data, Eurostat source.
11 +0.4 p.p. of railway modal share between 2011 and 2015 for EU-28, +0.2 p.p. for Germany, +0.5 p.p. for Italy, +0.8 p.p. in the

United Kingdom, +1.1 p.p. in Spain.

                                                                                                                                     4 / 45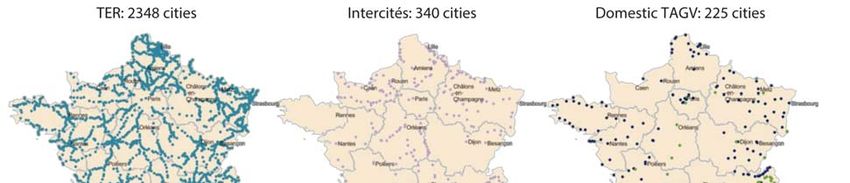
Nearly 1.4 billion passengers transported in 2016, of which 87.7% by “daily trains” (TER and
Transilien12)

In 2016, approximately 3.8 million passengers were transported daily by 11,000 trains, with 6.6 million
seats. The “daily trains” (regional public transport service obligations, TERs and Transilien) alone
account for about 90% of the supply13 and 87.7% of demand14, with 70% for Transilien. Comparing
passenger traffic to actual supply in 2016, rail services achieved an average occupancy rate of 43%, an
increase of 0.8 point over one year, but with significant disparities between services: by 25% in average
for TERs up to 67% for domestic TAGVs.

Demand measured in passengers- km and performed mainly by the TAGV, down 1% in 2016 while
demand on other modes of transport is growing by 2.7%.

With nearly 87 billion passengers-km in 2016, including 53% transported by domestic TAGV, passenger
rail service on the RFN is down 1% year-to-year.

This drop in passenger traffic reflects a relative loss of attractiveness of the rail mode, while other
modes of transport show growth over the same period. In 2016, according to transport accounts
(Statistical Data and Survey Service - SDES15), domestic passenger traffic by private vehicles (including
carpooling), inter-city coaches and by air increased by 2,7%, 17%16 and 3.8% over one year.

The occupancy of international and Intercités17 trains has particularly suffered (respectively -7.8% and -
6.5%); TER suffered a more moderate loss (-2.8%). The domestic TAGV activity remained stable (+0.1%)
and only the Transilien activity benefited from a rise in passenger traffic (+3.8%).

This overall decrease in demand is however less than that of the commercial supply (in passengers
trains-km) which circulated over the same period (-4.2%), which, for the most part, is due to the
cancellation of services related to social movements in the 2nd quarter of 2016.

Train deletions 18(“last minute” cancellations”19 but also descheduling20 previously not taken into
account) have reduced the initially planned supply by 5% in 2016; 55% of the minutes lost by
passenger trains come from “manageable”21 causes either by the infrastructure manager or by the
railway undertaking

The use of the RFN (measured in trains-km of passengers and freight) decreased by 5.8% compared to
2015, mainly because of the social movements of the 2nd quarter 2016 which led to the descheduling
of passenger trains, also penalizing the movements of freight trains.

In 2016, of the 6,968 passenger trains (excluding Transilien) initially scheduled daily, 229 trains were
descheduled (representing a 3.3% descheduling rate) and 115 trains were cancelled “at the last
minute” (representing a 1.7% cancellation rate). Thus, in total, the deletion rate of rail passenger
services (descheduling and cancellations) amounts to 5%, or 344 trains per day in 2016.

12 Transilien = Regional PSO by train around Paris (Île-de-France Region).
13 In number of train movements and number of seats offered.
14 In number of passengers transported.
15Formerly SOeS.
16The increase is mainly due to the development of liberalised intercity coach transport.
17 Intercités refers to long-distance public service obligations.
18 Excluding Transilien: the quality of service information of the Transilien activity could not be fully reliable at this stage.
19 The train could not run (on all or part of its planned route) as it was planned in the transport plan halted the day before its running day

at 4 pm.
20 Cancellation of train “anticipated”, that is to say, intervened before setting the definitive transport plan halted the day before the

planned running day at 4 pm.
21 See definition in Section 4.4 and Appendix 4.5.

                                                                                                                                                 5 / 45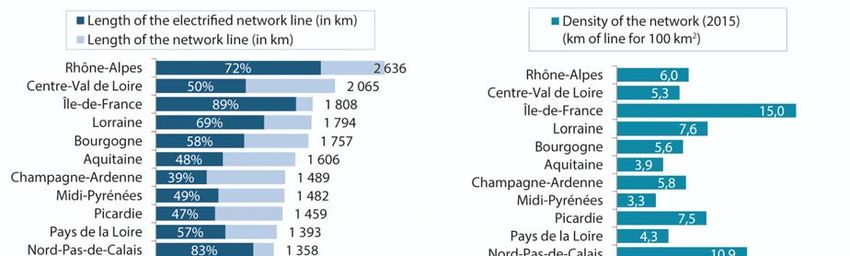
Furthermore, an average of 11% of passenger trains (excluding Transilien) having run arrived late at
least 6 minutes22 to their terminals in 2016, keeping in mind that the rate of delay is accentuated in
“peak periods”.

In total, 115,000 trains were deleted in 2016 (excluding Transilien). Of these deletions, 27% (i.e. 31,000
trains) are “last minute” cancellations and 73% are descheduled (i.e. 84,000 trains), which resulted in
an “adaptation of the transport plan”, excluding these deschedulings from the official rail reliability
statistics published up to now.

In addition, 78% of the total annual descheduling took place in the second quarter of 2016, during
social movements related to the renegotiation of the social framework for railway employees. 94% of the
deschedulings that occurred during the second quarter of 2016 concerned TER and Intercités services,
for which the daily supply was reduced by more than 40% during these days of disruption.

The “last minute” cancellations are directly related to unforeseeable operational malfunctions and
hazards. Their rate does not particularly increase during periods of social movements, but it is however
higher for TER services (1.9% of the initially planned supply) than for other services (0.6%).

Finally, according to the Performance Improvement System Committee (COSAP)23, approximately
11.2 million minutes were lost altogether by passenger trains on the RFN in 2015 (2.7 minutes on
average for each train traveling 100 km). 55% of the total volume of minutes lost is induced by
disturbances whose causes are known as “manageable”19, either by the infrastructure manager (23%)
or by the railway undertaking in charge of operations (32%).

Railway undertakings income was €13.4 billion in 2015 and 31% of this amount has been used to pay
network access charges (fees collected by SNCF Réseau and SNCF Gares & Connexions24)

In 2015, the total income of railway undertakings for all passenger rail services on the RFN amounted to
€13.4 billion excluding taxes. Commercial income (income from ticketing, subsriptions, etc.) represented
€8.3 billion income (62%) and public subsidies represented €5.1 billion (38%).

In 2015, public subsidies accounted for around one-third of Intercités total income and nearly three-
quarters of TER total income. As for the Transilien, fare policy changes linked to the “dezoning of the
Navigo pass” led to a drop of nearly 21% of commercial income in 201625, offset by an increase of
public subsidies. As a result, Transilien's overall income remained stable, but the influence of public
subsidies rose from 62% to 70% between 2015 and 2016.

The average commercial income per passenger26 also fell between 2015 and 2016 for other domestic
services, whether contracted or not. Thus it is 7.8 euros per 100 km in 2016 for TER and Intercités
contracted services (-3.2% compared to 2015), with significant differences in structure.27 For domestic
TAGV (including iDTGV and Ouigo), this amounts to an average of 9.5 euros per passenger per 100 km,
down 2.8% in 1 year.

The network access charges paid in 2015 by the railway companies (including the track access charges
collected by SNCF Réseau and the passengers stations access charges collected by SNCF Gares &
Connexion) amounted to approximately €4.15 billion excluding taxes, which represented 31% of railway
undertakings total income. To this amount paid by the railway companies is added the sum of €2 billion

22Trains arriving less than 6 minutes late at their terminal stations are not counted in the statistics.
23 See definition in Section 4.4 and Appendix 4.5.
24 SNCF Réseau is the French infrastructure manager and SNCF Gares & Connexion is the French stations manager.
25 The average income per passenger per 100 km is 5.7 euros excluding taxes in 2016, versus 7.4 euros excluding taxes in 2015.
26 This indicator reflects the income received by the railway undertaking. However, it is necessary to remain cautious about the

transposition of these results which are averages in “equivalent price” of a train ticket, because of the importance of the subscriptions for
the public services obligations, and from taking into account passengers enjoying free admission in total passenger traffic, these two
factors mechanically increasing the standard deviation around the average result provided here.
27 In 2016, the average kilometric income for a TER subscriber amounts to 4.2 euro cents per passenger-km, compared to 10.8 euro

cents per passenger-km for a non-subscriber.

                                                                                                                                                6 / 45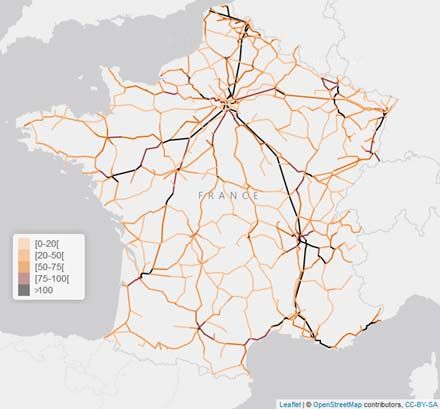
excluding taxes, representing the “access fee” paid by the organizing authorities of transport to
SNCF Réseau for public service obligations (TER, Transilien28 and Intercités).

For the domestic TAGV activity, the amount of network access charges paid in 2015 by SNCF Mobilités
amounted to €1.7 billion, that to say 38% of total income. This ratio is similar for international
commercial services on the RFN (36%).

In 2016, for every kilometre travelled per passenger on a regional public service obligation (PSO), the
user pays an average of 6.5 euro cents excluding taxes, and the organizing authorities of transport pays
the supplementary amount to the railway undertaking, which is 17.7 euro euros excluding taxes (+ 5.6
euro cents excluding taxes paid to SNCF Réseau for the access fee)

The regional rail network presents first of all some great disparities: the Rhône-Alpes Region has the
largest number of kilometres of network (nearly 10% of the RFN), but it is in Île-de-France and Nord-Pas
de-Calais that the rail network is the densest compared to the regional area.

Then, in terms of intensity of use and rail mobility per capita, Île-de-France stands out by far, with Alsace
coming in second. Picardie also has a relatively significant level of demand related to its proximity to Île-
de-France .

The supply of seats-km for regional PSO, which represents nearly half of the total traffic of all services
combined, contracted by 2.8% between 2015 and 2016. This decrease is explained by the decline in
trains-km (decrease in the number of TER traffic by 3.8%, and 2.8% for Transilien), which is only partially
offset in the case of TER by a an increase in the average carrying capacity per train in 18 of the 20
Regions (+1.2% for all TER activity).

These changes are less the result of the desire to reduce the scheduled offer than the disruption of
services related to the strikes of the 2nd quarter of 2016, which played a major role in the decline in
traffic. In fact, if the theoretically scheduled supply of TER had been fully realized (in other words if there
had been no train cancellations), the amount of traffic (in train movements) would have increased by
2%.

For TER, the decline in demand (-2.8%) is similar to that of supply (-2.7%). In contrast, the Transilien
activity, saw an increase in demand (+3.8%). This results into a stagnation of the average occupancy
rate for TER and a 1.8 percentage point increase in Île-de-France The occupancy rate of TER activity is
25% in 2016, and ranges from 15% to 31%, depending on the Region. However, in the second quarter of
2016, a period disrupted by social movements, subscriber occupancy remained stable, while non-
subscriber occupancy fell. In other words, the regular users, the subscribers, continued their movements
by being forced to adapt to the reduction of the supply related to the deschedulings, while the non-
subscribers had more latitude to refer to other modes of transportation, or chose not to travel.

In this context, TER commercial income decreased by 5.2% in 2016. The effect related to the decrease
in passenger traffic (in passengers-km) accounts for nearly 54% of the income decline, while the
remaining 46% is due to the decrease in average commercial kilometric income per passenger. TER
income is 75% of public subsidies, with disparities between Regions (from 65% in Alsace to 90% in
Limousin).

28In specific the case of Transilien, the STIF (Île-de-France Mobilités) pays the equivalent amount of access fees to SNCF Transilien who
then pays it to SNCF Réseau. For the other activities, the amounts paid by the organizing authorities of transport for the access fee are
paid directly to SNCF Réseau and do not pass through the railway undertaking.

                                                                                                                                            7 / 45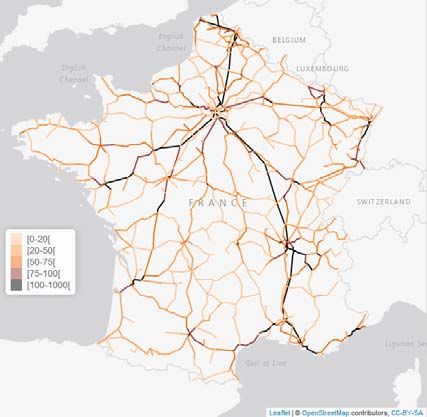
INTRODUCTION
The European Directive 2012/34/EU establishing a single European railway area (called the “Recast”
Directive) requires sectoral regulators to monitor competition in the rail services market. For this
purpose, the regulator is entitled to request information useful to the sector's participants (Article 56).

In France, among the missions that the legislator has entrusted to the regulatory authority for rail and
road activities is first of all that of contributing to “the monitoring and proper functioning, in its technical,
economic and financial dimensions, of the national rail transport system, including public service and
competitive activities, for the benefit of users and customers of rail transport services.” (Article L. 2131-
1 of the Transport Code).

To carry out this general interest mission, the Authority was entrusted, by decree no. 2015-990 of
August 6th, 2015 for the growth, activity and the equality of economic opportunity, with the power to
gather information.

Thus, the Authority “may collect data, carry out expert assessments and carry out studies and any
necessary actions of information in the sector [...]. It may in particular, by reasoned decision, provide for
the regular transmission of information by infrastructure managers, service infrastructure operators,
railway undertakings and SNCF.” (Article L. 2132-7 of the Transport Code).

In addition, for the performance of its tasks, the Authority shall have the right of access to accounting
records, in particular from infrastructure managers and railway undertakings, as well as the necessary
economic, financial and social information (first paragraph of Article L. 1264-2 of the Transport Code).

On the basis of the data collected from the railway undertakings29 and the infrastructure manager30, in
respect of decisions no. 2016-052 of 13 April 2016 and no. 2016-085 of 31 May 201631, a first general
assessment of the passenger rail transport business was carried out by the ARAFER studies and market
monitoring department for the 2015 and 2016 financial years.

This covers all rail passenger services32 carried out by railway undertakings operating on the French rail
network33: SNCF Mobilités and its various entities, brands, partnerships and subsidiaries, including the
Thalys and Eurostar railways, as well as Thello (Trenitalia group). The organization of these services in
2016 is illustrated by the infography shown on the following page.

This first sectoral publication, which is to be updated on a regular basis, is the result of a significant work
of almost a year between the services of the Authority and the participants of the sector in order to
obtain and process the set of data necessary for its development.

Safely stored by the Authority to ensure confidentiality, these data also constitute an essential basis for
regulatory work and give it the means to carry out more precise diagnostics of the issues and to
enlighten the stakeholders in the upcoming opening of domestic passenger rail transport to competition.

29 Data relating to the “downstream” market (services offered to travelers in their quantitative and qualitative dimension, traffic carried

out and corresponding commercial income, etc.).
30 Data relating to the “upstream” market (characteristics of the rail network, degree of use, etc.).
31 These decisions were updated for the following fiscal years.
32 Domestic/international traffic, regional/national PSO traffic, non-PSO traffic on the RFN.
33 Outside the field of study: Corsica Railways, RATP network, urban guided transport (metro and tram), tourist railway lines, port railway

networks, “isolated” railway lines, not connected to the RFN.

                                                                                                                                              8 / 45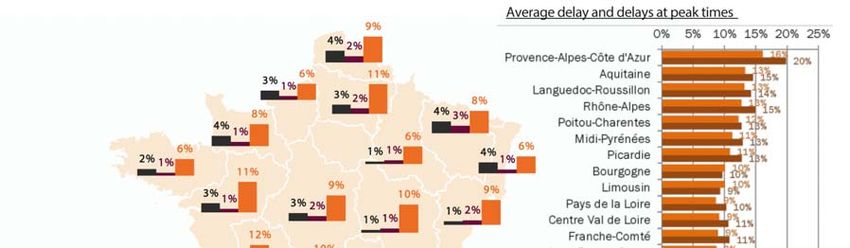
Infography 1 – The organization of passenger rail services in France in 2016

                                               Source: ARAFER

WARNING
The results presented were obtained by statistical processing of the Authority's services, based on data
transmitted as part of the data collection provided for by the Transport Code. In this reporting process, it
is the responsibility of the railway undertakings and the infrastructure manager to ensure the reliability
and completeness of the data before transmitting it to the Authority.

While using the collected data, the Authority's services endeavoured to have any errors or
inconsistencies detected in the data transmitted by successive iterations corrected with the participants.
However, the Authority cannot guarantee the complete reliability of the data received on behalf of the
respondents.

                                                                                                               9 / 45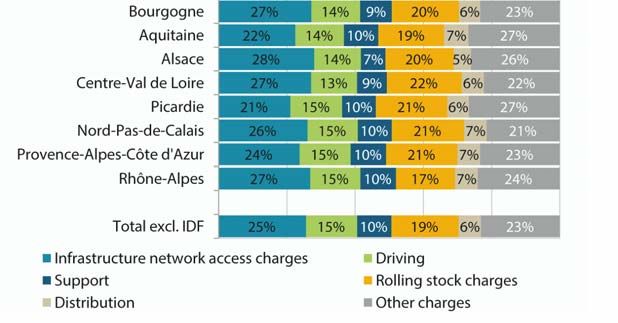
1. CHARACTERISTICS AND DEGREE OF USE OF THE NATIONAL RAIL NETWORK (RFN)
If the general characteristics of the national rail network (RFN) are relatively well known (size and age of
the network, electrified portion, high-speed portion,etc.), its degree of use is less known. This Section
presents new information on the distribution of passenger traffic on the RFN.

1.1. 2nd European railway, mostly used for passenger transport, with significant geographical
   disparities in its intensity of use

With 28,808 kilometres of lines operated at the end of 2015, France has the second largest European
railway after Germany.34 55.5% of the RFN is electrified and 7% are high-speed lines.35 The average age
of the network is 30.9 years36 while the average age of the high-speed rail tracks is 19.4 years. Finally,
nearly 24% of the tracks were considered to be outdated in 2015. Appendix 1.1 provides additional
information concerning the characteristics of the network, by UIC category of tracks.37

Furthermore, 473 million trains-km (passenger and freight trains) travelled on the RFN in 2016, of which
84.6% were for passenger transport. This volume of trains-km puts France in 3rd position in Europe,
after Germany and the United Kingdom (see Appendix 1.2). The share of passenger transport on the rail
network in France is also close, for example, to that observed in Belgium, Spain and Norway, slightly
above the European average of 81.6% in 2015.38 However, this share is much lower than that of
Great Britain (93.5%) and higher than that of Germany (75%).

                                                           Figure1 - Traffic density of passenger trains
 With an average of 40                            per kilometre of line of the RFN in 2015 (in average number of
 passenger trains traveling every                           trains per day and per direction of traffic)
 day per kilometer of line and
 per direction in 2015, France                                                        100%
 ranks 10th in Europe in                                                                          27% of the RFN                           69% of the RFN
 intensity of use of its rail                                                                     80% of movements                            99% of movements
                                                                                      80%
                                                   % of the passenger train traffic

 network, ahead of Spain, but
 behind the United Kingdom,
 Germany     and     Italy   (see                                                     60%                                                 ≥100 movements/day
 Appendix 1.2).                                                                                             9% of the RFN
                                                                                                                                          [75-100[ movements/day
                                                                                                            50% of movements
                                                                                      40%                                                 [50-75[ movements/day
 This ranking is explained by the                                                                    6% of the RFN
                                                                                                     40% of movements
 fact that the intensity of use of                                                                                                        [20-50[ movements/day
                                                                                      20%         2% of the RFN
 the RFN holds large disparities                                                                  20% of movements
Figure 2 - Mapping of railway traffic (all passenger services39) on the RFN in 2015
(average number of trains per day and per direction)
Source: ARAFER
1.2. The RFN has 2,996 railway stations and train stops, located in 2,634 municipalities
In 2016, 2,634 municipalities are served by at least one rail service, of which 89% are by TER. 69% of
municipalities in metropolitan France are located within 10 km, as the crow flies, from one of the 2,996
railway stations or stops operated, and 90% of the population lives within 10 km of one of these
stations. Characteristics of cities served by the railway are detailed in Appendix 1.3.
Of the 2,996 railway stations and train stops operated on the RFN, 245 stations, including 212 in Île-de-
France, record more than 100 movements40 of regional trains (TER and Transilien) each day (intensity of
use of railway stations by type of service is detailed in Appendix 1.4). The Île-de-France Region is
therefore characterized by a greater use of its stations for “everyday” mobility. The municipalities hosting
these stations have an average population of 49,780 inhabitants in Île-de-France and 176,635
inhabitants outside Île-de-France. For domestic long-distance services (domestic TAGV and Intercités),
only 4 stations (Paris-Montparnasse, Paris-Est, Paris-Gare-de-Lyon and Lyon-Part-Dieu) record more than
100 daily movements, illustrating the “star” architecture of the long-distance network.
39 Mapping of the traffic by type of rail service is available in Appendix 1.2.
40 Counted as a movement are: the departures of lines, stops at the final terminal and intermediate stops.
11 / 452. COMPARATIVE CHANGES IN PASSENGER RAIL TRANSPORT
This Section provides elements of long-term intermodal and international comparisons, based on
available national statistics (SDES and Eurostat). These data provide useful insights into historical trends
at a macroscopic level, but should nevertheless be taken with caution. Indeed, some differences in
scope and retropolation faults have been detected by the Authority, following its analysis of the detailed
data collected for the years 2015 and 2016, the results of which are presented starting from Section 4.
2.1. With a modal share of 9.2% in 2016, down since 2011, rail transport has not been benefitting
from the development of mobility observed in France
With more than 950 billion passengers-km in 201641, domestic passenger transport in France grew by
2.3% year-to-year, representing a growth rate higher than that observed over the last 5 years
(+1.2% since 2011) and over a longer period (+1.0% on average since 1990).
This growth is driven by the dynamism of road transport (collective and individual) and air transport
(Erreur ! Source du renvoi introuvable.). Conversely, rail transport (excluding RATP42) is down 1.5% year-
to-year. This situation of relative loss of speed in rail mode in a global market in growth has continued
since 2011.
Between 2011 and 2016, demand in rail services shows an annual decrease of 0.5% on average, while
other modes are growing in France, such as road (+1.4%) and air (+1.9%).
Table 1 Breakdown of domestic passenger traffic in France
Level TCAM 2016/2015
In billions of passengers-kilometres 2016 2011-2016 change
Total domestic passenger transport 956.4 +1.2% +2.3%
with transport in particular vehicle (including
756.4 +1.3% +2.7%
carpooling)
with urban and interurban road transport
82.0 +2.6% +3.1%
(including SLO43)
with air transport
14.8 +1.9% +3.8%
(domestic flights to the metropolis)
with rail transport on the RFN
87.844 -0.5% -1.5%
(i.e. excl. RER RATP)
with other rail transport (RER, RATP, metro IDF
15.4 +0.6% +0.8%
and excl. IDF)
Source: SDES – 2016 Transport Accounts
41SDES – 2016 Transport Accounts.
42 RATP = company providing subway services in Paris and co-operating with SNCF (Transilien) 2 lines of suburbian trains (RER A &B)..
43 SLO = liberalized coach services (in French “Services librement organisés”).
44 Source SDES - the 2015-2016 passenger-km volume calculated by the ARAFER differs slightly from the SDES values, due to
differences in scope: the ARAFER passenger-km statistics are in fact calculated on the physical distance (and not the “commercial
distance”) traveled by each passenger transported for a fee and free of charge (the latter category is not included in the SDES scope) by
an exclusively rail transport service (the SDES scope of the trains under contract with the Regional Councils includes the services of TER
cars).
12 / 45Thus, as shown in Figure 3, the modal share of rail has oscillated between 7 and 10% for almost
30 years, with a low point reached in 1995 following several years of crisis, and a maximum reached in
2011.
Figure 3 - Evolution of the modal share (in passengers-km)
of the car (left-hand scale) and of the train (right-hand
For 15 years, the rail mode has experienced annual scale) in passenger transport in France since 1990
growth rates of occupancy higher than those of
other modes45 thanks in particular to the
development of the high-speed line network and
the development of the TER supply driven by the
Regions. However, this trend stopped in 2011, with
the cap on TAGV congestion and the decline in TER
traffic (especially non-subscribing passengers).
A set of factors, both exogenous (lack of
attractiveness following the attacks, development
of new modes of mobility such as carpooling and
coaches for example) and endogenous (adequacy
of supply on demand, price, quality of service for
example) can explain the evolution of rail service
occupancy.
The identification and quantification of the weight
of each of these factors cannot be established at
this stage, and requires specific studies.
2.2. Between 2010 and 2015, the European passenger transport market was more dynamic than
in France
Between 2010 and 2015, with an average annual growth rate of 0.7% in rail traffic, France ranks 10th
on this criterion, behind the United Kingdom (2nd, +3.5%), Germany (6th, +1.6%) and Italy (7th, +1.4%).
The average annual growth of the IRG-Rail member countries was also 1.5% over the same period,
almost twice the growth rate observed in France.
Europe's leading passenger rail market in 2010 (in number of passengers-km transported), but
experiencing sluggish growth, France was surpassed in 2012 by Germany, which benefited from more
dynamic growth in its number of rail users.
Rail's modal share in passenger land transport is still close to 10% in France, which is higher than the
European average (7.7%) and above the level seen in the four major neighbouring countries (Germany,
United Kingdom, Italy, Spain), whose modal share is between 6 and 8%. However, the gap is decreasing
because of the growth differential explained in the first paragraph, as shown in Figure 4.
45 See Appendix 2.1 for more details.
13 / 45Figure 4 – Changes in modal share of rail in land passenger transport
(excluding domestic air transport, excluding urban public transport)46
Source: Eurostat
3. OVERVIEW OF THE MARKET IN 2015/2016
From this Section and to the end of the document, the data presented stems from the Authority's use of
data collected from railway undertakings and infrastructure managers. The results and contents
presented are therefore largely unpublished and provide a complete overview of the passenger rail
transport market in France, both from the point of view of supply (including quality of service) and
demand, as well as the financial results for the railway undertakings.
To this end, the Authority has had to clarify and make more reliable the scope of analysis corresponding
to the passenger rail transport market carried out on the RFN, which has led to discrepancies with the
national statistics available up to now.
The three main sources of discrepancy are as follows: (i) here the TER traffic is only rail and thus
excludes traffic in coaches TER47; (ii) traffic statistics in domestic TAGV (trains-km, passengers-km) are
calculated on the basis of the actual kilometres travelled by trains and passengers (it is therefore the
“physical” distances which are taken into account and not “commercial” distances48); (iii) demand
statistics include all passengers on board trains, including those who receive free services.49
These corrections in scope make possible to more accurately reflect the weight of this market and its
changes.
46 The scope of the modes of passenger transport concerned is not the same as in the previous part, since domestic air transport is not
taken into account in the Eurostat data.
47 Or “Cars-TER”. Note that in the Transport Accounts, the “PSO Trains from regional transport authorities” includes the traffic carried out
in TER Cars.
48 The national statistics available so far are presented in physical trains-km and in commercial passengers-km. For example, on a Paris-
Lyon route using LGV, the “physical” distance is 427 km, and the “commercial” distance is 511 km, which leads to an overestimation of
about 20% of passenger traffic.
49Demand of free passengers was not included in other available statistics.
14 / 453.1. 1.4 billion passengers transported by train in 2016, with 88% in TER and Transilien
In 2016, nearly 1.4 billion passengers and 87 billion passengers-km were transported on the RFN, which
on average represents approximately 3.8 million passengers per day on one of the 11,200 daily
passenger trains on the RFN.
Figure 5 – Distribution of supply50 (trains-km, seats-km) and demand
(passengers-km and passengers) by rail service in 2016 and changes compared to 201551
Breakdown of supply: in trains-km to the left; in seats-km to the right.
373 million trains-km (-4.2%) 202 billion seats-km (-2.9%)
Breakdown of demand52: in passengers-km to the left; in passengers to the right.
86.7 billion passengers-km (-1.0%) 1.4 billion passengers (+2.2%)
International
and other International
and other
commercial
commercial
services Domestic TAGV
services
7.9% 7.4%
1.7%
TER Intercités
15.0% 3.1% TER
17.7%
Transilien
Domestic 16.6%
TAGV
52.8%
Intercités
7.7% Transilien
70.1%
Source: ARAFER
Public service obligations (TER, Transilien and Intercités) supply 68% of the trains-km and 59% of the
seats-km. These trains transport 39% of the passengers-km but 91% of the passengers.
This structural difference, depending on the measure used, is mainly due to the fact that users of
Transilien services, which alone accounted for 74% of passengers in 2016, make much shorter journeys
(in distance) than other passengers.
50 Appendix 3.1 provides the traffic in 2015 (trains-km and passengers-km) as well as its quarterly change in 2016. Appendix 3.2 also
provides a breakdown of the characteristics of the rail service supply, including the distribution of supply in terms of occupancy and seats
offered daily by the different services.
51 The 2015 data is available in Appendix 3.
52 Passengers who have made “cabotage” trips on an international high-speed service are included in the “Domestic TAGV” activity.
15 / 45In fact, the average distance travelled per passenger is 350 km for long-distance domestic services (TGV
and Intercités), 53 km for TER services, and finally 15 km for Transilien services.
3.2. The commercial supply realised in 2016 contracted much more than the demand
Between 2015 and 2016, the commercial supply of all rail services, measured in trains-kilometres,
contracted by 4.2% (-2.9% in seats-km), affecting all rail services, in different degrees (Figure 6).
The contraction in supply was accompanied by a drop in occupancy of 1% (in passengers-kilometres).
This decrease is due to a decrease in kilometres travelled on average per trip (-3.4%), considering that
the total number of passengers transported increased by 2.4%, thanks to Transilien.
Figure 6 – Changes in supply (trains-km) of passenger rail services and occupancy (passengers-
km) between 2015 and 2016
Source: ARAFER
The drop in the supply made in 2016 is mainly due to the 9.8% fall in the trains-km supply achieved in
the second quarter of 2016 (all services included), compared to the previous quarter. Business in the
2nd quarter of 2016 was certainly disrupted by social movements that led to the descheduling of trains
(see Section 5).
Figure 7 compares the actual traffic to the expected traffic. In particular, we can see that if the expected
supply had been fully realized, in other words if there had been no train cancellations, the amount of TER
and Intercités traffic would have increased by 2% and 1% respectively. In the end, the actual TER and
Intercités movements decreased respectively by 3.8% and 6.8% due to train cancellations, and in
particular the deschedulings in the 2nd quarter of 2016.
On the other hand, the scheduled supply of domestic TAGV in 2016 already included a decrease in
traffic of 2% compared to the supply made in 2015. The cancellations of traffic were added to obtain a
reduction of actual traffic of 4%.
As for international trains, the increase in traffic actual (+5.4%) in 2016 is relatively close to that which
had been scheduled (+7%).
16 / 45Figure 7 – Changes in scheduled supply and supply actually made between 2015 and 2016
Source: ARAFER
Note for the reader: between 2015 and 2016, the Intercités train schedule forecast a 6.4% drop in the number of routes to be operated. Due
to the balance of deschedulings and cancellations during the year (as well as possible late over-scheduling) this decrease was 6.8%.
3.3. The average occupancy rates were between 25% for TER and 67% for TGV
Domestic TAGVs are the services with the highest occupancy rate, averaging 67% in 2016, and close to
70% in the second and third quarters of 201653. On the other hand, the regional services (TER and
Transilien) have an average occupancy rate of less than 30%, while Intercités and international trains
are less than 50% occupied.
Figure 8 - Carrying capacities54 (graph on the left) and average occupancy rates (graph on the right) by
type of service in 2015-2016
In number of seats
Source: ARAFER
53 The quarterly changes in occupancy rates is available in Appendix 3.1
54 Carrying capacity measurement is based on seat counting only.
17 / 45We can also note the marked increase in the occupancy rate of TER services during the second quarter
of 2016 (+2.1 points compared to the average of the other 3 quarters) due to a drop in occupancy in
much smaller proportions, than the supply of trains-km (-6% of passengers-km compared to the first
quarter of 2016, vs. -14% of trains-km). This result confirms that during this period of social movements,
TER passengers continued to use the service while being forced to adapt to a reduced supply of almost
half (see Section 5).
Finally, it should be noted that additional data is needed to distinguish occupancy rates for peak and off-
peak periods. This complementary analysis would better reflect the actual experience of peak-time rail
passengers, including the contracted regional services (Transilien and TER).
3.4. More than 26,500 domestic rail routes55 (excluding Transilien) are offered in 2016, with 2,300
by several parallel rail services
The 26,500 domestic railway routes operated in 2016 have different characteristics depending on the
type of rail service offered. For example, around 80% of TER services are provided by connections of less
than 100 km on which 70% of passengers using these services travel (see Annex 3.2) However, a
majority of Intercités (53%) and TGV (89%) passengers travel on routes of more than 200 km. The
Intercités supply offers connections with a wider range of distances travelled (reflecting regional, inter-
regional and national journeys).
Furthermore, 2,300 railway routes (8.7% of the routes) are operated by at least two different railway
services.56 These routes, for which several railway offers (both PSO and not) coexist, were used by
38% of passengers in 2016.
The coexistence of several rail services on the same connection raises the question of their possible
complementarity/substitutability. From the point of view of the use of the network capacities as well as
that of user preferences, the coexistence of several services on the same portion of infrastructure is only
justified if these services have sufficiently different characteristics (for example: commercial speed,
frequencies, time slots, prices, quality of service, etc.).
All sorts of situations are observed, notably:
88% of the rail routes (Figure 9) are operated only by a PSO (TER or Intercités) and represent
18% of the domestic demand (Figure 10).
More than 84% of the routes are operated exclusively by a TER service, 12% of passengers used
them in 2016.
Nonetheless, 5.7% of the routes are operated both by a TER service and an Intercités service,
representing nearly 10% of the traffic. On these routes the Intercités demand represented nearly
62% of the passengers transported versus 38% for TER (Figure 11).
28% of passengers travelled on a route for which there is both a contracted supply (TER and/or
Intercités) and a non-PSO supply (domestic TAGV). On these routes, nearly 46% of passengers
used a TAGV service, 25% an Intercités service and 25% a TER.
The mapping of connections serviced by multiple services is provided in Appendix 3.4.
55Including cabotage routes, operated within the framework of international lines.
56 This analysis is carried out in first approach on the sole criterion of the origin/destination of the route (same town of origin/same
common destination), without taking into account other criteria of substitutability. Among the connections operated by different rail
services, it is possible that the traveler does not have the choice of the service according to the day or the time of travel (for example, a
route operated during the week only by a TER service, and also by an Intercités service on weekends).
18 / 45Figure 9 - Breakdown of the number of rail Figure 10 - Breakdown of demand in 2016
routes operated in 2016 by type of service (in passengers) based on the supply of routes
(excluding Transilien) of rail services (excluding Transilien)
Source: ARAFER
Note for the reader: nearly 5.7% of the domestic connections were operated on all or part of 2016 by a TER service and an Intercités
service. To this is added 0.8% of the connections operated in 2016 by a TER service, an Intercités service and a TAGV service.In 2016,
these 5.7% of connections represented 9.8% of the number of passengers on domestic routes (excluding Transilien) in number of
passengers.
Figure 11 - Breakdown of demand in 2016 (in passengers) on routes operated by more than
one rail service
Source: ARAFER
Note for the reader: on the routes operated by a TAGV, TER and Intercités service in 2016, nearly 53% of the passengers carried used
a TER service, 14% an Intercités service and 33% a high-speed service.
19 / 454. QUALITY OF SERVICE OF PASSENGER RAIL TRANSPORT
Service quality covers multiple dimensions. In France, the Quality of Transport Service Authority (AQST)
measures and publishes statistics on cancellations and delays, particularly on rail services. The AQST
statistics are calculated as follows:
‐ Cancelled trains are counted to evaluate the reliability of services. Only the trains whose routes
were deleted (totally or partially57) were counted when it was anticipated in the definitive
transport plan set the day before at 4 pm. For example, cancellations may stem from personal
accidents or even unavailability of equipment.58 In the rest of the study, these cancellations will
be called “last-minute cancellations” or “operational cancellations”;
‐ Delays on arrival are measured at the terminal station of the route, according to the thresholds
established by SNCF Mobilités for domestic services. Only trains whose traffic was disrupted are
counted, resulting in a delay at the terminal of at least 5min 59sec for regional services and
long-distance trips of less than 1h 30min, 10min 59sec for trips between 1h 30min and 3hrs
and 15min 59sec for trips longer than 3hrs.
In order to refine the measurement of the reliability of rail services and to better reflect the travellers’
feelings, ARAFER has calculated, in addition to the “last minute” cancellations, train descheduling. Thus,
among the trains whose traffic has been scheduled, trains that have been cancelled for whatever reason
are included in the operational transport plan, i.e. in the route schedule which is set the day before
departure at 4 pm. For example, trains that are cancelled a few days before their movement due to a
strike notice will be counted in this category. This innovative indicator provides a complete view of train
deletions explaining the difference between the theoretical supply and the actual supply.
In addition, the 5:59 delay threshold was adopted by the Authority for all domestic rail services,
regardless of the distance travelled, in order to facilitate the comparability of the results.
This quality of service information is not currently available for Transilien services, which is therefore not
included in this Section. Further work will be carried out to integrate them into the future publications of
the Authority. Moreover, with regard to international services, the punctuality thresholds differ
significantly and make it impossible to make comparisons.
It should be noted that, following its decision no. 2017-045 of 10 May 2017, the Authority should have a
more detailed view of the descheduling, as of the 2017 service schedule, which will enable it to
distinguish in particular the descheduling which took place in the 3 days preceding the departure. This
should help to better characterize the effect of these disturbances on travellers. Additionally, the
Authority will collect data on trains that are at least 5 minutes and 0 seconds late (instead of
5min 59sec) and for each service point on the train route (instead of the terminal station only). This
change will make it possible to more accurately measure the number of passengers affected by service
disruptions, while converging towards a harmonization of the measurement of delays at the European
level.59
In order to subsequently analyse the determinants of travellers’ modal choices and, in particular, the
weight of the quality of service in these arbitrations, it seems necessary to first produce statistics that
better reflect the quality perceived by travellers. Future work will be required to assess the number of
travellers affected by service disruptions, particularly during peak hours. The inclusion of comfort
indicators is also relevant, like models developed, among others, in the United Kingdom.60
57 Only part of the planned route has been completed.
58 See the causes for delays and cancellations on the AQST site. (http://www.qualitetransports.gouv.fr/)
59 The European Commission recommends a threshold of 5 minutes and 0 seconds for calculating these delays (http://eur-
lex.europa.eu/legal-content/EN/TXT/PDF/?uri=CELEX:52016SC0427&from=EN)
60 https://www.itf-oecd.org/measuring-and-valuing-convenience-and-service-quality
20 / 454.1. In 2016, 5% of scheduled trains were cancelled and 11% of circulating trains arrived with a
delay of more than 6 minutes at their terminal station
The graph below (Figure 12) illustrates the degree of completion of the daily scheduled supply for TER,
Intercités and TGV services in 2016.61
Figure 12 – Daily reliability and punctuality62 of passenger rail services in France in 2016
(excluding Transilien)
8 000
6968 229 6739 84 31
7 000 6623 772
5851
6 000
5 000
4 000
3 000
2 000
1 000
-
Source: ARAFER
Note for the reader: on an average of 6,968 trains scheduled per day in 2016 (trains whose running was announced), an average of
229 were descheduled before D-1 at 4 pm (in particular for adjustments to the transport plan and strike notices), 84 trains were
deleted daily between D-1 4 pm and their running date (run cancelled completely), 31 trains were partially cancelled (i.e. before their
arrival at the terminal station), and of the 6,623 trains having run, 772 arrived with a delay greater than 5:59 minutes at their terminal
station.
Of the 6,968 passenger trains scheduled daily in 2016, 229 trains were descheduled (representing
a 3.3% descheduling rate) and 115 trains were cancelled “at the last minute” (i.e. cancellation rate
of 1.7%). Thus, in total, the deletion rate of rail services (descheduling and cancellations) amounts to
5%, or 344 trains per day in 2016.
In other words, not taking into account the descheduling in the official statistics of service deletions is to
consider only one third of the deletions that actually took place. This can be problematic especially when
it comes to comparing themselves at the European level. In many other countries, the cancellation rate
provided to the European Commission63 corresponds to the sum of all the train deletions that took
place, regardless of the delay in their occurrence.
It should also be noted that the sixth annual IRG-Rail report, which will be published in early 2018, will
specify the criteria for national measures for cancellations and delays in several European countries.
61 The circulation of tram-trains outside Île-de-France is not included in the reliability and punctuality analyses to allow for counting in the
scope of calculation in all regions.
62 See appendices 4.2 to 4.4 for additional details (by type of service).
63 The full reports and their appendices are available at the following link:
https://ec.europa.eu/transport/modes/rail/market/market_monitoring_en. Graphs relating to the reliability of rail services are presented
in Appendix 4.1 of this report from the Authority.
21 / 45You can also read