High Speed Rail Strategic Alternatives Study - Update Following Consultation January 2012 - Gov.uk
←
→
Page content transcription
If your browser does not render page correctly, please read the page content below

High Speed Rail
Strategic Alternatives Study
Update Following Consultation
January 2012

                                1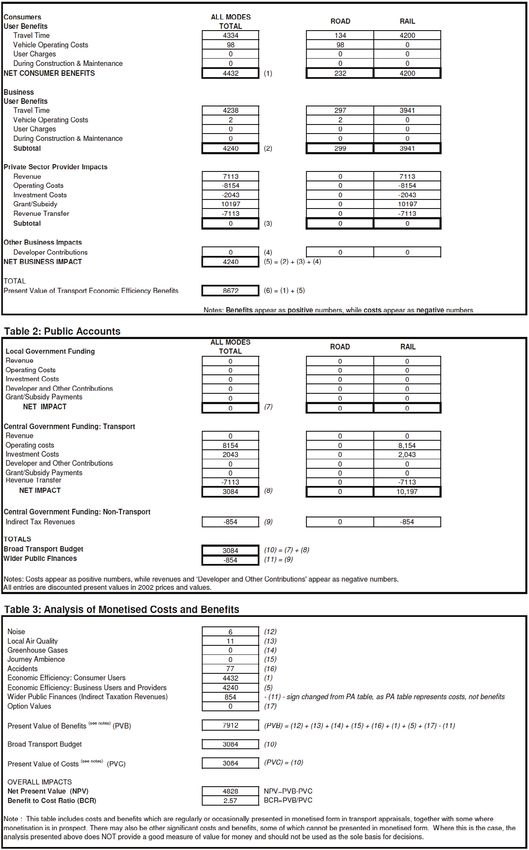
High Speed Rail Strategic Alternatives Study – Update Following Consultation

Notice
The information or guidance in this document (including third party information, products and services), is provided by DfT on an ‘as is’ basis, without any
representation or endorsement made and without warranty of any kind whether express or implied.
The Department for Transport has actively considered the needs of blind and partially sighted people in accessing this document. The text will be made available
in full on the Department’s website. The text may be freely downloaded and translated by individuals or organisations for conversion into other accessible
formats. If you have other needs in this regard please contact the Department.
Department for Transport
Great Minster House
33 Horseferry Road
London SW1P 4DR
Telephone 0300 330 3000
Website www.dft.gov.uk
General email enquiries FAX9643@dft.gsi.gov.uk
© Queen’s Printer and Controller of Her Majesty’s Stationery Office, 2012, except where otherwise stated
Copyright in the typographical arrangement rests with the Crown.
You may re-use this information (not including logos or third-party material) free of charge in any format or medium, under the terms of the Open Government
Licence. To view this licence, visit www.nationalarchives.gov.uk/doc/open-government-licence/ or write to the Information Policy Team, The National Archives,
Kew, London TW9 4DU, or e-mail: psi@nationalarchives.gsi.gov.uk.
Where we have identified any third-party copyright information you will need to obtain permission from the copyright holders concerned.
To reproduce maps, contact Ordnance Survey via their website www.ordnancesurvey.co.uk/oswebsite/business/licences/ or write to Customer Service Centre,
Ordnance Survey, Romsey Road, Southampton SO16 4GU.

2
High Speed Rail Strategic Alternatives Study – Update Following Consultation
Contents
1 Introduction 4
1.1 Background 4
1.2 Purpose of the Report 4
1.3 Structure of the Report 4
2 Strategic Alternatives 5
2.1 Introduction 5
2.2 Network Rail Review 5
2.3 London – West Midlands Strategic Alternatives 5
2.4 ‘Y’ Network Strategic Alternatives 9
3 Demand Forecasting 12
3.1 Introduction 12
3.2 Future Year Baseline 12
3.3 Modelling of Rail Packages 15
4 Capital and Operating Costs 18
4.1 Introduction 18
4.2 Capital Costs 18
4.3 Rolling Stock 20
4.4 Operating Costs 20
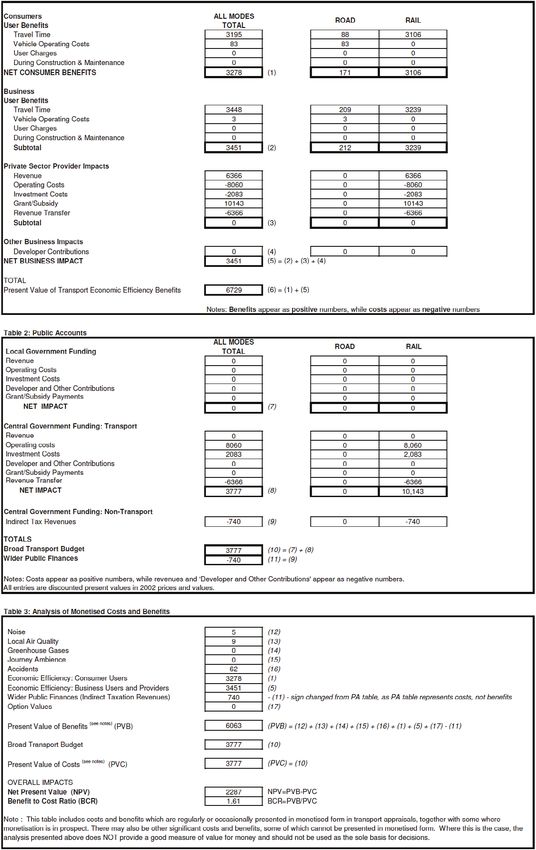
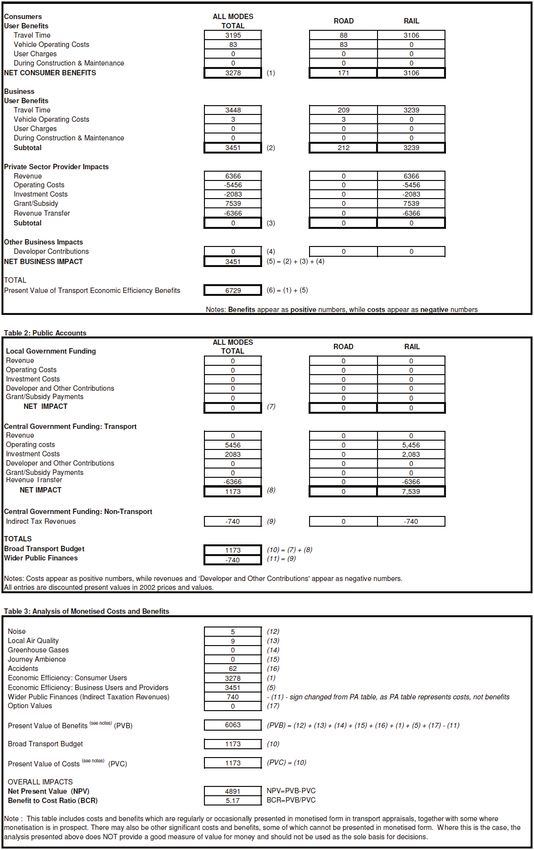
5 Economic Appraisal 25
5.1 Overview 25
5.2 Derivation of Scheme Costs 25
5.3 Derivation of Scheme Benefits 26
6 Summary and Conclusions 31
6.1 Introduction 31
6.2 London to West Midlands Strategic Alternatives 31
6.3 ‘Y Network’ Strategic Alternatives 32
Appendix A 33
Summary of Capital Costs
Appendix B 37
TEE Tables
3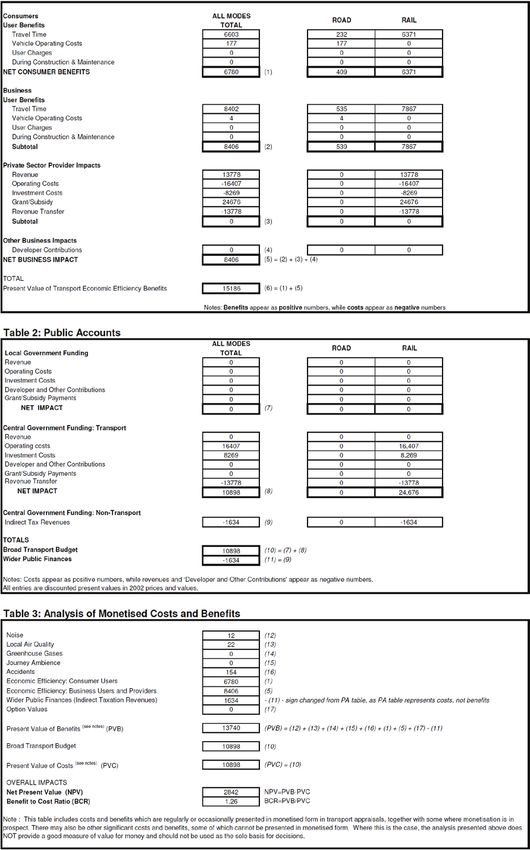
High Speed Rail Strategic Alternatives Study – Update Following Consultation

1 Introduction
1.1 Background
Atkins was appointed by the Department for Transport (DfT) in August 2009, to consider road and rail
improvement alternatives to the High Speed Rail proposition being developed by High Speed Two (HS2) Ltd. The
main objective of HS2 Ltd at the time was to consider the case for new high speed services between London and
the West Midlands. However, in appraising the HS2 business case and in approving the proposed investment
decisions, it was necessary for DfT to also appraise a range of strategic alternatives to HS2 as comparators. Atkins
therefore developed an incremental range of road and rail interventions on the existing road and rail networks
between London and the West Midlands, designed both to increase capacity, and to bring down journey times on
this corridor. These were then costed, modelled in terms of the impact on revenue and appraised to allow them to
be compared with the HS2 proposals.
Atkins was subsequently re-engaged by the Department for Transport (DfT) in October 2010 to appraise a set
of strategic alternatives to the Government’s overall proposed high speed rail strategy for a Y-shaped network
linking London with Birmingham, Manchester and Leeds. These scenarios were developed by DfT, and included
enhancements to not only the existing line between London and the West Midlands but also to the East Coast
Main Line (ECML) and the Midland Main Line (MML). Atkin’s economic appraisal of these alternatives to the
proposed Y network was published as part of the suite of HS2 consultation documents.
Alongside this work, Atkins was also commissioned to update the original economic appraisal of the London to
West Midlands Strategic Rail Alternatives, to be consistent with the latest assessment of the HS2 London to West
Midlands scheme.
Further to the HS2 Consultation process, further updates of the key Strategic Alternative packages have been
commissioned, which are the subject of this report. These updates have concentrated on Rail Package 2 and its
variants (including a package proposed by 51M, a grouping of local authorities), as this package was found to offer
the most credible alternative to the business case for HS2 between London and the West Midlands and attracted
the most comment in consultation responses, and on Scenario B as the most credible alternative to the wider HS2
‘Y’ Network.
These Strategic Alternatives have been revised, in this document, to take account of:
• The updated HS2 model (2010 baseline) – which itself takes account of recent high growth in demand on the
  West Coast Main Line following completion of the West Coast Route Modernisation (WCRM) programme and
  recent timetable changes; and
• Feedback from the HS2 Consultation process and from a report on the key alternatives which was
  commissioned by the Department for Transport from Network Rail in the light of the interest in these schemes
  raised in consultation.

At the same time and, in parallel, Atkins has taken the opportunity to review some of the assumptions used
previously and add greater detail to the modelling, which has in some cases been able to ensure greater consistency
between HS2 and the Strategic Alternatives.

1.2 Purpose of the Report
This document provides an update to the appraisal of the key Strategic Rail Alternatives to the HS2 proposition.
The report outlines the appraisal of the alternatives being considered. It summarises the interventions developed,
examines the Capital and Operating Costs, and then details the Economic Appraisal of the Alternatives.
This document should be read in conjunction with the earlier Atkins reports on the Strategic Alternatives.

1.3 Structure of the Report
The remainder of this report is structured in the following manner:
•   Section 2 provides a description of the packages of potential interventions being examined;
•   Section 3 details the results of the demand forecasting of the interventions;
•   Section 4 details the Capital and Operating Costs;
•   Section 5 presents the results of the Economic Appraisal; and
•   Section 6 summarises the findings of the report and draws out conclusions from the work undertaken.

4

High Speed Rail Strategic Alternatives Study – Update Following Consultation

2 Strategic Alternatives
2.1 Introduction
This section outlines the process that was undertaken to derive ‘packages’ of interventions. The process involved
examining the future year baseline situation to determine the key issues. A series of individual interventions were
then developed that addressed these issues which were then packaged and appraised.

2.2 Network Rail Review
Following the HS2 Consultation process, DfT asked Network Rail, as the custodian of the existing network, to
review the Strategic Alternatives proposed. This review concentrated upon RP2, RP2A, 51M and Scenario B. The
review focused on the costs, deliverability and operational impacts of these key enhancement packages.
Network Rail’s report, which sets out in detail their assessment of these packages, including their view of the
potential impacts on suburban crowding and reliability, and potential areas of additional cost, is published on the
Department for Transport’s website. Where items of Network Rail’s analysis have been incorporated into our work,
these are discussed in the relevant sections of this document.

2.3 London – West Midlands Strategic Alternatives
2.3.1 The Alternatives
The London – West Midlands HS2 Strategic Alternatives were developed by Atkins as part of the original Strategic
Alternatives study as alternative investment packages that could be used to test the robustness of HS2’s business
case. Due to the geographic scale of the proposed HS2 route between London and the West Midlands few
individual interventions would be able, on their own, to deliver sufficient functionality, whether in terms of journey
time improvements or capacity enhancements, to act as an “alternative” to the HS2 proposition. It was therefore
considered more appropriate to examine packages of interventions.
A total of four packages were put together originally for consideration, with a couple of variations on the four
packages. These were known as Rail Packages 2, 3, 4 and 5, with variations, Rail Package 2A and 3A. The packages
were designed so that each subsequent package builds upon the preceding one, so the scope of Rail Package 5
(RP5) was much greater than that of Rail Package 2 (RP2).
The previous work indicated that RP2 and RP2A had the highest BCRs. These also attracted the most comment
in consultation responses. Therefore, this update, following consultation with the DfT, has focused on the
reassessment of the RP2 and RP2A packages. A further consideration or update of packages 3-5 was not deemed
to be necessary at this point in time. However, as detailed below, a new package proposed by the 51M group of
local authorities has also been tested.

2.3.2 Rail Packages 2 and 2A
2.3.2.1 The Intervention Packages
In Rail Package 2 (RP2), an increase in long distance capacity is delivered by an increase in train service frequencies
on the West Coast Main Line – up to 16 trains per hour on the fast lines. To enable these to operate supporting
infrastructure enhancements have been proposed.
In RP2, there are some modest speed improvements associated with the infrastructure improvements proposed,
but most of the journey time improvements result from fewer intermediate station stops per train made possible by
the higher train frequency. Some improvements in journey times in RP2 also come from removing the performance
allowances currently included in the WCML timetable. A variant of RP2, known as RP2A, was also developed,
which retained the current performance allowances.

                                                                                                                          5
High Speed Rail Strategic Alternatives Study – Update Following Consultation

The component schemes for RP2 and RP2A are therefore the same, the difference lies in the journey times
assumed. The component schemes for the original RP2 and RP2A are given below:
•   Stafford area by-pass;
•   Grade separation between Cheddington and Leighton Buzzard;
•   3 new platforms at Euston;
•   3 extra platforms at Manchester Piccadilly (with grade separation at Ardwick);
•   4-tracking Attleborough - Brinklow (including freight capacity works at Nuneaton);
•   Northampton area speed improvements; and
•   4-tracking Beechwood Tunnel – Stechford (on what is often known as the “Coventry corridor”).
The component schemes of Rail Package 2 (and 2A), outlined above, have been revised for this update. Firstly, a
lower specification Stafford scheme has been adopted, which involved the grade separation of Colwich junction
and a ‘Colwich cut-off’, rather than the full Stafford area by-pass. The Stafford by-pass scheme included in the
original Strategic Alternatives work was designed to meet both of the packages’ twin aims of providing increased
capacity and generating journey time savings (2.5 minutes on trains between Crewe and Colwich not calling at
Stafford and 1.5 minutes on trains running between Colwich and Manchester).
Following further consideration, and in the light of consultation responses, the Department for Transport reached
the view that this scheme should not be included in the updated appraisal, as the same capacity increase could
potentially be achieved through significantly cheaper works at Colwich Junction (taking into account Network Rail’s
planned intervention at Norton Bridge).
Secondly, Network Rail’s report indicated that, particularly in the light of the Government’s decision to take forward
the Ordsall Chord scheme in Manchester, the interventions at Manchester Piccadilly and Ardwick would not be
required to deliver the service specification proposed.
As well as removing the costs of these projects, the removal of these schemes also means that some journey
time savings would not be deliverable. Therefore, in replacing the full Stafford by-pass scheme with Colwich and
in removing the Ardwick scheme, it has been necessary to also remove the 2.5 minutes saving in journey time
on trains between Crewe and Colwich not calling at Stafford and the 1 minute saving between Stockport and
Manchester. A 1.5 minutes saving on Manchester trains via Stoke has been retained.
The component schemes for RP2 (and RP2A), therefore, are now:
• Grade separation at Colwich junction (in place of Stafford by-pass and in addition to the current Network Rail
  scheme at Norton Bridge);
• Grade separation between Cheddington and Leighton Buzzard;
• Additional infrastructure at Euston Station;
• 4-tracking Attleborough - Brinklow (including freight capacity works at Nuneaton);
• Northampton area speed improvements; and
• 4-tracking Beechwood Tunnel – Stechford.
In summary, in this update, RP2 and RP2A, now exclude the proposal to build 3 extra platforms at Manchester
Piccadilly (with grade-separation at Ardwick), and instead of the full Stafford scheme a lower cost alternative of
Colwich Junction grade separation and cut-off line only is proposed.

2.3.2.2 Package Deliverables
RP2 (and RP2A) assumes that the train service frequency on the WCML “fast” lines is increased as far as practically
possible without needing to provide six tracks north of Watford Junction. The maximum is assumed to be 16 trains
per hour (tph) over the busiest section of the WCML: Euston – Ledburn Junction (just south of Leighton Buzzard),
with the following service specification in a standard hour timetable:
•   Euston - Manchester: 4tph “fasts”;
•   Euston – Birmingham: 4tph “fasts”;
•   Euston – Liverpool: 3tph “fasts” trains every 2 hours;
•   Euston – Glasgow: 3tph “fasts” trains every 2 hours;
•   Euston – Chester/North Wales 1tph calling stations on the Trent Valley;
•   Euston – Milton Keynes - Northampton – Rugby: 4tph “fasts”:
•   2 tph extended to Birmingham New Street;
•   1 tph terminating at Rugby; and
•   1 tph extended to serve stations along the Trent Valley route.

6
High Speed Rail Strategic Alternatives Study – Update Following Consultation

In both RP2 and RP2A, there is no difference in the level of train service provision proposed for the “peak” and
the “off-peak” hours. This is to ensure that the capacity of WCML is utilised as effectively as possible given the
significant investment proposed. No changes to fares levels or structures have been assumed, although it is
recognised that a shift to a more sophisticated fare regime may help deal with some specific examples of crowding.
The slow line service specification under RP2 is the same as today.

2.3.3 The 51M Proposition
2.3.3.1 The Intervention Package
In response to the consultation, a grouping of local authorities along the proposed route of HS2 has produced
their own alternative proposition. This proposition is based on RP2. It includes the infrastructure proposed in the
original RP2 with the exception of four-tracking of the “Coventry” corridor, the extra platforms at Manchester
and grade separation at Ardwick, and the additional platforms at Euston. It is based on 12 car Pendolino trains
operating slightly fewer trains per hour over the course of the day but with a greater proportion of the services in
the peak hour. It was the most developed of the alternative proposals received by DfT during consultation, and was
supported in its development by a consortium of stakeholders. It was therefore tested in this update.
A number of infrastructure enhancements are proposed by 51M to support the overall increase in services.
•   Grade separation of Ledburn Junction;
•   Construction of a fourth line between Attleborough Junction and Brinklow Junction;
•   Northampton line speed improvements and
•   Stafford by-pass (full scheme).
The enhancements are also assumed to include platform lengthening as required to facilitate 12 car operation, and
some additional electrification required to deliver the service specification proposed.
Key to the 51M proposal is an increase in long distance capacity on the WCML by lengthening the Class 390
train sets to 12-car formation (with the exception of those to Liverpool Lime Street, which remain at 11-cars),
reconfiguring one first class carriage to standard class and running additional peak long distance services.
The 51M proposal also involves providing additional capacity to outer suburban stations on the WCML by running
four fast line services per hour on the Northampton route. There is a new service pattern proposed on the slow
lines between London Euston and Rugby, with one fewer train than today into Euston due to a service being
diverted to Clapham Junction.

2.3.3.2 Package Deliverables
51M proposed a modified timetable. The peak hour timetable is as follows:
•   Euston - Manchester: 3tph “fasts;
•   Euston - Manchester: 1tph Trent Valley “semi-fast”;
•   Euston – Birmingham: 3tph “fasts”;
•   Euston – Liverpool: 2tph “fasts”;
•   Euston – Glasgow: 1tph;
•   Euston – Preston – Oxenholme/Windermere or Blackpool: 1tph;
•   Euston – N.Wales; and
•   Euston – Milton Keynes - Northampton: 4tph (semi-fast) of which 2tph are extended via Rugby – Birmingham.
The text of the 51M document submitted to the HS2 consultation refers to a different off-peak pattern, but does
not specify what this is. For modelling purposes, therefore, it was assumed that the entire peak service would
operate except:
• Euston – Liverpool: only 1tph “fast”; and
• Euston - Manchester: 2tph “fasts; with the extra 1tph semi-fast still operating.
The slow line service pattern under the 51M proposal includes one fewer commuter train per hour out of Euston
compared to today. The slow line specification for 51M is as follows:
•   London Euston to Watford Junction: all stations 2tph;
•   London Euston to Tring: 2tph with one semi-fast service;
•   London Euston to Milton Keynes: 1tph calling at most intermediate stations;
•   London Euston to Northampton: 1tph; and,
•   A Milton Keynes to Clapham service: 2 tph

                                                                                                                     7
High Speed Rail Strategic Alternatives Study – Update Following Consultation

2.3.4 Summary of Journey Time Impacts
2.3.4.1 RP2, RP2A and 51M
In the original Strategic Alternatives study RWA Rail, a transport consultancy, were commissioned to model journey
times for each proposed train service. These form the basis of the journey times modelled going forward. RP2
(and 51M) do not typically increase the existing line speeds, except at Northampton. However, some small speed
improvements are delivered through three types of intervention.
• Firstly, certain of the infrastructure enhancements that are required to deliver additional capacity are also
  capable of delivering journey time reductions through line speed improvements, such as at Northampton;
• Secondly, the enhanced infrastructure and the extra capacity generated enable a reduction in the time allowed
  within current timetables for recovery from delays at key locations, such as from providing conflict free
  movement across the grade separated junction proposed between Cheddington and Leighton Buzzard.
• Thirdly, some of the indicative train service specifications are based on having a higher train frequency which has
  been used to reduce the average typical number of stops per train. This has typically improved journey times for
  through passengers by up to four/ five minutes per stop omitted, such as in package 2, where some London –
  Birmingham New Street “fast” trains are assumed to run non-stop to Birmingham International.
Most of the journey time benefits do not result from reductions in the point to point running time as detailed
above. Most of the reductions in end to end journey time result from the increased frequency of the “fast” services
and thus allowing them to have fewer intermediate stops.
However, in this update in replacing the full Stafford by-pass scheme with the Colwich scheme and in removing the
Ardwick scheme, it has been necessary to also remove the 2.5 minutes saving in journey time on trains between
Crewe and Colwich not calling at Stafford and the 1 minute saving between Stockport and Manchester. The 1.5
minutes saving on Manchester trains via Stoke has been retained.
The table below gives an illustration of some typical inter-urban journey times between some of the major cities on
the WCML, and thus the time savings which could arise from the interventions. Please note that the times quoted
(including the Do Minimum times) are average times of Inter-city services (except where via Northampton). It should
be noted that the journey times between the major cities vary depending on the stopping patterns and routing
assumed. The table below is not comprehensive. Other city pair route choices are not shown, and in some of these
cases 51M package offers the fastest journey times.
Table 2.1 – Typical Modelled Average Journey Time Impacts (in minutes)

                                                     Do Minimum
            Rail Service Group                                                 Package 2           Package 2A   51M
                                                     Journey Time
    London – Birmingham New St                            85                        73                  75       80
        London – Manchester                              129                       124                 127      127
         London – Liverpool                              132                       126                 128      123
      London – Birmingham via
                                                             127                    96                 99       107
           Northampton
Network Rail were asked by DfT to review the journey assumptions in the original Strategic Alternatives Report.
They state:
‘The analysis undertaken confirms that the timings assumed by RP2 seem appropriate. The journey time savings
assumed by RP2 appear to be predominantly delivered through removal of station calls, for example, two of the
three station calls are removed from the London Euston – Birmingham New Street service. The journey time savings
are also reliant on the procurement of higher performing rolling stock as suggested by RP2’.
Network Rail also raised a concern regarding the removal of timetabling allowances proposed in RP2, noting that
they “would not support the removal of performance allowance in the timetable without evidence to quantify
the performance of the RP2 proposal.” For the purposes of this update, Atkins has agreed with the Department
for Transport that the previous approach of testing RP2 both with and without performance allowances should
be maintained.
51M produced their own set of timings for their service. These timings and the service specification were for
the peak operation in the “down” direction only (i.e. away from London). For the purposes of modelling, Atkins
has constructed an off-peak service specification. In this, the numbers of peak services are reduced by two. The
Liverpool trains (the lightest loaded intercity services) are reduced to only one per hour and the Manchester trains
reduced to three per hour only (from four). Network Rail has reviewed the timings proposed and state that ‘the
analysis undertaken confirms that the timings assumed by 51M seem appropriate’. Despite this, some minor
alterations (up and down) were made to ensure consistency between the reference case, RP2, RP2A and 51M.

8
High Speed Rail Strategic Alternatives Study – Update Following Consultation

2.4 ‘Y’ Network Strategic Alternatives
2.4.1 The Alternatives
The Strategic Alternatives to the ‘Y’ network were developed by a DfT Working Group and were then modelled by
Atkins in the February 2011 study.
This section outlines the strategic rail interventions identified as potential alternatives to the proposed ‘Y’ high
speed rail network between London and Manchester and Leeds. Due to the geographic scale of HS2, few
alternative interventions would be able, on their own, to deliver an equivalent level of functionality, whether in
terms of journey time improvements or capacity enhancements. It was therefore considered more appropriate to
consider packages of interventions.
A total of three packages were developed as alternatives, known as Scenarios A, B and C. Scenario A was
concerned only with extending the length of existing services. Scenario B was concerned with increasing passenger
capacity and frequency through infrastructure upgrades, whilst Scenario C built upon Scenario B, and included
additional schemes to reduce journey times.
The results of the previous study suggested that Scenario B had the highest BCR. The update following consultation
has therefore focused on the reassessment of Scenario B. Following consultation with DfT further consideration of
Scenarios A and C was deemed to be unnecessary.
The remainder of this section describes the rail interventions identified in terms of the overall theme of the package
and the individual works which would lie behind the theme. The outputs from each of the packages are then
described, in terms of service frequency and journey times.

2.4.2 Scenario B
2.4.2.1 Intervention Package Components
The individual interventions assumed to be required to deliver Scenario B are shown in the following table. Note
that the interventions for the West Coast Mainline are the same as for the updated RP2 and RP2A as described in
the previous section.
Table 2.2 – Scenario B Intervention Components

   Package                                                 Components
                   Infrastructure enhancements on the Midland Main Line include:
            • Electrification from Bedford to Sheffield;
  Midland • Freight loop facility between London and Bedford;
  Main Line • Re-instatement of 4-tracks between Bedford and Kettering;
            • Re-instatement of 2-tracks between Kettering and Corby;
            • Station area re-modelling at Corby;
            • Re-modelling and 4-tracking in the Leicester area; and,
            • Electrification and increased stabling capacity at depots.
                   Infrastructure enhancements on the East Coast Main Line include:
            •          Kings Cross: Throat re-modelling. Re-instatement of a third tunnel and 6-track approach;
            •          4-tracking Digswell – Woolmer Green;
            •          4-tracking Huntingdon – Peterborough
            •          Peterborough area works: Werrington Flyover;
            •          4-tracking Stoke Junction – Doncaster;
            •          Newark – provide flyover for Nottingham to Lincoln route;
 East Coast •          Retford – works to address low speed turnouts and restrictive signalling;
  Mainline •           Electrify and upgrade Retford – Sheffield;
            •          Re-modelling and extra platforms at Doncaster;
            •          Electrification of Hambleton Junction to Leeds;
            •          Platform capacity enhancements at Leeds;
            •          York – re-modelling and grade-separation at Skelton Bridge Junction;
            •          Darlington – headway/station layout enhancements;
            •          Darlington – Newcastle: re-instate and electrify Leamside line;
            •          Extra capacity at depots;
            •          Power supply strengthening for overhead line equipment.

                                                                                                                                9
High Speed Rail Strategic Alternatives Study – Update Following Consultation

     Package                                         Components
            • Replacing the existing outer suburban rolling stock with 390s (i.e. on those services that use the
              “fast” lines”)
            • Grade separation at Colwich;
 West Coast • Grade-separation between Cheddington and Leighton Buzzard;
  Mainline • 3 new platforms at Euston Station;
            • 4-tracking Attleborough – Brinklow (including freight capacity works at Nuneaton)
            • Small-scale area speed improvements around Northampton; and
            • 4-tracking Beechwood Tunnel to Stechford (“Coventry corridor”).

2.4.2.2 Scenario B Deliverables
An outline description of what Scenario B is intended to deliver is described below. The deliverables are unchanged
from the previous report.
Midland Main Line
Scenario B assumes a higher service frequency with electrification of the MML. An 8tph timetable is provided North
of Bedford with the following assumed service specification:
•    St Pancras – Derby – Sheffield: 2tph (fast between London and Leicester);
•    St Pancras – Nottingham: 2tph (fast between London and Leicester);
•    St Pancras – Leicester: 2tph (calling at intermediate stations);
•    St Pancras – Corby: 2tph (calling at intermediate stations).
East Coast Main Line
Scenario B assumes a higher frequency long distance timetable on the ECML. A 10tph timetable is provided, with
all rolling stock comprised of 10 car 125mph IEP sets. The assumed service specification is:
•    London – Leeds: 3tph (1tph via Hambleton);
•    London – Newcastle: 4tph (with 2 tph extended to Edinburgh, and some services beyond);
•    London – Sheffield: 2tph;
•    London – Hull / Lincoln: 1tph (alternating).
West Coast Main Line
Scenario B assumes a higher frequency long distance timetable on the WCML as per Rail Package 2 (and 2A):
•    Euston - Manchester: 4tph “fasts”;
•    Euston – Birmingham: 4tph “fasts”;
•    Euston – Liverpool: 3 “fast” trains every 2 hours;
•    Euston – Glasgow: 3 “fast” trains every 2 hours;
•    Euston – Chester/North Wales 1tph calling stations on the Trent Valley;
•    Euston – Milton Keynes - Northampton – Rugby: 4tph “fasts”:
•    2tph extended to Birmingham New Street;
•    1tph terminating at Rugby; and
•    1tph extended to serve stations along the Trent Valley route.
As part of their review of Scenario B, Network Rail stated that further interventions may be needed to deliver
the assumed train service specifications. Conversely, feedback from the HS2 Consultation process questioned
whether there was scope for optimisation of Scenario B. For the purposes of this update, the scheme has been
appraised on the basis that it was previously specified. This provides a point of comparison with the appraisal
previously undertaken.

10
High Speed Rail Strategic Alternatives Study – Update Following Consultation
2.4.3 Summary of Journey Time Impacts
Scenario B is designed to deliver journey time improvements between the key cities as well as capacity
enhancements. The journey times on the ECML and the MML were estimated by the DfT and modelled by Atkins.
The journey times on the WCML routes were calculated and modelled by Atkins and were based on RP2A. The
table below gives an illustration of typical journey times between some of the major cities, based on average times
of the inter-city services, and thus gives an indication of the savings which could arise from the interventions. It
should be noted that there are a variety of train times between each of these city pairs, depending on the stopping
patterns of each service, so the times below are only illustrative.
Table 2.3 – Typical Journey Time Impacts (in minutes)
Rail Service Group Do Minimum Journey Time Scenario B
London – Birmingham New St 85 75
London – Manchester 129 127
London – Nottingham 110 93
London - Sheffield 140 112
London – Leeds 131 121
In the current refresh, it is assumed that the operations in the Do Minimum on the MML and ECML make less use
of IEP rolling stock, so the journey times have extended between London and Leeds and Sheffield.
11High Speed Rail Strategic Alternatives Study – Update Following Consultation 3 Demand Forecasting 3.1 Introduction The packages were assessed using the PLANET suite of models, which had been further developed specifically for the HS2 Ltd study. The HS2 Ltd models have been used to ensure consistency between the appraisal of the proposed high speed rail routes and the identified rail alternative packages. The demand forecasting work described in this chapter has been undertaken using the HS2 modelling framework. This framework contains an all day demand model, so the utilisation rates quoted refer to the amount of passengers against the seated capacity over the course of a day. The approach taken, by averaging out congestion over the whole day, does not give an accurate reflection of the utilisation at peak hours As part of their review, Network Rail examined the impact of the forecast levels of demand on utilisation rates at the busiest times of day. In addition, this analysis, based on the MOIRA model, differentiates between service types and estimates the spread of passenger loads over the different types of service. The results of this work, which indicates high levels of crowding on suburban services under all scenarios is set out in Network Rail’s report. 3.2 Future Year Baseline 3.2.1 Introduction The first step in forecasting the demand for the alternative interventions is to construct a future year scenario, against which the alternatives can be assessed. In line with the HS2 Ltd work on the proposed ‘Y’ network, two future year horizons have been examined: 2021 and 2037. The construction of future year models represent a Do-Minimum scenario, and the elements of supply and demand that make up this scenario are described in the remainder of this section. 3.2.2 Supply Committed, or likely to be committed, rail schemes were taken directly from the HS2 Ltd study. These were derived from a number of published sources including the Network Rail Strategic Business Plan, and the TfL Business Plan. Advice on the ‘Do Minimum’ timetable for the West Coast was provided by the Department. For the committed Thameslink and Crossrail projects, and for the IEP Programme which the Department has continued to take forward, the timetable and capacity enhancements included within the DfT’s Network Modelling Framework (NMF) to 2019 were used. No additional uncommitted schemes were incorporated into the models beyond 2019, such that the future year rail networks are assumed to be consistent between 2021 and 2037. Consistent with the approach taken by HS2 Ltd, a number of schemes were identified for inclusion in the Future Year Do Minimum scenarios. Of particular interest to this study are the following schemes: • West Coast Main Line – some of the nine-car Class 390 units lengthened to eleven-cars; • East Coast Main Line – Inter-City Express Programme and Thameslink Programme capacity increases with new rolling stock; • Midland Main Line – line speed improvements between St Pancras and Sheffield and Thameslink Programme capacity increases with new rolling stock; and, • East Coast Main Line – infrastructure capacity provided by schemes to be delivered by Network Rail in the period to 2014. The Do Minimum scenario constructed is different from that assumed in the March 2011 work. Key differences that have an impact on the current work are as follows: • The March 11 Do Minimum assumed that Birmingham – Scotland services on the WCML would be operated by Class 221/222 Voyagers. The revised Do Minimum now assumes that these services will be operated by 9-car 390 Pendolinos; • Retention of Class 91/Mk 4 sets on the ECML. The Do Minimum in the March 2011 work assumed that the Class 91 fleet would be replaced with IEPs; • Introduction of 110mph suburban WCML services to Milton Keynes and Northampton; • Extension of some existing London - Lancaster services to Glasgow; • Introduction of 10 new off-peak London - Lancaster services; • Ordsall Curve in Manchester is assumed to be constructed; and, • Chiltern Line – Evergreen III. 12
High Speed Rail Strategic Alternatives Study – Update Following Consultation

In the March 2011 Strategic Alternatives work, there were issues with the models converging, particularly with
trips to Scotland. In order to achieve model convergence additional capacity was added to the Do Minimum on
the ECML and WCML for all the scenarios tested. It is understood that a similar exercise was carried out separately
for HS2. These changes were acknowledged in the relevant reports. In this current work, the models achieve
convergence with only the Do Minimum supply schemes in place, so an entirely consistent Do Minimum has been
used across all schemes (including HS2).

3.2.3 Passenger Demand
Future year exogenous (background) rail demand growth is input directly into the PLANET Modelling Suite from a
model called EDGE. This rail demand growth is forecast based on Departmental guidance on the use of the industry
standard Passenger Demand Forecasting Handbook (PDFH), and recent GDP forecasts as used by HS2, which
include the impact of the recession. Fares assumptions remain the same as in the February 2011 analysis. All of
these assumptions are consistent with those used in the current HS2 Ltd modelling.
The decision in the recent Autumn Statement not to proceed with the planned RPI+3% fares increase in 2012 was
taken too late to incorporate into the modelling. It is understood that the impact of this has been examined by HS2
Ltd as part of their sensitivity testing, but a similar exercise has not been carried out for the Strategic Alternatives.
The overall impact of the application of the exogenous growth is given in Table 3.1 below. This forecast is
consistent with that used by HS2 Ltd and shows all of the demand in the models, rather than just the WCML, MML
and ECML demand. Beyond 2037, the demand is capped to be consistent with the HS2 work.
Table 3.1 – Estimated 2037 Rail Demand (total trips per day)

                                                                                                                     % Growth in Trips
              Model                              2010 Trips                           2037 Trips
                                                                                                                      (2010 to 2037)
     PLANET South                                1,657,101                            2,423,673                           46%
    PLANET Midlands                               36,805                               47,445                             29%
  PLANET Long Distance                           1,012,899                            1,462,539                           44%

This shows that strategic demand, as represented in the PLANET Long Distance model, where the inter-urban trips
are considered, is forecast to increase significantly, by approximately 44% between 2010 and 2037. Local demand
increases are still noteworthy, with growth in PLANET Midlands and PLANET South forecast to be 29% and 46%
respectively between 2010 and 2037.
The demand in the models used in the previous Strategic Alternatives update in February 2011, is given in Table 3.2
below, for comparison purposes.
Table 3.2 – Estimated 2043 Rail Demand (total trips per day) – February 2011 Update

                                                                                                                     % Growth in Trips
              Model                              2008 Trips                           2043 Trips
                                                                                                                      (2010 to 2043)
     PLANET South                                1,549,812                            2,408,083                           55%
    PLANET Midlands                                34,436                              49,385                             43%
  PLANET Long Distance                            974,804                             1,562,615                           60%

On the demand side, there are a number of major differences between the models used for the previous Strategic
Alternatives study in February 2011, and this current study. Firstly, the HS2 Ltd model has been rebased to a 2010
model from a 2008 model. This means that the Base Year matrices for this study include the impact of the rapid
growth in trips that followed on from the West Coast Route Modernisation project. This is reflected in the higher
starting point for the demand matrices in the current piece of work. Secondly, the final year for modelling is now
2037, rather than 2043 as previously, and the forecasts now take into account the impact of the recent recession.
These factors result in there being less demand in total at the final model year than previously although PLANET
South’s demand is slightly higher than in the previous exercise.

3.2.4 Rail Issues
In order to determine the forecast implications for both passenger volumes and crowding in the specific London
to Manchester, Sheffield and Leeds corridors, analysis was initially undertaken using the PLANET Long Distance
(PLD) model employed by HS2 Ltd. Crowding is defined as a proportion of the total passenger numbers to seated
capacity. The PLD model is an all day (16 hour) model.
A description of the do-minimum impacts for the three major rail lines under consideration (West Coast Main Line,
Midland Main Line and East Coast Main Line) is given in the remainder of this section. Outputs from the model,
showing all-day demand, are shown in Figure 3.1.

                                                                                                                                         13
High Speed Rail Strategic Alternatives Study – Update Following Consultation
Figure 3.1 – All-Day Demand: 2010 & 2037 Do Minimum Scenarios
14High Speed Rail Strategic Alternatives Study – Update Following Consultation
3.2.4.1 West Coast Main Line
Demand on the WCML long distance services is forecast to increase by approximately 100% up to 2037, with
forecast (two-way) daily passenger volumes on long distance services on the approach to London increasing from
approximately 62,000 to 121,000 trips. This is considerably larger than the average rail growth of 44% shown in
Table 3.1. The PLD model contains a variety of journeys, including a large number of regional rail journeys of less
than 50 miles in length. The PDFH Forecasting methodology employed assumes that longer distance trips grow at
a faster rate than regional rail trips. These longer distance trips are found on the major inter-city rail routes, hence
the growth on the route being much higher than the average for the model as a whole. All day load factors on the
approach to London are forecast to increase from approximately 53% to 83% between 2010 and 2037.
3.2.4.2 Midland Main Line
Demand on the MML long distance services is forecast to increase by approximately 100% up to 2037, with
forecast (two-way) daily passenger volumes south of Leicester increasing from approximately 20,000 to 39,000.
This is again in excess of the average rail growth of 44% in strategic trips shown in Table 3.1. All day load factors
on the approach to London are forecast to increase from approximately 35% to 67%.
3.2.4.3 East Coast Main Line
Demand on the ECML long distance services is forecast to increase by about 130% up to 2037, with forecast
(two-way) daily passenger volumes on long distance services on the section between Peterborough and Stevenage
increasing from approximately 32,000 to 73,000. This is considerably larger than the average long distance rail
growth of 44% highlighted in Table 3.1. All day load factors on the approach to London are forecast to increase
from approximately 46% to 80%.
3.3 Modelling of Rail Packages
3.3.1 Introduction
The timetables associated with the packages were coded into the PLANET model and run for the years 2021
and 2037.
This section shows the change in demand associated with the packages, and then highlights the impact of the
packages on capacity and crowding on the major routes under consideration.
3.3.2 London - West Midlands Strategic Alternatives
3.3.2.1 Impact on Demand
Table 3.3 shows total additional rail trips that are estimated to occur as a result of the proposed rail interventions
for the 2037 forecast year, compared to the Do Minimum.
Table 3.3 – Estimated 2037 Modal Transfer & Rail Trip Generation (total trips per day)
Modal Transfer Modal Transfer Generated Total Additional
from Air from Highway Rail Trips Rail Trips
Package 2 1,956 4,775 19,444 26,175
Package 2A 1,764 4,490 17,685 23,939
Package 51M 2,039 3,433 16,096 21,568
The table above shows that the three WCML packages are all forecast to generate additional demand on the
WCML. RP2 is forecast to result in the most trips being generated, with the difference between RP2 and RP2A a
result of the slightly longer journey times in RP2A.
The number of trips forecast to be generated as a result of the interventions can be examined against the
equivalent figures for the February 2011 update. These are shown in the table below.
Table 3.4 – Estimated 2043 Modal Transfer & Rail Trip Generation (trips per day) – February 2011 Update
Modal Transfer Modal Transfer Generated Rail Total Additional
from Air from Highway Trips Rail Trips
Package 2 2,166 3,219 11,607 16,993
Package 2A 1,755 2,799 10.101 14,655
15High Speed Rail Strategic Alternatives Study – Update Following Consultation
Comparison of Tables 3.3 and 3.4 shows that RP2 is forecast to attract an additional 9,000 rail trips, of which
approximately 8,000 trips will be newly generated rail trips, in the new work. Examination of the origins of these
additional trips suggests that they are primarily generated between London and North West England, and also
between London and the West Midlands. There are three reasons for this:
• The starting demand on the WCML in the models in this current update is higher than in the February 2011
work as the demand impact of the West Coast Route Modernisation Programme is now included. This means
that there is likely to be more crowding at an earlier stage on the WCML, and thus more crowding relief from
the additional capacity and therefore some suppressed demand is released;
• There is a slightly slower average journey time to Manchester in the current Do Minimum model, which will
result in the schemes generating more trips as they will be relatively faster than before; and,
• There are generally fewer seats on the WCML south of Manchester in the current model, due to the fact that it
has not been necessary to add any additional capacity to address convergence issues in the new Do Minimum.
This results in more crowding in the Do Minimum, and thus comparatively more crowding relief with the
introduction of the packages. This is by far the most important cause of the additional demand that is forecast
to result.
3.3.2.2 Summary of Capacity and Crowding Impacts
As a result of assessing each of the packages in the PLANET demand model, forecast additional capacity and
crowding levels were obtained on long distance WCML services to and from London. A summary of the impact on
capacity at a point approaching London is given in Table 3.5 below.
Table 3.5 – Forecast Capacity and Crowding Impacts, 2037
Long distance seated WCML 2037 load factor
% Increase in seated
capacity (16 hour two approaching London
Rail Package capacity over Do Minimum
way) to/from London (16 hour two way)
WCML
WCML (% seats)
Do Minimum 144,795 n/a 83%
Package 2 222,080 53% 60%
Package 2A 222,080 53% 59%
Package 51M 221,434 53% 64%
Both 51M and RP2 provide additional long distance passenger capacity on the WCML route in the region of 53%
of seated capacity to and from London. This level of additional seating then has a major impact on the all day load
factor on the WCML, with daily crowding forecast to reduce from 83% in the Do Minimum to around 60% in the
three alternatives.
3.3.3 ‘Y Network’ Strategic Alternatives
3.3.3.1 Impact on Demand
The 2037 total modal transfer and the number of generated rail trips that are estimated to occur as a result of the
proposed rail interventions, is summarised in Table 3.6 below.
Table 3.6 – Estimated 2037 Modal Transfer & Rail Trip Generation (total trips per day)
Modal Transfer Modal Transfer Generated Rail Total Additional
from Air from Highway Trips Rail Trips
Scenario B 4,986 9,141 36,383 50,510
Table 3.6 shows that the introduction of Scenario B is likely to result in an additional 50,000 trips per day occurring
on the long distance rail network. It is worth noting that given that Scenario B incorporates Rail Package 2A, that
approximately half of these additional trips will occur on the WCML, as shown in Table 3.3.
The number of trips forecast to be generated as a result of the interventions can be examined against the
equivalent figures for the February 2011 update. These are shown in the table below.
16High Speed Rail Strategic Alternatives Study – Update Following Consultation
Table 3.7 – Estimated 2043 Modal Transfer & Rail Trip Generation (total trips per day) – February 2011 Update
Modal Transfer Modal Transfer Generated Rail Total Additional
from Air from Highway Trips Rail Trips
Scenario B 6,023 6,084 24,320 36,427
Comparison of Tables 3.6 and 3.7 shows that Scenario B is forecast to attract an additional 14,000 rail trips
between the March 2011 and the current update. Given that Scenario B incorporates RP2A, then it is apparent that
the majority of these additional trips are occurring on the WCML. The reasons for this have been examined earlier.
The source of the remainder of the additional trips is less apparent, with pockets of additional demand throughout
the route of the ECML. These are likely to be as a result of the changes in the Do Minimum timetable on the ECML.
3.3.3.2 Summary of Capacity and Crowding Impacts
As a result of assessing each of the packages in the PLANET demand model, forecast additional capacity and
crowding levels on the three long distance routes (West Coast Main Line, Midland Main Line and East Coast Main
Line) to and from London were obtained. The long distance WCML services intervention in Scenario B is the same
as for Rail Package 2A described earlier in the section. A summary of the impact on capacity and crowding is
given in Tables 3.8 and 3.9 below, for the Midland Main Line and the East Coast Main Line respectively, at points
approaching London.
Table 3.8 – Forecast Capacity and Crowding Impacts, 2037 – Midland Main Line
Long distance seated MML 2037 load factor
% Increase in seated
capacity (16 hour two way) approaching London
Rail Package capacity over Do Minimum
to/from London (16 hour two way)
MML
MML (% seats)
Do Minimum 60,588 n/a 67%
Scenario B 141,240 133% 35%
Table 3.9 – Forecast Capacity and Crowding Impacts, 2037 – East Coast Main Line
Long distance seated ECML 2037 load factor
% Increase in seated
capacity (16 hour two approaching London
Rail Package capacity over Do Minimum
way) to/from London (16 hour two way)
ECML
ECML (% seats)
Do Minimum 87,670 n/a 80%
Scenario B 187,436 114% 48%
Tables 3.8 and 3.9 show that the implementation of Scenario B provides a large amount of additional seats on the
two major inter-city lines, with resultant load factors on the MML at 35%, down from 67% in the Do Minimum
situation, and on the ECML at 48%, down from 80% in the Do Minimum situation.
It is worth noting that the number of seats provided by Scenario B in this update is slightly higher than in the
February 2011 Update. Whilst, the infrastructure schemes remain the same there has been a change in the number
of seats provided in the IEP Rolling Stock which is assumed to run on these two lines. The seating capacity on a
standard 10-car IEP is now assumed to be 660 passengers compared to the 639 passengers in the previous update.
Any further changes in the assumed capacity of IEP would be expected to impact on package BCRs.
17High Speed Rail Strategic Alternatives Study – Update Following Consultation 4 Capital and Operating Costs 4.1 Introduction The estimated costs of the packages are detailed in this section to inform the economic appraisal. These costs are at an order of magnitude level due to the early stage of development of the interventions. 4.2 Capital Costs 4.2.1 Methodology The capital cost estimates have been prepared by cost consultants, Faithful and Gould, who are part of the Atkins group of companies. The high level capital cost estimates presented have been developed using a model containing a series of high level unit rates, consistent with those used by HS2 Ltd, to determine the costs for each location within each package. The unit rates are grouped into the main elements of work, namely: • Trackwork alterations and new work including renewals, realignment of track and turn outs, and provision of new track, grade-separated crossing or loops; • Structural alterations to bridges, viaducts, tunnels, roads, etc. • Signalling alterations including reconfiguring, repositioning and associated work including telecoms; • Power and electrification alterations to suit, including realignment, plus new power requirements as appropriate; and, • Platform extensions, alterations and associated and consequential work. To the base costs a series of percentage additions have been applied for management and project on-costs to arrive at a total ‘all in’ scheme cost per location. These location costs have then been summarised into a cost per package. In preparing cost estimates, a benchmarking exercise has been carried out in tandem to validate the unit rates, with the outturn costs of other comparable route improvement schemes. 4.2.2 Estimate Parameters To determine the work necessary at each location to accommodate that particular package, workshops were held with DfT. For each package, the extent of work was determined, broken down into the following key elements of work: • Trackwork; • Structures; • Electrification (Traction Power Systems); • Signalling, telecoms and control systems; • Buildings, including platforms; • Other electrical and mechanical systems; and, • Contractors’ preliminaries and other project on-costs. • Other electrical and mechanical systems; and, • Contractors’ preliminaries and other project on-costs. Beneath this level, the main components of the physical works associated with the scheme itself are broken down. The elements listed above are then linked to a unit rates file, and quantified to produce an overall base construction cost. The template established also makes provision for the addition of other indirect costs associated with the management and execution of the works, namely: • The cost of procuring or leasing land, as necessary, for either the permanent works or temporary requirements; • Ancillary costs, including environmental works and landscaping; • Provision of main power substations and enhancements to the national grid (as considered necessary); • Design, Project Management and other fees, during implementation; and, • Optimism Bias. 18
High Speed Rail Strategic Alternatives Study – Update Following Consultation

At this stage, the majority of the items listed above have been determined on the basis of an applied percentage.
Of these, the largest item is Optimism Bias, which has been applied at 66% of the overall costs, to reflect this
early stage in the project development. This is consistent with HM Treasury’s Green Book guidance and with the
Department’s WebTAG guidance.

4.2.3 Estimate Exclusions
Whilst at this stage of the project development there remain a number of gaps in the information necessary to
populate the capital cost in detail in all areas, we have endeavoured to make the estimate as complete as possible,
minimising the number of excluded items. Those exclusions that do remain are detailed below:
•   Potential property development, income or resale value;
•   Local taxes;
•   Development costs expended by the client to date;
•   Costs associated with the client team including its duties, accommodation and services;
•   Financing charges associated with borrowing or raising funds; and
•   Future inflation to the implementation phase (costs are based at Average 2011 prices).
In the original Strategic Alternatives work, the costs for the scheme for Stafford was provided by DfT. In this update,
the Colwich alternative has not been costed in detail. Instead, a comparative assessment was made by Atkins
and DfT.

4.2.4 Estimate Assumptions
At this stage of the scheme development a number of high level assumptions have had to be made with regard to
estimate content, both in terms of quantities of work and the rates applied to them. These can be summarised as
follows, and should also be read in conjunction with the estimate exclusions detailed above:
• All construction, maintenance and renewal prices are based at a common base date of an average 2011 price;
• No consideration has been taken for any costs effect in programming and procurement arrangements
  and planning;
• Track work by location has been determined by desk top studies;
• The related structural works have been assumed to be kept to the minimum;
• Signalling works are assumed to be kept to a minimum and relate to moving and repositioning only, without
  major area reconfiguration or central control alteration;
• It is assumed that existing power supplies will need upgrading for the new infrastructure. These were assumed
  at 10% of the construction cost of the packages, including optimism bias;
• A further allowance of 10% of the construction cost was added to each package to account for other potential
  works on the WCML necessary to mitigate risks to operational performance arising from the high level of
  capacity utilisation proposed;
• An allowance for planned disruption of 10% of the construction cost was also added to each package. Note
  that in their review of the Strategic Alternatives, Network Rail have suggested that this allowance may be
  understated; and
• No costs have been assumed for unplanned disruption although experience with the West Coast Route
  Modernisation project and other schemes shows that this represents a significant risk. Over the Christmas /
  New Year period in 2008, works at Rugby over-ran by 2 days leading to severe disruption to passengers and
  freight customers.
If the schemes are progressed, and the estimates are developed further, then these assumptions will be challenged
and addressed, although it is likely that a number of more detailed assumptions will still be required.

4.2.5 Capital Cost Estimate
The detailed capital cost estimate is given in Appendix A, broken down by package. A summary of the total
capital cost of the alternatives are given in Table 4.1 below. This also includes the equivalent capital cost used in the
March 2011 Update work. Please note that the March 11 costs are higher than previously reported as they have
been uplifted to from 2009 prices to 2011 prices to enable direct comparison with the current cost estimate.
Table 4.1 – Capital Costs of Interventions (excluding rolling stock) (£ millions, average 2011)

               Package                         Total Cost (Current Update)                        Total Cost (March 2011)
              Package 2                                    2,551                                           3,837
             Package 2A                                    2,551                                           3,837
                 51M                                       2,600                                             n/a
             Scenario B                                   12,439                                          13,873

                                                                                                                                 19
You can also read