Getting on an Efficient Decarbonization Track - An Economic Study of a Regional Approach to Electricity Markets in Northeastern North America ...

 
CONTINUE READING
Getting on an Efficient Decarbonization Track - An Economic Study of a Regional Approach to Electricity Markets in Northeastern North America ...
Getting on an Efficient
Decarbonization Track
An Economic Study of a Regional Approach to
Electricity Markets in Northeastern North America
Getting on an Efficient Decarbonization Track - An Economic Study of a Regional Approach to Electricity Markets in Northeastern North America ...
A MESSAGE FROM
          CANADA GRID
          Canada Grid is very pleased to release this report by Pierre-Olivier Pineau and Aïssatou Ba of HEC
          Montréal, which highlights the positive economic impacts of grid integration in the Canadian-American
          northeast, or what we call the ‘East Grid’ zone. This report is the first in a series of documents that will
          explore the who, what, when, where and why of growing and greening the power grid across Canada.

          Canadians are already electrically connected from the Atlantic to the Pacific, but interconnection
          capacity between provinces varies greatly across the country. We are much more highly interconnected
          with our American neighbours. We know definitively that the fight against climate change will compel
          us to dramatically increase the use of electricity in our society, creating a tremendous opportunity to
          increase clean power trade between the provinces and across the border with our American partners.
          Despite this imperative, decision-making around the grid remains siloed. We simply do not govern or
          plan the grid as though it is a shared tool. This harms the collective economic and environmental well-
          being of North Americans.

          Canada Grid was formed by The Transition Accelerator and a growing coalition of corporate, civil
          society and labour allies to provide independent thought leadership around the pivotal issue of power
          grid integration. A science-based organization, The Transition Accelerator mobilizes diverse actors to
          advance ambitious work at the political, commercial, and social levels that will transform our society
          into a competitive clean energy economy. The grid is vast and complex, it lacks a natural constituency
          and is therefore the ideal realm to apply The Transition Accelerator’s unique methodology that seeks
          to move from critical analysis to practical action. Influenced by similar coalitions in the United States
          and Europe, Canada Grid is building a broad-based movement to support infrastructure development,
          good-paying jobs for workers, and a just energy transition for all Canadians. This report furthers the
          overwhelming scientific, technical, and economic support for grid integration, and supports our turn
          from research to consensus-building and action.

          Pierre-Olivier Pineau holds the Chair in Energy Sector Management at HEC Montréal, is a Fellow of The
          Transition Accelerator and is a member of Canada Grid’s management board. We would like to thank him
          and his colleague, Aïssatou Ba, for this important contribution to our understanding of the topic.

                                  Philip Martin Duguay
                                  Managing Director, Canada Grid
                                  The Transition Accelerator

EAST GRID: GETTING ON AN EFFICIENT DECARBONIZATION TRACK                                                                 2
Getting on an Efficient Decarbonization Track - An Economic Study of a Regional Approach to Electricity Markets in Northeastern North America ...
EXECUTIVE SUMMARY
  The climate crisis and the related need to drastically reduce greenhouse gas (GHG) emissions call for a quick
  decarbonization of the power sector and for the electrification of many energy end-uses. The states and
  provinces in northeastern North America share similar decarbonization goals. There is however no official
  plan to integrate balkanised electricity markets in this region. Such an initiative would however reduce both
  the need for additional production capacity and total system costs.

  This report’s objective is to quantify the economic benefits   storage needs to balance supply and demand. Québec and
  of creating better intertie capacity between electricity       Labrador hydropower storage, with a combined reservoirs
  markets in northeastern North America. The benefits of         capacity of more than 200 TWh, plays a central role in
  better interconnecting northeastern electricity markets        these results. Ontario and the Atlantic provinces are also
  are significant in nature, but not widely acknowledged.        well positioned to gain from deeper integration, both from
  Many decarbonization studies ignore integration, which is      cost reductions and trading opportunities.
  problematic when game-changing hydropower reservoirs
                                                                 KEY TAKEAWAYS
  could be used to help reduce the cost of integrating large
  amounts of intermittent renewable capacity.                    1.   Energy efficiency should be prioritized, to limit load

  Our results show that new renewable capacity                        growth, as otherwise total system costs surge.

  requirements fall with new interties. While there are          2. The benefits of collaboration are more than monetary.
  currently about 180 GW of installed capacity in New York,           New interties reduce the amount of additional capacity
  New England, Ontario, Québec, and the Atlantic provinces,           (and lower ecological impacts from new greenfield
  199 GW of additional renewable generation would have to             developments) and tend to reduce price volatility.
  be installed to fully decarbonize, under a moderate load
  growth scenario (1.5x the 2018 load, with a new winter         3. Obstacles to collaboration are multiple – transfer

  peaking demand), if more transmission interties can be              payments/cost allocation principles must be well

  built. If no more interconnections are possible, 214 GW             designed. As not all sub-regions benefit equally from

  would be necessary. Under a high load growth scenario               additional interconnections, and as producers and

  (2.5x), it’s a phenomenal 348 GW of additional capacity             consumers within each sub-region also face different

  that would be avoided with more regional interconnections:          outcomes, some compensation mechanisms will have

  688 GW of new capacity, instead of 1,036 GW. Of course,             to be developed to overcome resistance to change.

  total system costs would also be lower with such regional
                                                                 Results from this report were derived from conservative
  integration, as well as average energy prices.
                                                                 estimates, as interconnection costs used in the study are in
  The main economic beneficiaries of these increased             the higher range and no reserve capacity requirement has
  interconnections are New York and New England. As              been included. Such a requirement would boost the value
  they start with the highest amount of gas-fired generating     of interconnections, as they provide the ability of sharing
  capacity, they have the most capacity to replace with          reserves. Our results are also robust to various assumptions
  intermittent renewable units, and therefore the largest        on transmission, storage, wind and solar costs.

EAST GRID: GETTING ON AN EFFICIENT DECARBONIZATION TRACK                                                                        3
Getting on an Efficient Decarbonization Track - An Economic Study of a Regional Approach to Electricity Markets in Northeastern North America ...
RÉSEAU CANADA GRID ACKNOWLEDGES THAT THE LANDS WE INHABIT
                   ARE TRADITIONAL TERRITORIES OF INDIGENOUS PEOPLES.

                   We seek to act on the Truth and Reconciliation Commission’s 94 Calls to Action
                   and commit to educating ourselves, and applying the United Nations Declaration
                   on the Rights of Indigenous Peoples (UNDRIP) as a framework for reconciliation
                   that will inform our principles, norms, policy and core operational activities.

                                                                                      native-land.ca

EAST GRID: GETTING ON AN EFFICIENT DECARBONIZATION TRACK                                               4
Getting on an Efficient Decarbonization Track - An Economic Study of a Regional Approach to Electricity Markets in Northeastern North America ...
CONTENTS

          A MESSAGE FROM CANADA GRID                                                                                            2
          EXECUTIVE SUMMARY                                                                                                     3

          1. INTRODUCTION                                                                                                      6
          1.1 NORTHEASTERN NORTH AMERICA: KEY DATA AND GHG TARGETS                                                              7
          1.2 EXISTING STUDIES AND CONTRIBUTIONS OF THIS REPORT                                                                 9
                    1.2.1 Technical studies of the regional power sector                                                        9
                    1.2.2 Large scale decarbonization studies in North America                                                 10
                    1.2.3 State-level decarbonization studies                                                                  12
                    1.2.4 Regional decarbonization studies                                                                     14
                    1.2.5 Contributions of this report                                                                         15

          2. ECONOMIC BENEFITS OF A REGIONAL DECARBONIZATION APPROACH                                                          16
          2.1 DESCRIPTION OF THE APPROACH                                                                                      16
          2.2 RESULTS                                                                                                          17
                    2.2.1 Required new capacity                                                                                17
                    2.2.2 Total system costs and its regional distribution                                                     20
                    2.2.3 Impact on wholesale prices                                                                           22
                    2.3 DISCUSSION                                                                                             23
                    2.3.1 Economic and social impacts                                                                          23
                    2.3.2 Key take-aways                                                                                       24
                    2.3.3 Limitations and research avenue                                                                      25
                    2.3.4 A conservative estimate of regional integration benefits                                             26

          3. CONCLUSION                                                                                                        27

          Acknowledgements: We would like to thank Philip Duguay, Dean Gatien, Mike Wise, Trent Berry and Guillaume Tarel
          for their feedback and useful comments. All views expressed in this paper are ours and do not necessarily reflect the
          views of acknowledged individuals or affiliated institutions.

          Pineau, P.-O., Ba, A. (2021). Getting on an Efficient Decarbonization Track. Transition Accelerator Reports Vol. 3,
          Issue 5, Pg. 1-39. (English Report)

EAST GRID: GETTING ON AN EFFICIENT DECARBONIZATION TRACK                                                                             5
Getting on an Efficient Decarbonization Track - An Economic Study of a Regional Approach to Electricity Markets in Northeastern North America ...
1. INTRODUCTION

  Canada and the United States have ambitious GHG emission reduction targets for 2030 and beyond.
  This is especially true for New York and New England, which have put in place different policies to transform
  their energy sectors. To reach these goals, the power sector must meet a double challenge: (1) to fully
  decarbonize generation; and (2) to meet increasing demand due to electrification.

  Canada Grid, through its East Grid process, aims at fostering a regional dialogue and collaboration to facilitate reaching
  these two goals in northeastern North America – or what we call here the “East Grid zone”. In Canada this region includes
  Ontario, Québec and the Atlantic provinces. In the United States, New York and New England are part of the region, as
  shown in Figure 1. These provinces and states already collaborate for reliability purposes through the Northeast Power
  Coordinating Council (NPCC), a not-for-profit corporation responsible for promoting and enhancing the reliability of the
  international, interconnected bulk power system in northeastern North America (NPCC, 2021)1.

  Given the scope of the decarbonization
  challenge, with ambitious 2030 and 2050
                                                                                                                         Atlantic
  objectives, finding the most efficient approaches
                                                                                                                     Newfoundland
  is key to success. Regional collaboration can                                                                      and Labrador (NL)
  offer very important benefits but is not well
                                                                                                                     Prince Edward Island (PE)
  documented or studied. This report provides                                      Québec                            New Brunswick (NB)
  results towards this end: making it clearer that                  Ontario                                          Nova Scotia (NS)
  the gains from more integration in northeastern
                                                                                                           Maine (ME)
  North America are well worth the difficulties                                                            New Hamphire (NH)
  involved in reforming current planning,                    New York                                      Vermont (VT)              New
  procurement, and operating systems.
                                                                                                           Massachusetts (MA)
                                                                                                           Rhode Island (RI)
                                                                                                                                    England
                                                                                                           Connecticut (CT)
  The rest of this introduction provides some key
  background information on northeastern North
                                                                    FIGURE 1. NORTHEASTERN NORTH AMERICA (EAST GRID ZONE)
  America and summarizes the findings of previous
  studies on decarbonization, to contextualize the
  specific findings and contributions of this report.

  1 Only the province of Newfoundland and Labrador is not formally included in the NPCC, because it was not interconnected with the rest of the
  NPCC system. With the Maritime Link, a 475 MW HVDC line competed in 2017, Newfoundland is now interconnected with Nova Scotia (NPCC, 2020).

EAST GRID: GETTING ON AN EFFICIENT DECARBONIZATION TRACK                                                                                          6
Getting on an Efficient Decarbonization Track - An Economic Study of a Regional Approach to Electricity Markets in Northeastern North America ...
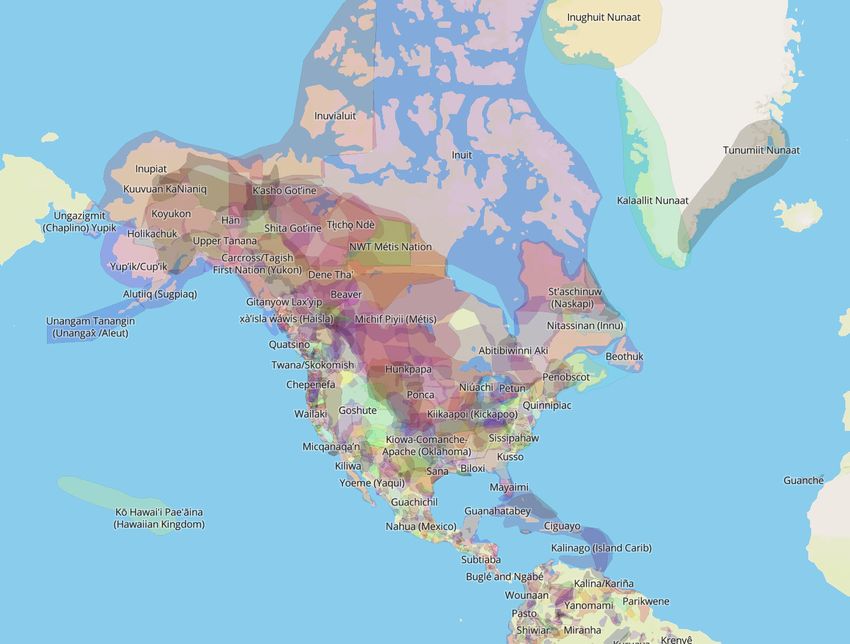
1.1 Northeastern North America: Key Data and GHG Targets
Northeastern North America is a region of almost 60 million people, generating about 637 terawatt-
hours (TWh) of electricity, see Figure 2. In comparison, the United Kingdom with its population of 66
million has a consumption of 326 TWh (IEA, 2020a). There are eight distinct balancing authorities or
   1.1
power      NORTHEASTERN
       markets                         NORTH
                 in the East Grid region,           AMERICA:
                                            with only  New EnglandKEY        DATA itsAND
                                                                      administering            GHG
                                                                                         six-state    TARGETS
                                                                                                   power  grid
under the authority of a regional body, ISO-New England. Despite only having 2.4 million citizens,
Atlantic Canada’s four provinces each have separate balancing authorities and power market operations.
ForNortheastern
    the purposesNorth   America
                   of this report,iswe
                                    a region
                                        divideofthe
                                                 almost 60 million
                                                    region         people,
                                                           into five       generating
                                                                     sub-regions,     about 637
                                                                                   Ontario,      terawatt-hours
                                                                                             Québec,  Atlantic (TWh) of electricity,
Canada,  New 2.
   see Figure  York  and New England.
                In comparison,  the United Kingdom with its population of 66 million has a consumption of 326 TWh (IEA, 2020a).
   There are eight distinct balancing authorities or power markets in the East Grid region, with only New England administering
Figure 2. Population (millions) and generation (terawatt-hours) in Northeastern North America in 2019
   its six-state power grid under the authority of a regional body, ISO-New England. Despite only having 2.4 million citizens,
   Atlantic Canada’s four provinces each have separate balancing authorities and power market operations. For the purposes of
   this report, we divide the region into five sub-regions, Ontario, Québec, Atlantic Canada, New York and New England.

                                                                                 Atlantic
   Generation is very unevenly distributed over the
                                                                                   2.4 M
                           Ontario            Québec
   territory, with Québec and the Atlantic provinces
                                                                                  65 TWh
                                                 8.5 M
   having a very large generation sector, for relatively
                          14.6 M
   small populations. GHG emissions from the191  TWh
                                             power                                                                    Atlantic
                         148 TWh
   sector range from almost zero to 27% of each                                                                         2.4 M
                                                                        New Québec
                                                                    Ontario
   sub-region’s total emissions. Low percentages are                                                                   65 TWh
                      New York
   explained by abundant hydropower (in Québec and                    England
                                                                     14.6 M
                                                                              8.5 M
                     19.5 Mand nuclear power in
   Newfoundland and Labrador),                                          14.8 M        191 TWh
                                                                    148 TWh
   Ontario. The carbon132   TWh
                       intensity of electricity greatly
                                                                       100 TWh                               New
   varies, from 1.2 gram per kilowatt-hour (g/kWh)
   in Québec to 220 in New England (Table 1). Some
                                                             New York                                       England
Generation is very unevenly distributed over the territory, 19.5 with Québec
                                                                       M      and the Atlantic provinces having
    provinces and states have more carbon intensive                                                        14.8 M
a very large generation sector, for relatively small populations. GHG emissions from the power sector
    power  sectors:                                             132 TWh                                  100 TWh
range  from  almostNova
                    zeroScotia
                          to 27%is of
                                   at 712
                                      eachg/kWh   and
                                             sub-region’s total emissions. Low percentages are explained by
    Rhode Island
abundant         at 427 (see
            hydropower        Appendix
                         (in Québec   and1 for details).
                                            Newfoundland    and Labrador),  and nuclear
                                                                        FIGURE          power in(MILLIONS)
                                                                                2. POPULATION     Ontario. TheAND GENERATION
carbon intensity of electricity greatly varies, from 1.2 gram per kilowatt-hour (g/kWh) in QuébecNORTH
                                                               (TERAWATT-HOURS)   IN  NORTHEASTERN     to 220AMERICA IN 2019
in New England (Table 1). Some provinces and states have more carbon intensive power sectors: Nova
Scotia is at 712 g/kWh and Rhode Island at 427 (see Appendix 1 for details).
   TABLE 1. POPULATION, ELECTRICITY GENERATION AND EMISSIONS IN NORTHEASTERN NORTH AMERICA, 2019 (2018
Table 1. Population, Electricity Generation and Emissions in Northeastern North America, 2019 (2018
   FOR US GHG DATA), SOURCES IN APPENDIX 1.
for US GHG data), sources in Appendix 1.
                                           Electricity                       Carbon    Electricity
                      Population Generation            GHG Total GHG       intensity      share of
                              (M)        (TWh)         (Mt)        (Mt)      g/kWh           GHG
     Ontario                   14.6          149.0            3.9        163.0            26.0             2%
     Québec                     8.5          191.0            0.2         83.7             1.2             0%
     Atlantic                   2.4           65.1           11.1         41.3           170.9            27%
     New York                  19.5          131.6           24.5        175.9           186.2            14%
     New England               14.8          100.0           22.0        148.1           220.4            15%
              Total            59.9          636.7           61.8        612.1            97.0            10%

                                                     6

EAST GRID: GETTING ON AN EFFICIENT DECARBONIZATION TRACK                                                                               7
Getting on an Efficient Decarbonization Track - An Economic Study of a Regional Approach to Electricity Markets in Northeastern North America ...
Not only are the generation levels and carbon intensities very different between the five su
                                                 prices greatly differ. Québec, the province with the highest production capacity, benefits fr
                                                 residential price (5.15 US¢/kWh, see Table 2). New England has the highest price, with 24.1
         Not only are the generation levels and carbon intensities very different between the five sub-regions, but
                                                 The paradox in the East Grid zone is that low-price regions have the cleanest electricity. As
         prices greatly differ. Québec, the province with the highest production capacity, benefits from the lowest
                                                 not integrated, only a limited amount of electricity can flow from low-cost, cleaner sub-reg
         residential price (5.15 US¢/kWh, see Table 2). New England has the highest price, with 24.11 US¢/kWh.
  Not only are the generation levels and carbon  cost, dirtier    sub-regions.TABLE 2. AVERAGE RESIDENTIAL PRICE, 2020 (HYDRO-
                                                          intensities
         The paradox in the East Grid zone is that low-price regions                    have the cleanest electricity. As markets are
                                                                                    QUÉBEC, 2020)
  very different between the five sub-regions, but prices
         not integrated, only a limited amount   Table 2.of Average
                                                            electricity    Residential
                                                                             can flow from Price,  2020 (Hydro-Québec,
                                                                                                 low-cost,     cleaner sub-regions2020)to high-
  greatly differ. Québec, the province with the highest                                                          Reference City
         cost, dirtier sub-regions.                                                                                                          Cents (US$)/kWh
  production capacity, benefits from the lowest residential                        Québec                              Montréal                               5.13
         Table
  price (5.15    2. Average
              US¢/kWh,    seeResidential
                                Table 2). New Price,  2020has
                                                 England     (Hydro-Québec,
                                                                   the                 2020)
                                                                                   Ontario                               Toronto                              7.81
                                                                    Reference City             Cents (US$)/kWh
  highest price, with 24.11 US¢/kWh. The paradox in the                            Atlantic                               Halifax                           11.88
                                      Québec                                Montréal                              5.13
  East Grid zone is that low-price regions have the cleanest                       New York                            New York                             23.69
                                      Ontario                                Toronto                              7.81
  electricity. As markets are not integrated, only a limited                       New England                            Boston                            24.11
                                      Atlantic                                 Halifax                          11.88
  amount of electricity can flow from low-cost, cleaner sub-
                                      New York                              New York                            23.69
  regions to high-cost, dirtier sub-regions.                                                          2
                                      New EnglandHydropower in Québec              and Labrador can be24.11
                                                                               Boston                             stored as potential energy in different multi-y
                                                 reservoirs. In Québec, there is an existing total storage capacity of 176 TWh, controlled by t
  Hydropower in Québec and Labrador2 can be stored as potential energy in different multi-year reservoirs. In Québec, there is
                                                 Québec 2 generation company (Hydro-Québec, 2019). In Labrador, the Smallwood reservoir
         Hydropower
  an existing            in Québec
               total storage          andofLabrador
                               capacity       176 TWh, can      be stored
                                                          controlled            as potential
                                                                           by the               energygeneration
                                                                                    largest Québec         in differentcompany
                                                                                                                          multi-year  (Hydro-Québec, 2019).
                                                 the Churchill Falls plant, has a maximum storage capacity of 27 TWh (Séguin, 2017). Storage
         reservoirs.
  In Labrador,         In Québec,reservoir
                the Smallwood        there is an    existing total
                                                associated      to the storage     capacity
                                                                           Churchill          of 176has
                                                                                        Falls plant,     TWh, maximum
                                                                                                                 controlledstorage
                                                                                                                               by the largest
                                                 and Labrador        could    theoretically    meet Newa York’s         electricity needs  capacity    of 27than
                                                                                                                                                 for more      TWha year. A
         Québec
  (Séguin,  2017). generation     company
                    Storage in Québec      and(Hydro-Québec,
                                                 Labrador            2019).     In Labrador,     the Smallwood        reservoir     associatedmoretothan
                                                 wholesalecould market theoretically
                                                                            would better  meet  New
                                                                                              balance    York’s  electricity
                                                                                                           consumption         needs
                                                                                                                             levels   andforprices,         a year.
                                                                                                                                                      leading   to both wel
         the  Churchill  Falls  plant, has   a maximum       storage       capacity    of 27  TWh    (Séguin,     2017).
                                                                                                                    3     Storage      in Québec
  A regional wholesale market would better       lower emission levels across the East Grid zone.
                                                      balance      consumption        levels  and   prices,    leading   to  both   welfare     gains   and   lower
         and Labrador could theoretically meet New York’s electricity needs for more than a year. A regional
  emission levels across the East Grid zone.3
         wholesale market would better All           provinces
                                                 balance            and states
                                                            consumption             haveand
                                                                                 levels    either   set ambitious
                                                                                               prices,    leading to GHGboth reduction
                                                                                                                               welfare gains  targets
                                                                                                                                                   andfor 2030 and 2050
                                                                        3
         lower emission
  All provinces   and states levels
                               haveacross
                                      eitherthe  targets
                                               set East    setzone.
                                                        Grid
                                                    ambitious    for
                                                                   GHGthem     by the government,
                                                                           reduction     targets for 2030   as inand
                                                                                                                  the2050,
                                                                                                                       case oforCanada.
                                                                                                                                   have had    Table   3 provides
                                                                                                                                                  targets   set for an overv
  them by the government, as in the case         targets,   with more Tabledetails     in Appendix       1 on eachthese
                                                                                                                      Atlantic province        and New      England state.
         All provinces and states have eitherofset       Canada.
                                                           ambitious        GHG3 provides
                                                                                   reduction  an overview
                                                                                                 targets for of  2030 andtargets,
                                                                                                                              2050, orwith  havemore
                                                                                                                                                   had details in
  Appendix   1 on set
                   each                          emission    reductions        in the   order  of  40%     are  required    for 2030      and   beyond    80%   for 2050.
         targets       forAtlantic
                           them byprovince       and New as
                                      the government,        England
                                                                  in the state.
                                                                            case ofInCanada.
                                                                                        sum, GHG      emission
                                                                                                  Table            reductions
                                                                                                           3 provides             in theof
                                                                                                                         an overview         order
                                                                                                                                                theseof 40% are
  required  for 2030
         targets,  withand
                         morebeyond   80%
                                 details     forTable
                                                  2050.3.1 GHG
                                          in Appendix       on each  Reduction
                                                                           AtlanticTargets
                                                                                      province (C2ES,
                                                                                                  and New 2021a    and b)state. In sum, GHG
                                                                                                                England
         emission reductions in the order of 40% are required for 2030 and beyond 80% for 2030                           2050.
  TABLE 3. GHG REDUCTION TARGETS (C2ES,Ontario             2021A AND B)                        40-45% from 2005 level                                       Federal net-zer
         Table 3. GHG Reduction Targets (C2ES, 2021a and b)
                                                         Québec                                 37.5% from 1990 level                                    Provincial net-zer
                                                                             2030                                                        2050
                                                         Atlantic                              40-45% from 2005 level                                       Federal net-zer
                 Ontario                           40-45% from 2005 level                                       Federal net-zero target
                                                         New York                                  40% from 1990 level                            >85% and state net-zer
                 Québec                             37.5% from 1990 level                                    Provincial net-zero target
                                                         New England               Various targets (see Appendix 1)                   State net-zero target or 80% re
                 Atlantic                          40-45% from 2005 level                                       Federal net-zero target
                 New York                             40% from 1990 level                           >85% and state net-zero target
                 New England                     Given   the   fact
                                      Various targets (see Appendix 1)that   coal  power     emissions
                                                                                          State net-zero    have   already
                                                                                                               target  or 80% been    removed from most provinces
                                                                                                                                 reduction
                                                 (only New Brunswick and Nova Scotia still have coal-fired power plants), further GHG emiss
  Given the fact that coal power emissionsreductions
                                                   have already  will haveremoved
                                                                               to mostly come        from    substituting     non-emitting
                                                                                                                                   (only New generating         sources (ren
         Given the fact that coal power emissions            havebeen already beenfrom         most
                                                                                          removed       provinces
                                                                                                        from   mostand    states
                                                                                                                      provinces     and statesBrunswick and
  Nova Scotia   still have  coal-fired           nuclear)   to   natural     gas  power     plants.   If  electricity  demand      grows      because    of  electrification
         (only New     Brunswick    andpower     plants),still
                                         Nova Scotia       further
                                                               haveGHG        emission
                                                                        coal-fired         reductions
                                                                                       power   plants), will     haveGHG
                                                                                                            further    to mostly
                                                                                                                             emissioncome from substituting
                                                 transportation, then additional power generation capacity is very likely to be needed. At th
  non-emitting   generating
         reductions            sources
                       will have         (renewable
                                   to mostly            or nuclear)
                                                come from                 to natural
                                                               substituting             gas powergenerating
                                                                                  non-emitting        plants. If electricity    demand grows
                                                                                                                    sources (renewable           or because of
                                                 gas-fired power plants must cease emitting GHGs.
         nuclear)oftoheat
  electrification       natural  gas power plants.
                            and transportation,         If electricity
                                                     then  additional demand            grows because
                                                                            power generation       capacity  of is
                                                                                                                 electrification
                                                                                                                   very likely toof  beheat     and At the same
                                                                                                                                          needed.
         transportation,
  time, gas-fired            then additional
                   power plants     must ceasepower       generation
                                                 2 emitting    GHGs. capacity is very likely to be needed. At the same time,
                                                   Labrador is the northwestern part of the Newfoundland and Labrador province, connected by land
         gas-fired power plants must cease       3   emitting
                                                   See Billette deGHGs.
                                                                      Villemeur and Pineau (2016) for an analysis demonstrating this in the case of Ontari

  2       2
      Labrador is the northwestern part of the Newfoundland and Labrador province, connected by land to Québec.
            Labrador   is the northwestern   part of the Newfoundland  and  Labrador  province,  connected  by land to Québec.
          3                                                                                          7 of Ontario and Québec.
              See Billette de Villemeur and Pineau (2016) for an analysis demonstrating this in the case
  3   See Billette de Villemeur and Pineau (2016) for an analysis demonstrating this in the case of Ontario and Québec.

                                                                         7
EAST GRID: GETTING ON AN EFFICIENT DECARBONIZATION TRACK                                                                                                          8
Getting on an Efficient Decarbonization Track - An Economic Study of a Regional Approach to Electricity Markets in Northeastern North America ...
In such a context of growing demand and supply restrictions, opportunities to optimize the growth and development of the
  power sector should be pursued. As we will see from existing decarbonization studies reviewed in the next section, some
  promising opportunities have been neglected involving regional integration of power systems.

  1.2 EXISTING STUDIES AND CONTRIBUTIONS OF THIS REPORT

  We summarize here four types of studies from a literature review that are either related to
  decarbonization or to the East Grid zone:

  1.   Technical studies of the regional power sector;                    3.   State-level decarbonization studies; and

  2.   Large scale decarbonization studies in North America;              4. Regional decarbonization studies.

  For each of these recent studies we highlight some key features and findings.

  1.2.1 TECHNICAL STUDIES OF THE REGIONAL POWER SECTOR

  The NPCC regularly publishes a “Long Range Adequacy Review” for northeastern North America, considering the expected
  load growth (including new loads from electrification when estimates are available) and generating capacity of the sub-
  regions. See for instance NPCC (2020). While the title indicates that a “long-range” perspective is taken, only the next 5 years
  are considered, and longer term GHG emissions constraints are not part of the analysis. In addition, no cost considerations
  are explicitly integrated.

  The analysis is regional and focuses on reliability. It uses General Electric’s Multi-Area Reliability Simulation (MARS) program,
  without trying to optimize investment in new generation and transmission capacity to meet future demand, under new GHG
  constraints. This series of studies from the NPCC is worth mentioning because a rapid transformation of the grid is required
  to meet the 2030 targets, and reliability issues will inevitably arise and be within NPCC’s area of interest.

  The North American Electric Reliability Corporation (NERC), which includes the NPCC and the other five North American
  regional entities in charge of the reliability and security of the grid, already identifies the changing resource mix as the top
  perceived risk (by industry stakeholders) faced by the power system (NERC, 2021a). The number one risk profile, out of four
  recently documented by NERC, is grid transformation.4 The NERC observes that “current resource planning and resource
  adequacy assessments are often performed with a limited scope (political or utility boundary) that does not take into account
  potentially significant electrical impacts and interactions due to the interconnected nature of the bulk grid outside of that
  limited scope.” (NERC, 2021a, p.23). Implicitly acknowledging the shortcomings of the current analysis performed by the
  NPCC (and the other NERC regional entities), NERC recommends to “expand regionally” the analysis for resource adequacy,
  energy adequacy, and transmission adequacy, notably for balancing services.

  4 The other ones are extreme events, security risks and critical infrastructure interdependencies (NERC, 2021a).

EAST GRID: GETTING ON AN EFFICIENT DECARBONIZATION TRACK                                                                              9
Getting on an Efficient Decarbonization Track - An Economic Study of a Regional Approach to Electricity Markets in Northeastern North America ...
1.2.2 LARGE SCALE DECARBONIZATION STUDIES IN NORTH AMERICA

  Typical economy-wide decarbonization studies usually only consider a single country, such as the United
  States in Larson et al. (2020) and Canada in Bataille et al. (2015). By their nature, they cannot consider
  potential benefits from increased collaboration between countries, and because of their economy-wide
  scope, they usually lack a high-level of detail on the power sector.

  A North America-wide perspective, including Mexico, the US and
                                                                               GIVEN THAT DECARBONIZATION OF
  Canada, was adopted in the North American Renewable Integration
                                                                               THE ELECTRICITY SECTOR IS A
  Study (NARIS) conducted by NREL (Brinkman et al., 2021a and b). In this
                                                                               STATE/PROVINCIAL RESPONSIBILITY
  study, focussing on the power sector, regional integration benefits are
  clearly highlighted. New generation and transmission infrastructure are      IN NORTH AMERICA, HAVING STATE/
  economically located, based on renewable energy potentials and costs.        PROVINCIAL RESULTS IS IMPORTANT
  Trade and internal market rule restrictions are not modelled, so results     TO GUIDE POLICIES.

  from this study illustrate the economic potential that could be achieved if markets were operated from
  a global perspective, rather than responding primarily to sub-regional goals and constraints. However,
  in the NARIS study, complete decarbonization was not the focus, so results do not fully speak to those
  interested in zero-emission targets. The continent-wide scope also limits the level of detail provided for
  regions like northeastern North America. Given that decarbonization of the electricity sector is a state/
  provincial responsibility in North America, having state/provincial results is important to guide policies.
  Otherwise, policymakers in state and provinces will suffer from data gaps.

  Table 4 provides a summary of key features of these three studies. They illustrate the important expected
  growth in electricity demand (load growth of two to four times bigger in 2050) and the required large-
  scale increase in renewable electricity generation.

EAST GRID: GETTING ON AN EFFICIENT DECARBONIZATION TRACK                                                         10
TABLE 4. KEY ASSUMPTIONS AND RESULTS FROM LARGE-SCALE DECARBONIZATION STUDIES

          Table 4. Key assumptions and results from large-scale decarbonization studies
                                                    US                       Canadian           North American Partial
                                       Decarbonization                 Decarbonization                Decarbonization
                                                                                                   Brinkman et al. (2021a
           Study                      Larson et al. (2020)           Bataille et al. (2015)
                                                                                                                    and b)
                                 High electrification and
           Scenario                                                   Oil price moderate                    Electrification
                                       100% renewable
           Horizon                                                       2050
                                                                   1.7 tonnes per capita       80% in the US and Mexico
           GHG reduction                          Net-zero           (from 19.4 in 2019,                   92% in Canada
                                                                        ≈88% reduction)                (from 2005 levels)
                                                                            Reveal resilient
                             Articulating a granular picture     decarbonization pathways
                                  of prospective transitions.     that can be implemented        Feasibility and adequacy of
           Focus
                              Identify potential bottlenecks    today and scaled to deeper        high-renewable scenarios
                                                  to success     mitigation ambition in the
                                                                               longer term
                                           4x from 2020
           Load growth                                                    2.5x from 2010                     2x from 2020
                              from 4,000 to 15,600 TWh
                                                                                               Canada 2024        2050
                                                                                               Wind        15      150
                                                                                               Solar        4       58
                             US      2020         2050
           Renewable                                                  Not detailed, but        Hydro       80       82
                             Wind     100         3,000
           capacity (GW)                                             renewable energy          Storage      0         4
                             Solar     90         2,500
           and non-hydro                                        grows 3x between 2010          US
                             Hydro     90            90
           storage                                                           and 2050          Wind       140      840
                             Storage    0           200
                                                                                               Solar      160 1,290
                                                                                               Hydro       90       90
                                                                                               Storage     20      130
           US-Can                                                                                        From 18 in 2020
                                                          NA                            NA
           Transmission                                                                                 to 38 GW in 2050
                                                                                                   $12B (over 2020-2050)
           Value of US-Can
                                                          NA                            NA      $2B/year for hydropower
           transmission
                                                                                                                flexibility

EAST GRID: GETTING ON AN EFFICIENT DECARBONIZATION TRACK                                                                       11
1.2.3 STATE-LEVEL DECARBONIZATION STUDIES

  As some states and provinces are highly committed to reach their decarbonization targets, they have
  commissioned in-depth decarbonization studies. In the case of New York, a specific focus has been
  placed on the power sector as the state has explicit renewable energy goals for its power sector.

  Four significant studies have been found for two states and one province in the East Grid zone:

  +   New York: Hibbard et al. (2020), from the Analysis Group, and Lueken et al. (2020), from the
      Brattle Group, have conducted studies for the New York Independent System Operator, to better
      understand changes required to adapt the grid.

  +   Massachusetts: Jones et al. (2020), from Evolved Energy, have taken a wider perspective to
      study in more details the key sectors that have to change in order meet the GHG targets.

  +   Québec: Poirier et al. (2019), from Dunsky Energy + Climate and ESMIA, wrote a report for the
      Québec Ministry of the environment, on the key modelling results required to achieve net-zero
      emission by 2050.

  Table 5, next page, summarizes the main findings of these studies.

  Only the Massachusetts study (Jones et al., 2020) considers the regional benefits of interconnecting
  the state to its neighbors. While that study does not assess quantitatively the value of such regional
  interconnections, it mentions explicitly their importance for balancing. These interconnections can limit
  the amount of new in-state storage, that would otherwise be required to store wind and solar power.

  It is worthy to point out that the New York studies indicate huge increase in wind and solar capacities:
  more than 100 GW of new wind and solar for Hibbard et al. (2020) and more than 80 GW for Lueken
  et al. (2020), plus about 15 GW of new storage capacity, for New York only. While their optimization
  models minimize total costs, these studies do not report any total costs and do not point out to possible
  alternative regional scenarios.

EAST GRID: GETTING ON AN EFFICIENT DECARBONIZATION TRACK                                                      12
TABLE 5. KEY ASSUMPTIONS AND RESULTS FROM LARGE-SCALE DECARBONIZATION STUDIES5
      Table 5. Key assumptions and results from large-scale decarbonization studies
                                       New York                 New York          Massachusetts                   Québec
                                  Hibbard et al.            Lueken et al.                                    Poirier et al.
                                                                                Jones et al. (2020)
       Study                              (2020)           (2020) Brattle                                          (2019)
                                                                                   Evolved Energy
                                 Analysis Group                   Group                                 Dunsky and ESMIA
                             CCP2-CLCPA Climate
                                Change Phase II &                     High
       Scenario                Climate Leadership          electrification               All options            Scenario C
                                  and Community             load forecast
                                   Protection Act
       Horizon                                2040                                     2050                         2050
       GHG reduction               100% zero emission (power sector)                      Net-zero         75% from 1990
                                                               Simulate the     Focus on the largest
                              Review the potential
                                                            [power sector]      single component of
                             impacts on reliability
                                                        resources that can          these emissions,       Draw the major,
                                      of the (1) the
                                                         meet state policy     carbon dioxide (CO2)         economy-wide,
                                electricity demand
                                                            objectives and     from energy use, and     required changes to
       Focus                  projections for 2040
                                                              energy needs              how it can be        meet the 2050
                               and (2) system load
                                                          through 2040, in     dramatically reduced        decarbonization
                                      and resource
                                                           order to inform       or eliminated while                target.
                            availability associated
                                                             reliability and   maintaining a vibrant
                             with climate change.
                                                            market design.                 economy.
                                            x1.4 in 2040
                                                                                              x1.9                    x1.9
       Load growth                    x1.6 in 2050 from 2020
                                                                                in 2050 from 2020       in 2050 from 2015
                              Climate Impact Phase I study (Itron, 2019)
                                  2020       2040            2020      2040           2020 2050                2015 2050
       Renewable
                            Wind      2        56      Wind      2       48    Wind 0.1          16     Wind      4      24
       capacity5 (GW)
                            Solar   0.7        50      Solar   0.7       38    Solar     1       24     Solar    ≈0      15
       and non-hydro
                            Hydro     4         4      Hydro     4        4    Hydro 0.3        0.3     Hydro 40         60
       storage
                            Storage ≈0         16      Storage ≈0        14    Storage ≈0         4     Storage 0         0
       US-Can                                                                     QC-MA: +3.3 GW          Limited increase
                                         Limited to existing
       Transmission                                                               QC-NY: +4.7 GW                   allowed
                                                                                Not estimated, but
       Value of US-Can
                                                NA                      NA            qualitatively          Not assessed
       transmission
                                                                                 indicated as large

   5 State renewable capacity in 2020 comes from EIA (2021c).

EAST GRID:
     5        GETTING capacity
       State renewable ON AN EFFICIENT    DECARBONIZATION
                               in 2020 comes from EIA (2021c). TRACK                                                          13
1.2.4 REGIONAL DECARBONIZATION STUDIES

  A few regional studies have been made to explore the possible value of interconnecting different sets
  of states and provinces in Northeastern North America.

  +   Williams et al. (2018), in an Evolved Energy report commissioned by Hydro-Québec, compare
      different transmission and renewable addition scenarios between Québec and New York and New
      England. It finds that the net benefits of increased coordination and transmission are in the range
      of $4B per year.

  +   Dimanchev et al. (2021), from MIT, use an optimization model of the Québec-New York-New
      England region to assess the role of Québec’s hydropower reservoirs to decarbonize New
      England. Its main result is to demonstrate the role of Québec hydropower’s reservoirs to balance
      intermittent renewable generation. Enabled by 4 GW of additional transmission capacity, New
      England could avert the construction of 30 GW of wind and solar capacity. Two-way trade of
      electricity between Québec and New England reduces the overall cost by 5-6%, or about $1-2/
      MWh.

  +   Rodríguez-Sarasty et al. (2021), from HEC Montréal, conduct a similar inquiry to the one
      presented in Dimanchev et al. (2021), but with a few distinct features. First, the analysis is more
      regional, as it includes Ontario and the Atlantic provinces, as shown in Figure 1. Second, contrary
      to Dimanchev et al. (2021), who compare cases differing by 4 GW of transmission capacity,
      interties are endogenously determined. This means that the optimal level of transmission can
      be found between all states and provinces with the model instead of coming up as a scenario.
      Finally, the actual financial value of regional integration is more detailed, with a breakdown of
      costs and benefits across states and provinces. Overall, results of this study converge towards
      similar findings: more transmission is needed between states and provinces, to allow more hourly
      and seasonal trade in both directions. Global cost savings, in a 100% decarbonization context, are
      estimated around $10B per year under regional collaboration (and more interties), compared to a
      system without new interconnections.

EAST GRID: GETTING ON AN EFFICIENT DECARBONIZATION TRACK                                                    14
1.2.5 CONTRIBUTIONS OF THIS REPORT

  Major decarbonization studies have demonstrated a sparse interest in exploring the benefits of regional
  collaboration in power system decarbonization, as illustrated in our review of large scale and state-level
  decarbonization studies (see Tables 4 and 5). Transmission across the Canadian-American border and
  between various states and provinces is seldom included in recent studies, and this is now considered
  by the NERC to be an issue, as discussed previously (see NERC, 2021a). Only the NARIS study from
  NREL (Brinkman et al., 2021a and b) and the study conducted by Evolved Energy for the state of
  Massachusetts (Jones et al., 2020) include such interties. However, the large scope of these studies
  neglects to place a focus on the full benefits of regional collaboration (increased integration) and how
  these gains are distributed.

  Given the established potential of greater power sector collaboration           THE OBJECTIVE OF THIS PAPER
  to reduce decarbonization costs, there is a need for additional                 IS TO CONTRIBUTE TO FURTHER
  modelling exercises. The objective of this paper is to contribute
                                                                                  DOCUMENT AND MAKE KNOWN THE
  to further document and make known the economic potential of
                                                                                  ECONOMIC POTENTIAL OF INCREASED
  increased collaboration in the East Grid zone, where huge storage
                                                                                  COLLABORATION IN THE EAST GRID
  is already available in Québec and Labrador’s hydro reservoirs, and
  where governments have started planning the introduction of large-              ZONE, WHERE HUGE STORAGE IS
  scale intermittent renewable resources.                                         ALREADY AVAILABLE IN QUÉBEC AND
                                                                                  LABRADOR’S HYDRO RESERVOIRS ...
  Building on Rodríguez-Sarasty et al. (2021), this report makes two
  additional contributions:

  1.   Load growth.
       The impact of different load growth scenarios is explored, to better understand how possible
       energy efficiency efforts and electrification trends can affect results.

  2. Distribution of benefits.
       Benefits and costs across states and provinces are more detailed, allowing to better understand
       the political economy challenges related to regional integration.

EAST GRID: GETTING ON AN EFFICIENT DECARBONIZATION TRACK                                                            15
2. ECONOMIC BENEFITS OF A REGIONAL
  DECARBONIZATION APPROACH

  2.1 DESCRIPTION OF THE APPROACH
  Based on the capacity expansion and hourly operation power sector model used in Rodríguez-Sarasty et al. (2021), the
  regional economic impacts of two decarbonization approaches is detailed through the following metrics:

  +   Investment in capacity. The model’s results provide the               +    Cost of the decarbonized power system, exports and
      required investment in generation capacity, storage and                    imports. The cost of the zero-emission power system,
      interties (transmission links) in each sub-region.                         exports and imports by sub-region are provided,
                                                                                 allowing a comparison of how different approaches
  +   Wholesale price. Based on marginal production costs,
                                                                                 result in different economic impacts.
      that can be used as a proxy for wholesale prices,
      estimates of the price impact in each sub-region are
      documented.

  The model’s objective is to find the least cost investment options in all five sub-regions to meet their 8,760 hours (a full year)
  of power demand (or hourly loads). A constraint on GHG emissions limits to zero such emissions. A portfolio of technologies
  (wind, solar, storage, interties, etc.) and demand response6 options are available and are used by the model to minimize the
  cost of meeting the demand. The existing hydropower capacity in all states and provinces, as well as the current natural
  gas power capacity remain available. With the strict emission constraint (zero emissions), this natural gas capacity can
  only be used with “carbon-neutral natural gas”: either renewable natural gas, or fossil natural gas with carbon capture and
  storage. The existing level of nuclear power remains available, but new nuclear for the East Grid zone is not considered in this
  report.7 Only Québec’s hydro reservoirs (total of 176 TWh) are modelled for storage in this study, due to the lack of available
  information on the Smallwood reservoir in Labrador.

  Two approaches are used with respect to transmission between the five sub-regions (see Figure 1): either no additional
  interties are possible, or on the contrary as much transmission as needed, and economically justified, is built. The first
  possibility corresponds to a decarbonization approach “in isolation”. The second reflects a “regional collaboration”, as such
  interties require significant discussions between states and provinces. The transmission and distribution networks within
  states and provinces is not modelled. We assume that adequate upgrades are made to allow for the decarbonization of
  the generation system. Finally, no difference is made between distributed energy resources and large wind/solar farms.
  Investments in wind and solar can be interpreted to be small or utility-scale investments.

  6 “Demand response provides an opportunity for consumers to play a significant role in the operation of the electric grid by reducing or shifting
  [emphasis added] their electricity usage during peak periods in response to time-based rates or other forms of financial incentives” (DoE, 2021).
  In the model used here, load is only reduced, without shifting, as explained in Appendix 2.

  7 In Rodríguez-Sarasty et al. (2021) some scenarios with no nuclear are explored, leading to much greater renewable investments. Sepulveda
  et al. (2018) look at the importance of nuclear and other “firm low-carbon resources”, but they ignore the large-scale storage possibility of
  hydropower reservoirs.

EAST GRID: GETTING ON AN EFFICIENT DECARBONIZATION TRACK                                                                                              16
These two intertie approaches are combined with two load growth scenarios: a moderate load growth
                                                (1.5x the 2018 load and a winter peaking demand) and a high load growth one (2.5x with winter peaking
  These two intertie approaches are combineddemand).
                                                   with two       loadone
                                                            The first    growth    scenarios:
                                                                           corresponds              a moderate
                                                                                         to a scenario                 load growth
                                                                                                         where consumption               (1.5x
                                                                                                                                efficiency  limitsthe
                                                                                                                                                   load2018
                                                                                                                                                          growth,load
                                                                                                                                                                   while
                                                These
                                                the     two
                                                     second  intertie
                                                              on      approaches
                                                                  corresponds  to aare combined
                                                                                    scenario   wherewith two   load  growth
                                                                                                       electrification  of
  and a winter peaking demand) and a high load growth one (2.5x with winter peaking demand). The first one corresponds to a  scenarios:
                                                                                                                           end-uses,     a moderate
                                                                                                                                      without   an      load growth
                                                                                                                                                    efficiency focus,
                                                (1.5x
                                                leadsthe
                                                       to a2018
                                                            high load  and increase.
                                                                   demand   a winter peaking demand) and a high load growth one (2.5x with winter peaking
  scenario where consumption efficiency limitsdemand).
                                                 load growth,
                                                            The firstwhile   the second
                                                                      one corresponds    to aon  corresponds
                                                                                              scenario               to a scenario
                                                                                                         where consumption              where
                                                                                                                                efficiency  limitselectrification
                                                                                                                                                   load growth, while
                                                This leads to four decarbonization scenarios, as summarized in Table 6.
                                                the second    on corresponds
  of end-uses, without an efficiency focus, leads to a high demand increase.   to a scenario   where   electrification  of end-uses,  without   an efficiency focus,
                                                leads
                                                Tableto6. aFour
                                                            highdecarbonization
                                                                  demand increase. scenarios for northeastern North America
                                                                                                                     Transmission Interties
  This leads to four decarbonization            This leads
                                               TABLE      6.to four
                                                                FOUR decarbonization   scenarios, asSCENARIOS
                                                                         DECARBONIZATION               summarized in Table 6.
                                                                                                    Same as existing FOR NORTHEASTERN   As much as needed
  scenarios, as summarized in Table 6.         NORTH
                                                Table 6. AMERICA
                                                          Four decarbonization scenarios    “Decarbonization
                                                                                               for northeastern  inNorth
                                                                                                                    isolation”
                                                                                                                           America “Regional collaboration”
                                                                     Moderate                   Scenario 1 Isolation   and
                                                                                                                    Transmission   Scenario
                                                                                                                                   Interties 3 Collaboration and
                                                  Load         (1.5x & winter peak)              moderate
                                                                                                    Same asload    growth
                                                                                                              existing                 moderate
                                                                                                                                        As much load     growth
                                                                                                                                                   as needed
  All assumptions on parameters’ value          growth                  High                 Scenario 2 Isolation    and high      Scenario   4Collaboration    and
                                                                                           “Decarbonization      in isolation”       “Regional    collaboration”
  are presented in the Appendix 2. The                         (2.5xModerate
                                                                     & winter peak)                   load
                                                                                                Scenario    growth and
                                                                                                          1 Isolation             Scenariohigh  load growth and
                                                                                                                                              3 Collaboration
                                                  Load         (1.5x & winter peak)              moderate load growth                  moderate load growth
  complete description of the model can be growth
                                                                        High                Scenario 2 Isolation and high          Scenario 4Collaboration and
                                                All assumptions on parameters’ value are presented in the Appendix 2. The complete description of the
  found in Rodríguez-Sarasty et al. (2021).                    (2.5x & winter peak)                   load growth                        high load growth
                                                model can be found in Rodríguez-Sarasty et al. (2021).

  Gross domestic product (GDP) and job change    Gross  domestic product
                                                     estimates     cannot (GDP)
                                                                             be and  job change
                                                                                 obtained    with estimates
                                                                                                     this   cannot be
                                                                                                           model.  Anyobtained with this model.
                                                                                                                                         wouldAny
                                                 All assumptions  on parameters’  value are presented  in the Appendix 2. assessment             inofany
                                                                                                                          The complete description    the
                                                 assessment would in any case be highly speculative given the difficulty of modelling the economic impact
  case be highly speculative given the difficultymodel
                                                  of     can be found
                                                       modelling      in Rodríguez-Sarasty
                                                                    the  economic          et al.of
                                                                                      impact      (2021).
                                                                                                    an  energy   transition,   with  deep  changes
                                                 of an energy transition, with deep changes in consumption and production patterns. Social implicationsin
  consumption and production patterns. Social Gross
                                              of thedomestic
                                                    different product
                                              implications    results (GDP)
                                                               of thecan    and job
                                                                         however
                                                                       different  bechange  estimates
                                                                                     discussed
                                                                                  results   can (see   cannot
                                                                                                     section
                                                                                                  however      be discussed
                                                                                                             2.3).
                                                                                                              be   obtained with(see
                                                                                                                                  this model.
                                                                                                                                       sectionAny2.3).
                                                  assessment would in any case be highly speculative given the difficulty of modelling the economic impact
                                                  2.2 Results
                                                  of an energy transition, with deep changes in consumption and production patterns. Social implications
                                                  These  results are   not associated  to any   particular (see
                                                                                                           year,section
                                                                                                                 such as2.3).
                                                                                                                          2040 or 2050. They represent what would
  2.2 RESULTS                                     of the different  results  can however    be discussed
                                                  be needed to supply electricity every hour of a year in the five sub-regions, at minimum total cost,
                                                  2.2
                                                  withoutResults
                                                           GHG emissions.
  These results are not associated to any particular year, such as 2040 or 2050. They represent what would be needed to
                                                  These results are not associated to any particular year, such as 2040 or 2050. They represent what would
                                                  2.2.1 Required new capacity
  supply electricity every hour of a year in thebefive    sub-regions,
                                                      needed                  at minimum
                                                              to supply electricity   every hourtotal
                                                                                                   of a cost,
                                                                                                        year inwithout     GHG emissions.
                                                                                                                the five sub-regions,    at minimum total cost,
                                                  While the current installed capacity in the East Grid zone is about 180 GW (see Appendix 2 for the
                                                  without GHG emissions.
                                                  breakdown by technology and sub-region), decarbonization would require installing between about the
  2.2.1 REQUIRED NEW CAPACITYsame andRequired     2.2.1      five times thisnew      capacity
                                                                               amount,  depending on the scenario. Table 7 illustrates that if load growth is
                                                  While  the current
                                                  moderate    and underinstalled capacity
                                                                           regional        in the East
                                                                                    collaboration,      Grid
                                                                                                     only 199zone
                                                                                                               GWisofabout  180 GW would
                                                                                                                       new capacity    (see Appendix     2 for If,
                                                                                                                                               be required.     theon the
                                                  breakdown    by technology
                                                  contrary, there               andgrowth
                                                                    is a high load   sub-region),
                                                                                             and nodecarbonization     would require
                                                                                                     regional collaboration,            installing
                                                                                                                               a staggering   1,036between
                                                                                                                                                      GW areabout      the
                                                                                                                                                                required.
  While the current installed capacity in        TABLE
                                                  same and7. fiveTOTAL
                                                                  times thisREQUIRED         NEW GENERATION
                                                                               amount, depending                        AND 7STORAGE
                                                                                                      on the scenario. Table                    CAPACITY
                                                                                                                                 illustrates that  if load growth is
                                                  Table 7. Total required new generation and storage capacity
  the East Grid zone is about 180 GW              moderate and under regional collaboration, only 199 GW of new capacity would be required. If, on the
                                                                                                                     Transmission Interties
                                                  contrary, there is a high load growth and no regional collaboration, a staggering 1,036 GW are required.
  (see Appendix 2 for the breakdown                                                              Same as existing
                                                                                                                          Difference          As much as needed
                                                  The possibility to build as much transmission“Decarbonization    in
                                                                                                      interties as needed  reduces
  by technology and sub-region),                                                                                              GW the overall       need
                                                                                                                                           “Regional       for new
                                                                                                                                                        collaboration”
                                                  capacity: 15 GW are avoided if load growth isisolation”
                                                                                                       moderate (difference between scenarios 1 and 3), while
  decarbonization would require installing        348 GW would beModerate
                                                                        avoided if there is a high load
                                                                                                      214growth
                                                                                                          GW (difference 15    between scenarios199    2 and
                                                                                                                                                          GW4).
                                                    Load        (1.5x & winter peak)
  between about the same and five times           Table 7. Total required
                                                   growth                 Highnew generation and storage capacity
                                                                                                    1,036 GW                  348                    688 GW
                                                                (2.5x  & winter  peak)                               Transmission Interties
  this amount, depending on the scenario.
                                                                                                 Same as existing
                                                                                                                          Difference         As much as needed
                                                                                              “Decarbonization in
                                                                                                                              GW           “Regional collaboration”
  Table 7 illustrates that if load growth is moderate and under regional collaboration, only 199 GW of new capacity would be
                                                                                                    isolation”
                                                    Load              Moderate
  required. If, on the contrary, there is a high load
                                                  growth
                                                        growth     and no regional collaboration,
                                                               (1.5x & winter peak)
                                                                                                     21416GW a staggering     15 1,036 GW are       199 GWrequired.

  The possibility to build as much transmission interties as needed reduces the overall need for new capacity: 15 GW are avoided
                                                                                                              16
  if load growth is moderate (difference between scenarios 1 and 3), while 348 GW would be avoided if there is a high load growth
  (difference between scenarios 2 and 4).

  New York and New England are the markets with the most non-renewable capacity (see Figure 2 and Appendix 2). Therefore,
  they would have to add the largest amount of renewable capacity, under any scenario, as illustrated in Figure 3 (with data
  in Tables 8a and 8b). For New York and New England, collaboration (adding interconnections) means avoiding significant
  amounts of additional generation capacity.

EAST GRID: GETTING ON AN EFFICIENT DECARBONIZATION TRACK                                                                                                                 17
SCENARIO 1-ISOLATION AND MODERATE LOAD GROWTH      SCENARIO 3-COLLABORATION AND MODERATE LOAD GROWTH

  SCENARIO-2 ISOLATION AND HIGH LOAD GROWTH          SCENARIO-4 COLLABORATION AND HIGH LOAD GROWTH

                                  FIGURE 3. NEW CAPACITY IN THE FIVE SUB-REGIONS IN THE FOUR SCENARIOS

EAST GRID: GETTING ON THE EFFICIENT DECARBONIZATION TRACK                                                18
17,6
                                                                                               Solar
                                                                                                                                          30,2
                                                                 48,6

       GW
            200                                                                      200

                                                                                GW
                                                                                                                                          48
                                17,7                                                                                                               23,2
            150                                                                      150                                                           11,4
                                16,2
                    8                             246,2
                   7,7                                                                                                                             48,6
                                55
            100                                                                      100          8,1           13
                                                                 183,6                                          5,1
                                                                                                                              0,3        155,3
                  66,6                                                                            2,2
                                          3
                                         6,8                                                                                  4,6
                                                                                                                55
            50                           33,2
                                                                                      50                                                           92,9
                                79,1                                                              66,6
                                                                                                                              63,8
                  41,5                                                                                          31,4
                                         27,7
             0                                                                        0           4,7                          0
                   QC           ON       AT           NY          NE                              QC            ON            AT          NY       NE

   TABLE 8A. NEW CAPACITY IN THE FIVE SUB-REGIONS IN IN THE MODERATE LOAD GROWTH SCENARIOS
     Table 8a. New capacity in the five sub-regions in in the moderate load growth scenarios
                  1-Isolation and moderate load growth         3-Collaboration and moderate load growth
                         QC        ON   AT       NY         NE           Total             QC            ON            AT           NY    NE     Total
      Solar              17.3    1.8    4.6     35.1        25           83.7               8.6           0            2.6     33.5      17.5    62.2
      Wind               16.6    11.6   13.8    32.1       33.4          107.5             16.6          14.6          13.8    31.9      37.8    114.7
      Hydro              0.01      –      –      0.5         –            0.5              1.83            –             –     0.5         –      2.3
     Storage               –     0.9    1.4     4.2        1.7            8.1                –           0.5           0.5     2.4        0       3.4
     Gas CC                –     3.1      –     4.3        6.9           14.3                –           2.3            0      5.3       9.1     16.7
     Gas CC
      Total               –
                          34     3.1
                                  17     –
                                         20     4.3
                                                 76        6.9
                                                            67           14.3
                                                                          214               –
                                                                                            27           2.3
                                                                                                          17            0
                                                                                                                        17     5.3
                                                                                                                                74       9.1
                                                                                                                                          64     16.7
                                                                                                                                                  199
       Total             34        17   20      76         67            214               27            17            17          74     64     199
     Gas CC              –      3.1     –       4.3        6.9           14.3              –             2.3           0      5.3        9.1     16.7
      Total8B.
   TABLE
     Table      34 capacity
               NEW
           8b. New    17 in20
                   CAPACITY IN
                            the THE76sub-regions
                                five FIVE 67     in214
                                           SUB-REGIONS    IN27
                                                    the high        17 LOAD
                                                              THE growth
                                                             load  HIGH   17 GROWTH
                                                                                 74 SCENARIOS
                                                                         scenarios    64    199
                     2 Isolation and high load growth
                                                    17            4 Collaboration and high load growth
                QC capacity
    Table 8b. New       ON in the
                               AT fiveNY       NE in Total
                                        sub-regions            QC growth
                                                      the high load    ON scenarios
                                                                               AT     NY      NE    Total
       Solar          41.5 2 Isolation
                              79.1 27.7      246.2
                                        and high  load183.6
                                                       growth 578.2                      4.74 Collaboration
                                                                                                 31.4      0 and155.3    92.9
                                                                                                                 high load      284.4
                                                                                                                           growth
      Wind            66.6
                      QC       55
                              ON      33.2
                                      AT       48
                                              NY       48.6
                                                       NE     251.3
                                                             Total                      66.6
                                                                                        QC       ON55    63.8
                                                                                                         AT       48
                                                                                                                 NY      48.6
                                                                                                                         NE      282
                                                                                                                               Total
      Hydro
      Solar            4.4     0.9     0.1     0.5
                     41.5 79.1 27.7 246.2 183.6 578.2   0.2     6.1                      4.1
                                                                                        4.7       0.9
                                                                                                31.4      0.1
                                                                                                          0      0.5     0.2
                                                                                                               155.3 92.9 284.4  5.8
     Storage
      Wind             7.7
                     66.6     16.2
                              55       6.8
                                     33.2      66
                                              48        44
                                                      48.6    140.8
                                                             251.3                       2.2
                                                                                       66.6       5.1 63.8
                                                                                                  55      4.6   30.2
                                                                                                                 48      11.4 282
                                                                                                                        48.6    53.5
     Gas
     HydroCC            8
                      4.4     17.7 0.1
                              0.9       3     14.5
                                              0.5      16.5
                                                       0.2     59.7
                                                               6.1                       8.1
                                                                                        4.1        13
                                                                                                 0.9      0.3
                                                                                                         0.1    17.6
                                                                                                                0.5      23.2
                                                                                                                         0.2    62.3
                                                                                                                                5.8
      Total
    Storage           128 16.2
                      7.7     169 6.8  71     375
                                              66       293 140.8
                                                       44     1,036                         86
                                                                                           2.2           106
                                                                                                         5.1            69
                                                                                                                       4.6     252
                                                                                                                              30.2        176
                                                                                                                                         11.4     688
                                                                                                                                                 53.5
    Gas CC             8     17.7      3     14.5     16.5    59.7                         8.1           13            0.3    17.6       23.2    62.3
       Totalthe current
      From       128 10  169GW of  71intertie
                                           375capacity
                                                     293in northeastern
                                                                 1,036      86North106America69 (Appendix
                                                                                                     252 2),176  17 GW688of
      additional transmission   capacity   would    be  required     under  the  moderate   load  growth    scenario,  and
   From the current 10 GW of intertie capacity in northeastern North America (Appendix 2), 17 GW of additional transmission
      60 GW
     From
   capacitytheunder  the10
               current
             would
                         high
                           GWload
                    be required
                                      growth
                                 ofunder
                                     intertie  scenario.
                                          thecapacity
                                                moderate  inInload
                                                                bothgrowth
                                                                      cases,scenario,
                                                              northeastern   most
                                                                              NorthofAmerica
                                                                                      these   additional
                                                                                       and 60(Appendix
                                                                                                           transmission
                                                                                                GW under 2), the17       oflines
                                                                                                                    GWload
                                                                                                                  high        growth scenario.
      would  connect   Québec   to  its neighbors,   as  detailed    in Table 9. This is unsurprising,
     additional transmission capacity would be required under the moderate load growth scenario, and     as  Québec   already
      possesses
   In60both
        GWcases, 176
             under    TWh
                   most
                    the  ofof
                        high   storage
                            these
                              load       capacity,
                                     additional
                                     growth         which  In could
                                                 transmission
                                              scenario.               be used
                                                               bothlines  would
                                                                     cases,    toconnect
                                                                            most  balance
                                                                                  of these the
                                                                                          Québecadditional    intermittent
                                                                                                    to itstransmission
                                                                                             additional     neighbors,  as   detailed in Table 9.
                                                                                                                         lines
      generation  capacity, installed    mostly  in New     York  and   New  England.
     would connect Québec to its neighbors, as detailed in Table 9. This is unsurprising, as Québec already
   This is unsurprising, as Québec already possesses 176 TWh of storage capacity, which could be used to balance the additional
    possesses  176 TWh
     Table 9. Total      of storage
                    required        capacity,
                              additional      which
                                         intertie    could (GW)
                                                  capacity be used to balance the additional intermittent
   intermittent generation capacity, installed mostly in New York and New England.
    generation  capacity,3-Moderate
              Scenario    installed mostly
                                      loadingrowth
                                              New York and New England.Scenario 4-High load growth
   TABLE
    Table 9.  QC
              TOTAL
          9. Total   ON    AT
                      REQUIRED
                   required      NY intertie
                                       NE Total
                                ADDITIONAL
                            additional      INTERTIE       QC (GW)
                                                       CAPACITY
                                             capacity (GW)      ON                                   AT     NY     NE                            Total
      ON          3.7    – 3-Moderate
                  Scenario     –                3.7
                                    – load– growth                                    10.4 Scenario
                                                                                              –       –
                                                                                                    4-High   – growth
                                                                                                           load     –                             10.4
       AT         1.5 ON
                  QC     – AT  – NY – NE 1.8 Total
                                                3.3                                   11.1
                                                                                       QC   ON–     AT–    NY–   14.9
                                                                                                                  NE                              26.0
                                                                                                                                                 Total
      NY
      ON          5.0
                  3.7   1.3
                         –    ––   ––    ––     6.3
                                               3.7                                    12.0
                                                                                      10.4   7.0
                                                                                             –       ––     ––     ––                             19.1
                                                                                                                                                 10.4
      NE
      AT          3.7 ––
                  1.5         –– 0.1
                                   – 1.8  –     3.7
                                               3.3                                     1.5
                                                                                      11.1   ––      ––     3.1
                                                                                                            –       –
                                                                                                                 14.9                             4.5
                                                                                                                                                 26.0
     Total
     NY           14.4 1.3
                  5.0   1.3 ––     0.1
                                   –     1.8
                                         –     17.0
                                               6.3                                     35.0 7.0
                                                                                      12.0   7.0     ––     3.1
                                                                                                            –     14.9
                                                                                                                   –                              60.0
                                                                                                                                                 19.1
      NE          3.7    –    – 0.1 –          3.7                                    1.5    –       –     3.1     –                             4.5
    Total
     Figure 414.4       1.3 the–seasonal
               illustrates            0.1 balancing
                                            1.8 17.0 role played by 35.0      7.0the moderate
                                                                      Québec in         –      3.1     14.9 scenarios
                                                                                                load growth     60.0
     (scenarios 1-Isolation and 3-Collaboration). We see imports peaking in the spring and in the fall when
     consumption
    Figure            is lower
            4 illustrates  the due  to thebalancing
                                seasonal   low cooling
                                                    roleand  heating
                                                          played      needs. During
                                                                 by Québec           the winter,
                                                                             in the moderate      exports
                                                                                               load growthfrom  Québec
                                                                                                             scenarios
     help  supply  the   high electrified heating needs.   Under  collaboration, with more  interties, this
    (scenarios 1-Isolation and 3-Collaboration). We see imports peaking in the spring and in the fall when  balancing
EAST role is amplified.
      GRID:    GETTING These
                           ON ANpatterns   are similar inand
                                                          theheating
                                                              high load  growth  cases.
    consumption      is lower  due EFFICIENT
                                   to the low    DECARBONIZATION
                                               cooling                 TRACK
                                                                     needs.  During the winter, exports from Québec                                       19

    help supply the high electrified heating needs. Under collaboration, with more interties, this balancing
Figure 4 illustrates the seasonal balancing role played by Québec in the moderate load growth scenarios (scenarios
   1-Isolation and 3-Collaboration). We see imports peaking in the spring and in the fall when consumption is lower due to the
  Figure  4. Weekly
   low cooling       average
               and heating   of energy
                           needs.  Duringimports  and exports
                                           the winter, exports,from
                                                                 in GWh,
                                                                     Québecin Québec  overthe
                                                                              help supply  a year
                                                                                              high (moderate
                                                                                                   electrified heating needs. Under
  load  growth)
   collaboration, with more interties, this balancing role is amplified. These patterns are similar in the high load growth cases.
                   Scenario 1-Isolation                                   Scenario 3-Collaboration

   FIGURE 4. WEEKLY AVERAGE OF ENERGY IMPORTS AND EXPORTS, IN GWH, IN QUÉBEC OVER A YEAR
  Figure 4. Weekly average of energy imports and exports, in GWh, in Québec over a year (moderate
   (MODERATE LOAD GROWTH)
  load growth)
                Scenario 1-Isolation                            Scenario 3-Collaboration

  On a daily basis, we can also observe how hydropower storage from Québec helps use available energy
  surpluses from neighbouring jurisdictions, especially outside of the morning and evening peak hours
  (Figure 5). Québec imports as much as possible, up to the transmission limit visible at 5 GW on the left
  panel of Figure 5. Exports from Québec mostly happen during the evening peak (at about 6 pm), when
  On  a daily
  solar        basis, we
        generation       can and
                      fades, alsoresidential
                                  observe how   hydropower
                                             demand   rises. storage from Québec helps use available energy
  surpluses
   FIGURE 5.  from  neighbouring
                 HOURLY   ENERGY jurisdictions,
                                   IMPORTS ANDespecially
                                                  EXPORTS, outside of the
                                                             IN GWH,    INmorning
                                                                            QUÉBEC and
                                                                                    IN evening
                                                                                        A SUMMERpeak
                                                                                                   DAYhours
  Figure
  (Figure 5. Hourly
          5). Québec  energy  imports and  exports, in GWh,  in Québec   in a summer  day  (moderate  load
   (MODERATE     LOAD imports
                        GROWTH)as much as possible, up to the transmission limit visible at 5 GW on the left
  growth)
  panel of Figure 5. Exports from Québec mostly happen during the evening peak (at about 6 pm), when
                    Scenario 1-Isolation                                  Scenario 3-Collaboration
  solar generation fades, and residential demand rises.

  Figure 5. Hourly energy imports and exports, in GWh, in Québec in a summer day (moderate load
  growth)
                 Scenario 1-Isolation                             Scenario 3-Collaboration

  2.2.2 Total system costs and its regional distribution
   On a daily basis, we can also observe how hydropower storage from Québec helps use available energy surpluses from
  The value of increased collaboration, in the form of additional transmission interties, materializes
   neighbouring
  through   lowerjurisdictions,
                    system costs.especially
                                       Table 10 outside
                                                  providesofthetheannual
                                                                   morning    and evening
                                                                           system            peak hours
                                                                                     costs under         (Figure
                                                                                                   the four       5). Québec
                                                                                                             scenarios. Theseimports as much as
   possible,
  costs       up to
         include     theannualized
                   the    transmission    limit
                                       value  ofvisible
                                                 all theat  5 GW on themade
                                                          investments      left panel  of Figure 5.
                                                                                 (in generation     Exports transmission
                                                                                                   capacity,  from Québec mostly happen during
  2.2.2
  interties  Total
             and peak
   the evening    storage)system
                              plus the
                         (at about       costs
                                         operating
                                     6 pm),           and    its    regional
                                                       costsgeneration
                                              when solar     of the power    systems.
                                                                        fades,        distribution
                                                                                        These costs
                                                                                 and residential      exclude
                                                                                                   demand       transmission
                                                                                                            rises.
  The value   of increased     collaboration,    in
  and distribution costs within states and provinces.the form   of additional   transmission    interties, materializes
  through lower system costs. Table 10 provides the annual system costs under the four scenarios. These
  The value
  costs       of collaboration
        include   the annualized    is value
                                       evident:  a savings
                                              of all          of $3.4 billion
                                                     the investments     madeper (inyear  in the moderate
                                                                                     generation   capacity, load   growth case
                                                                                                             transmission
  (6% saving),
  interties and and    a $25.6B
                  storage)   plus saving    in the high
                                   the operating          load
                                                      costs     growth
                                                             of the powercase  (14%). These
                                                                             systems.   These reductions    of total
                                                                                                costs exclude        system
                                                                                                                transmission
  costs
EAST     result
  andGRID:      directly
               GETTING
      distribution         from   lower
                      costsONwithin       requirements
                                AN EFFICIENT                for  new generation
                                                     DECARBONIZATION TRACK
                                       states and provinces.                        and  storage   capacity.                                    20
You can also read