A European comparison of electricity and natural gas prices for residential and small professional consumers - CREG
←
→
Page content transcription
If your browser does not render page correctly, please read the page content below
A European
               comparison of
               electricity and natural
               gas prices for
28 June 2018
               residential and small
Final report
               professional
               consumers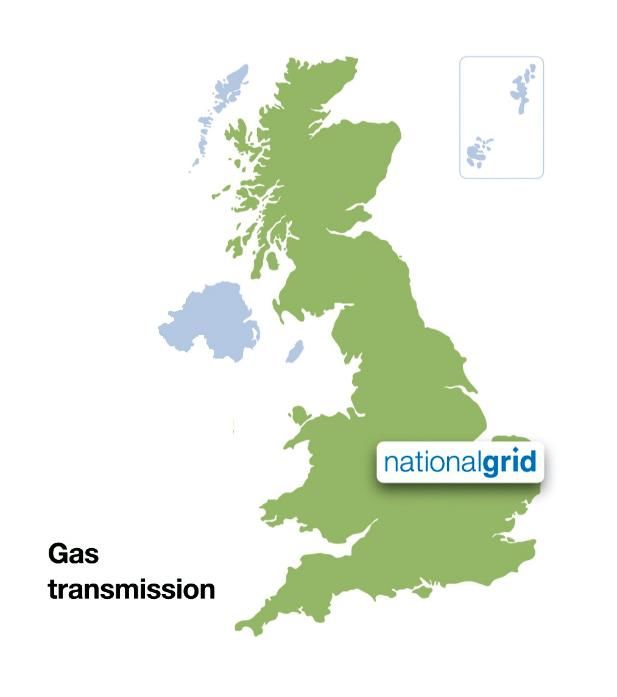
Table of Contents
1. Executive Summary ............................................................................6
     1.1. Executive Summary – English .........................................................................6
     1.2. Executive Summary – Nederlands ................................................................. 8
     1.3. Executive Summary – Français ..................................................................... 10
2. Introduction ..................................................................................... 13
3. Description of the dataset ................................................................ 15
     3.1. General Assumptions ..................................................................................... 15
     3.2. Consumer profiles .......................................................................................... 16
     3.3. Electricity: Countries/zone(s) identified ...................................................... 17
     3.4. Natural gas: Countries/zone(s) identified ................................................... 24
     3.5. Commodity component ................................................................................ 29
4. Electricity: Detailed description of the prices, price components and
assumptions ......................................................................................... 33
     4.1. Belgium ...........................................................................................................33
     4.2. Germany ........................................................................................................ 38
     4.3. France ............................................................................................................ 44
     4.4. The Netherlands ............................................................................................ 47
     4.5. United Kingdom ............................................................................................. 51
5. Natural gas: Detailed description of the prices, price components
and assumptions .................................................................................. 56
     5.1. Belgium ...........................................................................................................56
     5.2. Germany ........................................................................................................ 60
     5.3. France ............................................................................................................ 63
     5.4. The Netherlands.............................................................................................65
     5.5. United Kingdom ............................................................................................ 68
6. Presentation and interpretation of results ....................................... 73
     6.1. Profile E1 (Electricity) .................................................................................... 73
     6.2. Profile E2 (Electricity) ................................................................................... 76
     6.3. Profile G1 (Natural gas) ................................................................................ 80
     6.4. Profile G2 (Natural gas) ............................................................................... 83
7. Conclusion ....................................................................................... 87
     7.1. Electricity ........................................................................................................87
     7.2. Natural gas .....................................................................................................87
     7.3. Electricity and natural gas compared .......................................................... 88

CREG – A European comparison of electricity and natural gas prices for residential and small professional
consumers
28 June 2018
[1]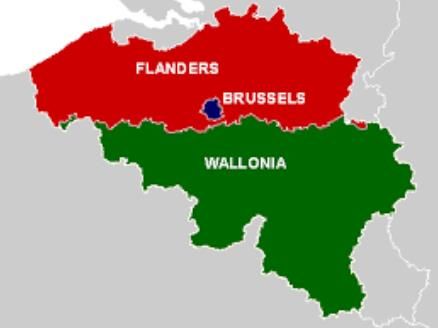
Figures
Figure 1 – Regions of Belgium .................................................................................... 17
Figure 2 – TSO regions in Germany ........................................................................... 19
Figure 3 – DSO regions in the Netherlands ............................................................... 21
Figure 4 – DSO zones of the United Kingdom .......................................................... 22
Figure 5 – Regions of Belgium ................................................................................... 24
Figure 6 – DSO regions in the Netherlands ...............................................................27
Figure 7 – TSO region in the United Kingdom ......................................................... 28
Figure 8 – Total annual invoice in €/year (profile E1) ..............................................73
Figure 9 – Electricity price by component in €/year (profile E1) ............................ 74
Figure 10 – Electricity price by component in c€/kWh (profile E1) ....................... 74
Figure 11 – Proportional component analysis (profile E1) ........................................75
Figure 12 – Total annual invoice in €/year (profile E2) ........................................... 76
Figure 13 – Electricity price by component in €/year (profile E2) ........................... 77
Figure 14 - Electricity price by component in c€/kWh (profile E2) ........................ 78
Figure 15 – Proportional component analysis (profile E2) ...................................... 78
Figure 16 – Total annual invoice in €/year (profile G1) ........................................... 80
Figure 17 – Natural gas price by component in €/year (profile G1) ......................... 81
Figure 18 – Natural gas price per component in c€/kWh (profile G1)..................... 81
Figure 19 – Proportional component analysis (profile G1) ...................................... 82
Figure 20 – Total annual invoice in €/year (profile G2) .......................................... 83
Figure 21 – Natural gas price by component in €/year (profile G2) ....................... 84
Figure 22 –Natural gas price by component in c€/kWh (profile G2) ..................... 84
Figure 23 – Proportional component analysis (profile G2) ..................................... 85

Tables
Table 1 – Description of electricity profiles ................................................................ 16
Table 2 – Description of natural gas profiles ............................................................. 16
Table 3 – Market shares of Flemish electricity DSOs ................................................ 17
Table 4 – Market shares of Walloon electricity DSOs ............................................... 18
Table 5 – Normalised market shares of German electricity DSOs .......................... 20
Table 6 – Market shares of Dutch electricity DSOs ................................................... 21
Table 7 - Market shares of United Kingdom electricity DSOs.................................. 23
Table 8 – Market shares of Flemish natural gas DSOs ............................................ 25
Table 9 – Market shares of Walloon natural gas DSOs ............................................ 25

CREG – A European comparison of electricity and natural gas prices for residential and small professional
consumers
28 June 2018
[2]

Table 10 – Normalised market shares of German natural gas DSOs ...................... 26
Table 11 – Market shares of Dutch natural gas DSOs ................................................27
Table 12 – Market shares of United Kingdom natural gas DSOs............................. 29
Table 13 – Defining the number of products ............................................................ 29
Table 14 – Weights attached to the selected products for E1 and E2 in Belgium ... 33
Table 15 – Selected products for profile E1 in Belgium ............................................ 34
Table 16 – Selected products for profile E2 in Belgium ........................................... 34
Table 17 – Overview of adoption of new tariffs by regional regulators ................... 35
Table 18 – Overview of distribution taxes and levies for electricity .........................37
Table 19 – Weights attached to the selected products for profiles E1 and E2 in
Germany ...................................................................................................................... 38
Table 20 – Selected products for profile E1 in Germany .......................................... 39
Table 21 – Selected products for profile E2 in Germany .......................................... 40
Table 22– Weights attached to the selected products for profiles E1 and E2 in France
..................................................................................................................................... 44
Table 23 – Selected products for profile E1 in France .............................................. 44
Table 24 – Selected products for profile E2 in France ............................................. 45
Table 25– Normalised market shares in the Netherlands ....................................... 47
Table 26– Weights attached to the selected products for profile E1 in the
Netherlands ................................................................................................................. 47
Table 27– Weights attached to the selected products for profile E2 in the
Netherlands ................................................................................................................. 48
Table 28 – Selected products for profile E1 in the Netherlands .............................. 48
Table 29 – Selected products for profile E2 in the Netherlands .............................. 48
Table 30 – Tariffs for Energy Tax (Regulerende Energie Belasting (REB)) ........... 49
Table 31 – Tariffs for ODE Levy (Opslag Duurzame Energie (ODE)) ..................... 50
Table 32 – Electricity supply market shares by company (Q3 2017) for residential
consumers ................................................................................................................... 52
Table 33 – Weights attached to the selected products for profiles E1 and E2 in the
UK ................................................................................................................................ 52
Table 34 – Selected products for profiles E1 and E2 in the United Kingdom ......... 53
Table 35 – Weights attached to the selected products for profiles G1 and G2 in
Belgium ....................................................................................................................... 56
Table 36 – Selected products for profile G1 in Belgium ............................................57
Table 37 – Selected products for profile G2 in Belgium ............................................57
Table 38 – Transmission cost for natural gas in Belgium .........................................57
Table 39 – Overview of distribution taxes and levies for natural gas ...................... 59
Table 40 – Weights attached to the selected products for profiles G1 and G2 in
Germany ...................................................................................................................... 60

CREG – A European comparison of electricity and natural gas prices for residential and small professional
consumers
28 June 2018
[3]
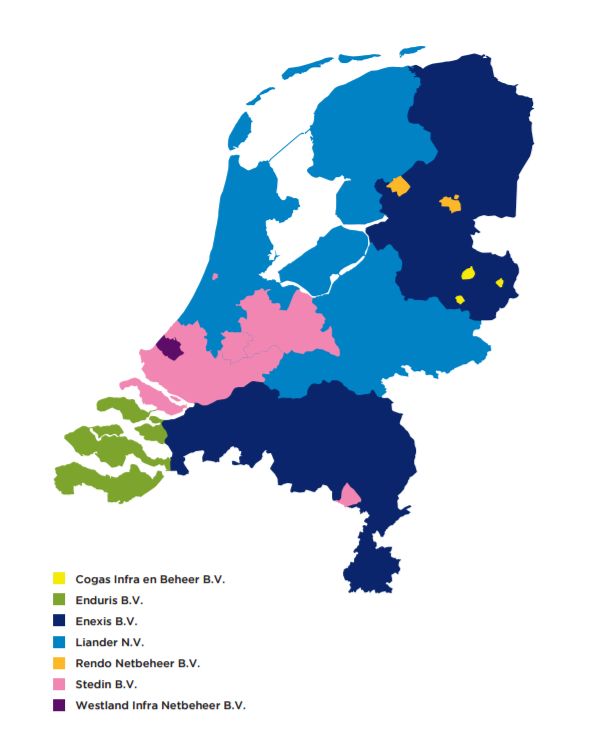
Table 41 – Selected products for profile G1 in Germany ........................................... 61
Table 42 – Selected products for profile G2 in Germany .......................................... 61
Table 43– Weights attached to the selected products for profiles G1 and G2 in France
..................................................................................................................................... 63
Table 44 – Selected products for profile G1 in France ............................................. 63
Table 45 – Selected products for profile G2 in France ............................................. 64
Table 46– Normalised market shares in the Netherlands ....................................... 65
Table 47– Weights attached to the selected products for profiles G1 and G2 in the
Netherlands ................................................................................................................. 65
Table 48 – Selected products for profile G1 in the Netherlands .............................. 66
Table 49 – Selected products for profile G2 in the Netherlands ............................. 66
Table 50 – Tariffs for Energy Tax (Regulerende Energiebelasting (REB)) ............. 67
Table 51 – Tariffs for ODE levy (Opslag duurzame energie (ODE)) ........................ 67
Table 52 – Natural gas supply market shares by company (Q3 2017) for domestic
consumers ................................................................................................................... 69
Table 53 – Weights attached to the selected products for profiles G1 and G2 in the
United Kingdom ......................................................................................................... 69
Table 54 – Selected products for profiles G1 and G2 in the United Kingdom ........ 70

CREG – A European comparison of electricity and natural gas prices for residential and small professional
consumers
28 June 2018
[4]
Executive
Summary
1. Executive Summary
1.1. Executive Summary – English
This study compares the energy prices of two residential and two small professional
consumer profiles between the three Belgian regions and four other countries
(Germany, France, the Netherlands and the United Kingdom) in February 2018. The
comparison deals with four components for residential consumers and three
components for small professional consumers.
The consumption profiles are:
     •    Residential consumer:
                o    Electricity: 3.500 kWh/year, single meter, low-voltage network;
                o    Natural gas: 23.260 kWh/year.
     •    Professional consumer:
                o    Electricity: 50.000 kWh/year, single meter, low-voltage network;
                o    Natural gas: 100.000 kWh/year.
The components are:
     •    Component 1: pure energy component (electricity/natural gas) excluding
          any other costs such as, for example in Belgium, the cogeneration &
          renewable energy contributions (component 3);
     •    Component 2: network component (transport and distribution) excluding
          any other costs, such as, for example in Belgium, costs related to PSOs
          (component 3);
     •    Component 3: all other costs charged to the consumer and which cannot be
          attributed to the first two components (taxes, levies, costs related to public
          service obligations (PSOs), costs related to efficient energy usage (EEU),
          etc.);
     •    Component 4: VAT (only for residential consumers)
The price comparison is preceded by an elaborate description of the build-up of
prices and price components. General hypotheses are adopted and their application
across different countries is carefully described in order to maximize the objectivity
of the comparison. Energy costs are analysed from the bottom-up, and the different
price components are described in a detailed way in order to offer a clear view of the
origins of the observed results.
For both electricity and natural gas, this report notes that the components vary
greatly between the different regions and countries under study, and especially the
ways in which the network costs are determined and tax regimes showed to be very
different in each country.
For electricity large differences between the regions and zones under study were
found. For both residential and small professional consumers, France has the lowest
annual invoice, while the annual invoice in Germany is eighty percent higher. The
Netherlands and the United Kingdom have an annual invoice that is slightly higher
than in France. Belgium is the second most expensive country, with large differences
between the regions: the Flemish Region presents the highest annual invoice and
approaches German levels, followed by the Walloon Region and the Brussels Capital
Region.
As a result of the very different network costs and taxes, the proportion of each
component shows strong differences between countries and regions.
The results of the comparison for natural gas differ. For residential consumers, the
United Kingdom is the least expensive country, while the Netherlands is the most

CREG – A European comparison of electricity and natural gas prices for residential and small professional
consumers
28 June 2018
[6]
expensive country. Belgium is the second cheapest country, even though significant
differences between the regions are observed. For small professional consumers, the
Flemish Region shows the lowest total invoice of all countries and regions under
study. However, the average invoice from the Belgian regions is higher than the
invoice in the United Kingdom, due to the higher prices in the Brussels Capital
Region and to an even larger extent the Walloon Region.
The report ends with some conclusions:
• Belgian consumers are presented with a high electricity cost, which can be partly
explained by network costs but mainly by taxes, surcharges, certificate schemes
(component 3). On the other hand, Belgium has relatively low natural gas prices.
There exist significant differences between the regions for both electricity and
natural gas.
• In general, small professional consumers pay less per kWh than residential
consumers, both for electricity and natural gas. This is partly explained by the
VAT, which is not a real cost for small professional consumers, but small
professional consumers generally also pay a lower commodity and network
component.
• There are major differences between countries for both electricity and natural
gas. However, the differences are relatively smaller for small professional
consumers than for residential consumers.
• Finally, having a relatively low electricity cost does not imply a relatively low
cost for natural gas and vice versa. The link even seems to go in the opposite
direction: countries or regions with a relatively low cost for electricity generally
have a relatively high cost for natural gas and vice versa (with the exception of
the United Kingdom).
CREG – A European comparison of electricity and natural gas prices for residential and small professional
consumers
28 June 2018
[7]1.2. Executive Summary – Nederlands
Deze studie vergelijkt de energieprijzen van twee residentiële en twee kleine
professionele verbruikers tussen de drie Belgische regio’s en vier andere landen
(Duitsland, Frankrijk, Nederland en het Verenigd Koninkrijk) in februari 2018. De
vergelijking behandelt vier componenten voor de residentiële verbruikers en drie
componenten voor kleine professionele verbruikers.
De consumptieprofielen zijn:
• Residentiële verbruiker:
o Elektriciteit: 3.500 kWh/jaar, enkelvoudige meter,
laagspanningsnet;
o Aardgas: 23.260 kWh/jaar.
• Professionele verbruiker:
o Elektriciteit: 50.000 kWh/jaar, enkelvoudige meter,
laagspanningsnet;
o Aardgas: 100.000 kWh/jaar.
De verschillende componenten die worden vergeleken zijn:
• Component 1: Zuivere energiecomponent (elektriciteit/aardgas), exclusief
enige andere kosten zoals bijvoorbeeld in België de bijdragen WKK & GS
(component 3);
• Component 2: Netvergoedingen (transport & distributie), exclusief enige
andere kosten zoals bijvoorbeeld in België kosten in verband met openbare
dienstverplichtingen (ODV’s) (component 3);
• Component 3: Alle andere kosten die aan de verbruiker worden
aangerekend en die niet tot de vorige 2 componenten kunnen worden
gerekend (taksen, heffingen, kosten met betrekking tot ODV’s, kosten met
betrekking tot rationeel energie gebruik (REG),…;
• Component 4: BTW (enkel voor residentiële verbruikers)
De prijsvergelijking wordt voorafgegaan door een uitgebreide beschrijving van de
opbouw van de prijscomponenten. Om een zo objectief mogelijke vergelijking
te realiseren worden een aantal algemene hypothesen aangenomen en de toepassing
ervan wordt zorgvuldig beschreven. De totale energiekost wordt bottom-up
geanalyseerd en de verschillende componenten worden in detail beschreven om een
duidelijk zicht te houden op de oorsprong van de eindresultaten.
Voor zowel elektriciteit als aardgas stelt dit rapport vast dat de opbouw sterk
uiteenloopt tussen de verschillende regio’s en landen onder studie, door een grote
variëteit aan manieren waarop de netwerkkosten worden vastgesteld, en de
belastingregimes die in elk land verschillend zijn.
De resultaten van de vergelijking voor elektriciteit tonen aan dat zeer grote
verschillen bestaan tussen de regio’s en zones onder studie. Voor zowel residentiële
als kleine professionele verbruikers heeft Frankrijk de goedkoopste prijzen, terwijl
prijzen in Duitsland tachtig procent hoger liggen. Nederland en het Verenigd
Koninkrijk hebben prijzen die licht hoger zijn dan deze van Frankrijk. België is het
op één na duurste land, met grote verschillen tussen de gewesten: het Vlaams
Gewest heeft de duurste prijzen en benadert het niveau van Duitsland, gevolgd door
het Waals en het Brussels Hoofdstedelijk Gewest.
Als gevolg van de sterk verschillende netwerkkosten en belastingen vertoont de
opbouw van de prijzen sterke verschillen tussen de landen en regio’s.
De resultaten van de vergelijking voor aardgas verschillen. Hier is het Verenigd
Koninkrijk het goedkoopste land voor residentiële verbruikers, terwijl Nederland
het duurste land is. België is het op één na goedkoopste land, met ook hier
CREG – A European comparison of electricity and natural gas prices for residential and small professional
consumers
28 June 2018
[8]verschillen tussen de gewesten. Wat betreft kleine professionele verbruikers is het
Vlaams Gewest de goedkoopste regio van alle landen en regio’s onder studie. De
gemiddelde factuur van de Belgische gewesten is echter duurder dan de factuur in
het Verenigd Koninkrijk, door de hogere prijzen in het Brussels Hoofdstedelijk
Gewest en in nog sterkere mate het Waals Gewest.
Het rapport eindigt met enkele conclusies:
• België heeft hoge elektriciteitsprijzen, wat gedeeltelijk door netwerkkosten
maar vooral door belastingen, heffingen, certificaten (component 3) kan
worden verklaard. Daarentegen heeft België relatief lage aardgasprijzen. Voor
zowel elektriciteit als aardgas bestaan significante verschillen tussen de
gewesten.
• In het algemeen betalen kleine professionele verbruikers minder per kWh dan
residentiële verbruikers, zowel voor elektriciteit als aardgas. Dit wordt
gedeeltelijk verklaard door het ontbreken van de BTW, maar kleine
professionele verbruikers betalen in het algemeen ook minder voor de
commodity en netwerkcomponent.
• Voor zowel elektriciteit als aardgas bestaan grote verschillen tussen de
landen. De verschillen zijn echter relatief kleiner voor kleine professionele
verbruikers dan voor residentiële verbruikers.
• Ten slotte is het opmerkelijk dat het hebben van een relatief lage
elektriciteitskost geen relatief lage kost voor aardgas of omgekeerd impliceert,
en dat het verband eerder in de omgekeerde richting lijkt te gaan, en dat
landen of regio’s met een relatief lage kost voor elektriciteit eerder een relatief
hoge kost voor aardgas hebben en omgekeerd (met uitzondering van het
Verenigd Koninkrijk).
CREG – A European comparison of electricity and natural gas prices for residential and small professional
consumers
28 June 2018
[9]1.3. Executive Summary – Français
Cette étude compare les prix de l'énergie de deux profils de consommateurs
résidentiels et deux profils de petits consommateurs professionnels entre les trois
régions belges et quatre autres pays (Allemagne, France, les Pays-Bas et le Royaume-
Uni). L’étude compare quatre composantes pour les consommateurs résidentiels et
trois composantes pour les petits consommateurs professionnels.
Les profils de consommation sont:
• Consommateur résidentiel :
o Electricité : 3 500 kWh/an, compteur simple, réseau de basse
tension;
o Gaz naturel : 23 260 kWh/an.
• Consommateur professionnel :
o Electricité : 50 000 kWh/an, compteur simple, réseau de basse
tension ;
o Gaz naturel : 100 000 kWh/an.
Les différentes composantes de la facture totale sont :
• Composante 1 : Composante énergétique pure (électricité/gaz naturel), à
l’exclusion de tous les autres coûts comme en Belgique la cotisation
cogénération et énergie renouvelable (composante 3) ;
• Composante 2 : Tarifs de réseau (transport et distribution), à l’exclusion de
tous les autres coûts comme en Belgique les coûts liés aux obligations de
service public (OSP) (composante 3) ;
• Composante 3 : Tous les autres coûts facturés au consommateur et ne
relevant pas des deux composantes précédentes (taxes, prélèvements, coûts
liés aux OSP, coûts liés à l’utilisation rationnelle de l’énergie (URE), etc.);
• Composante 4 : TVA (uniquement pour les consommateurs résidentiels)
La comparaison des prix est précédée par une description élaborée des
composantes détaillées du prix et de la méthodologie suivie. Des hypothèses
générales ont été adoptées et leur application à travers différents pays est
soigneusement décrite afin de maximiser l'objectivité de la comparaison. Le coût
total de l’énergie est analysé et reconstruit complètement, tout en décrivant les
différentes composantes de façon détaillée afin d’offrir une vue aussi claire que
possible sur l’origine des résultats observés.
Pour ce qui concerne l'électricité et le gaz naturel, ce rapport note que les
composantes varient considérablement entre les différentes régions et pays étudiés,
et notamment que les modalités de détermination des coûts de réseau et des régimes
fiscaux sont très différents selon les pays.
Pour l'électricité, de grandes différences entre les régions et pays étudiés ont
été identifiées. Pour les consommateurs résidentiels et les petits
consommateurs professionnels, la facture annuelle est la plus basse en France,
tandis que la facture annuelle en Allemagne est supérieure de 80% à celle en France.
Les Pays-Bas et le Royaume-Uni ont, quant à eux, une facture annuelle légèrement
supérieure à celle en France. Après l’Allemagne, la Belgique est le pays le plus cher,
avec de grandes différences entre les régions: la Région flamande a la facture
annuelle la plus élevée (s’approchant des niveaux de prix allemands), suivie par la
Région wallonne et la Région de Bruxelles-Capitale.
En conséquence des coûts de réseau et des taxes très différents, la proportion de
chaque composante montre de fortes différences entre les pays et les régions.
CREG – A European comparison of electricity and natural gas prices for residential and small professional
consumers
28 June 2018
[10]Les résultats de la comparaison pour le gaz naturel diffèrent toutefois. Pour les
consommateurs résidentiels, le Royaume-Uni est le pays le moins cher, tandis que
les Pays-Bas sont le pays le plus cher. Après le Royaume-Uni, la Belgique est le pays
le moins cher, bien qu'ici aussi, des différences significatives existent entre les
régions. Pour les petits consommateurs professionnels, la Région flamande est la
région la moins chère de tous les pays et régions étudiés. Cependant, la facture
moyenne des régions belges est supérieure à la facture au Royaume-Uni, parce que
la facture de la Région Wallonne, et celle en Région Bruxelles-Capitale, dans une
moindre mesure, sont plus élevées.
Le rapport se termine par quelques conclusions:
• La Belgique a des factures élevées d'électricité, ce qui peut s'expliquer en
partie par les coûts du réseau mais surtout par les taxes, surcharges et
certificats (composante 3). A l'inverse, la Belgique a des factures de gaz
naturel relativement basses. A une échelle plus petite, il existe également des
différences significatives entre les régions pour l'électricité et le gaz naturel.
• En général, les petits consommateurs professionnels paient moins par
kWh que les consommateurs résidentiels, tant pour l'électricité que pour le
gaz naturel. Cela s'explique en partie par la TVA, qui n'est pas un coût réel
pour les petits consommateurs professionnels, qui paient généralement
moins pour les produits et les réseaux.
• Il existe des différences majeures entre les pays pour ce qui concerne
l'électricité et le gaz naturel. Cependant, les différences sont relativement plus
petites pour les petits consommateurs professionnels que pour les
consommateurs résidentiels.
• Enfin, avoir un coût de l'électricité relativement bas n'implique pas que le
coût soit également bas pour le gaz naturel et vice versa.
La corrélation semble même aller dans la direction opposée: les pays ou les
régions où le coût de l'électricité est relativement faible ont généralement un
coût relativement élevé pour le gaz naturel et vice versa (à l’exception du
Royaume-Uni).
CREG – A European comparison of electricity and natural gas prices for residential and small professional
consumers
28 June 2018
[11]2. Introduction
2. Introduction
This report is commissioned by the CREG, the Belgian federal regulator for Energy
and natural Gas. In the framework of the CREG’s larger mission of supervising
transparency and competition on the market, ensuring market conditions serve the
public     interest  and    safeguarding    consumers’     essential    interests,
PricewaterhouseCoopers was asked to conduct a study comparing energy prices for
residential and small professional consumers in Belgium and the neighbouring
countries.
The purpose of this study is to compare the natural gas and electricity prices, in total
as well as per component, invoiced to residential and small professional consumers
in the three Belgian regions (Wallonia, Flanders, Brussels Capital Region) with those
in Germany, France, the Netherlands and the United Kingdom. This report contains
electricity and natural gas prices observed in February 2018. In addition to this price
analysis, the purpose of this study is also to make an assessment of the impact of the
observed price differences in Belgium.
This report consists of two different sections and general conclusions.
The first section (described in chapter 3 to 5) consists in the actual price
comparison. In terms of methodology, we built up the energy cost from the bottom
up, identifying four main components: the commodity price, the network cost, all
other costs exclusive VAT (taxes, levies and certificate schemes) and VAT. In terms
of structure, this report first describes the dataset and then the general assumptions
in terms of consumer profiles and consumer behaviour, a detailed methodology on
how supplier products are selected, completed by an overview of the different zones
identified in all five countries under review. We then move on to a detailed
description of the deconstructed energy cost for electricity and natural gas, carefully
describing the observed regulatory framework, where we pay attention to certain
trends regarding electricity and natural gas prices in Belgium and the neighbouring
countries.
In the second section (described in chapter 6), we present the results per
consumer profile, using a double analysis approach: how energy prices in Belgium
compare to the other four countries, and how the four components of the energy
price explain the observed final results.
The report ends with several general conclusions that can be drawn from the
analysis.

CREG – A European comparison of electricity and natural gas prices for residential and small professional
consumers
28 June 2018
[13]
3. Description of
the dataset
3. Description of the dataset
3.1. General Assumptions
The general assumptions, applicable to all compared consumer profiles and
countries, are outlined below.
1.     February 2018. This study gives an overview of the price levels in February
       2018.
2. Commodity prices level. Some countries (such as Germany), are divided into
   zones to compare differences in commodity prices. For those countries we have
   used a normal average to weigh the commodity element over the different zones.
3. Exchange rates. For the UK comparison, we have always used the average of all
   daily exchange rates over February to convert from Pound Sterling to Euro.1
4. VAT. Following the terms of reference provided by the CREG, we take into
   account Value Added Tax for the residential profiles but not for the small
   professional profiles (as this tax is deductible for professional clients) in this
   study. All prices mentioned in the document are therefore excluding VAT.
5. UK. Wherever this study mentions the UK, Northern Ireland is not taken into
   account.
6. Auto-production. We assume that the profiles under study do not produce
   electricity themselves.
7. Climate change agreement. It is assumed that professional users are not part of
   a climate change agreement.
8. Ownership of the meter. It is assumed that consumers do not own their own
   meter.
9. Unique contracts. It is assumed that consumers have one contract with their
   supplier which covers all costs.
10. Payment method. In case multiple payment methods exist, the mostly used
    option will be taken into account.
11. Reductions. Reductions are not taken into consideration.
12. Exclusion of products. As a general rule, each product should be available for
    any type of consumers. For example, products unavailable during the period of
    the price comparison, products that require the acquisition of a share, products
    that require pre-financing, or products that are only available on certain
    conditions are excluded from the price comparison and as a result, a
    replacement product will be selected.

1   Source: National Bank of Belgium.
CREG – A European comparison of electricity and natural gas prices for residential and small professional
consumers
28 June 2018
[15]
3.2. Consumer profiles
Table 1 – Description of electricity profiles
E1 E2
When? February 2018 February 2018
Annual demand kWh 3.500 50.000
Single meter, low-voltage Single meter, low-voltage
Connection kV
network network
Grid operator DSO DSO
Contracted
kW 6 36
capacity
Table 2 – Description of natural gas profiles
G1 G2
When? February 2018 February 2018
Annual demand kWh 23.260 100.000
Grid operator DSO DSO
CREG – A European comparison of electricity and natural gas prices for residential and small professional
consumers
28 June 2018
[16]3.3. Electricity: Countries/zone(s)
identified
Belgium
Belgium is divided into three regions, respectively the Flemish region, the Walloon
region and the Brussels Capital Region as mapped below.
Figure 1 – Regions of Belgium
It is decided to analyse the three regions separately because of the existence of (i)
differing distribution charges across the three zones and (ii) a double regional
impact on the third price component: taxes, levies and certificate schemes. In the
Flemish region, 11 DSOs are active for electricity, operated by Eandis (Gaselwest,
Imea, Imewo, Intergem, Iveka, Iverlek, Sibelgas) and Infrax (Infrax West, Inter-
Energa, Iveg, PBE). For network costs - transmission and distribution tariffs - we
will therefore present a weighted average value for all 11 DSOs. The calculation of
those market shares is based on the number of EAN connections of each DSO and is
presented in the table below.
Table 3 – Market shares of Flemish electricity DSOs
Number of EAN Market share
DSO
connections (2017)2
Gaselwest 453.207 13,00 %
Imewo 609.654 17,49 %
Iverlek 532.325 15,27 %
Iveka 389.678 11,18 %
Inter-Energa 476.996 13,68 %
Intergem 310.918 8,92 %
Imea 320.936 9,21 %
Infrax West 141.924 4,07 %
Iveg 94.701 2,72 %
Sibelgas 63.138 1,81 %
PBE 92.872 2,66 %
Total 3.486.349 100,00%
2Latest available information on the number of EAN connections of electricity DSOs in
Flanders (situation on 31st of December 2017), retrieved from the CREG.
CREG – A European comparison of electricity and natural gas prices for residential and small professional
consumers
28 June 2018
[17]The Walloon region has 12 DSOs3: most of them are operated by ORES (ORES
Brabant Wallon, ORES Est, ORES Hainaut, ORES Luxembourg, ORES Mouscron,
ORES Namur, ORES Verviers) and RESA, alongside some smaller operators: AIEG,
AIESH, Gaselwest, Régie de Wavre. We will present a weighted average value for all
12 DSOs. As is the case for the Flemish DSOs, the calculation of those market shares
is based on the number of EAN connections of each DSO.
Table 4 – Market shares of Walloon electricity DSOs
Number of EAN Market share
DSO
connections (2017)4
Ores Hainaut 574.987 31,09%
RESA 442.589 23,93%
Ores Namur 235.850 12,75%
Ores Brabant Wallon 189.472 10,24%
Ores Luxembourg 153.945 8,32%
Ores Verviers 79.690 4,31%
Ores Mouscron 36.768 1,99%
Ores Est 58.022 3,14%
Gaselwest 14.488 0,78%
AIEG 24.929 1,35%
AIESH 21.094 1,14%
Régie de Wavre 17.818 0,96%
Total 1.849.652 100,00%
There is only one DSO active for electricity in the Brussels Capital Region, Sibelga.
The first driver of regional differences is caused by so-called regional public service
obligations that are a consequence of the grid connection levels. The regions can
impose public service obligations on grid operators below or equal to 70 kV located
on their territory (which includes both profiles).
The second regional impact within Belgium is caused by the certificate schemes that
stem from the regional competence in terms of renewable energy obligations on
their territory. Flanders, Wallonia and the Brussels Capital Region each impose their
own green certificate scheme on all electricity consumers within their region (both
profiles under review).
Germany
Within the German territory, consumers can take part in one electricity market, but
the standard contract (“Grundversorgung”) depends on the DSO region. For this
reason, the commodity cost will be determined per selected DSO (see below).
As to taxes, levies and certificate schemes, most taxes are determined on the national
level. The only tax that can vary is the “Konzessionsabgabe”, which differs on the
type of contract as well as on the size of the city. Therefore, the average
“Konzessionsabgabe” paid is considered.5
3 In 2017, ORES Brabant Wallon has replaced PBE as the DSO in the region. Therefore, the
market share of PBE (based on 2016 figures) has been added to that of ORES BW to reflect
this change.
4 Latest available information on the number of EAN connections of electricity DSOs in the
Walloon region (situation on 31st of December 2017), retrieved from the CREG.
5 The Konzessionsabgabe is a local tax that applies to all electricity consumers connected to
the distribution grid (Konzessionsabgabenverordnung, § 1-2).
CREG – A European comparison of electricity and natural gas prices for residential and small professional
consumers
28 June 2018
[18]The transmission and distribution tariffs are integrated for Germany. Yet, Germany
counts about 880 distribution system operators.6 Therefore, it is necessary to make
a relevant selection of DSOs in order to obtain representative results. After an
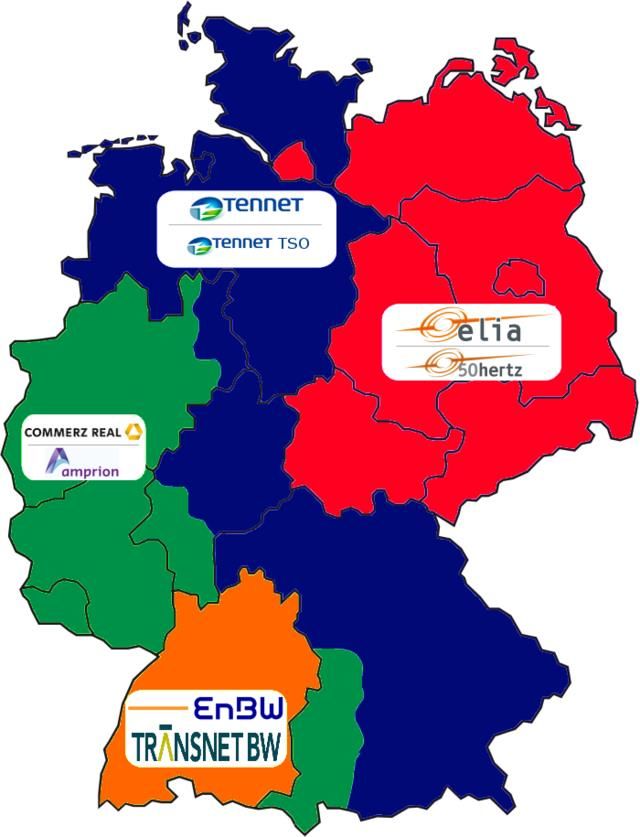
analysis of German DSO zones, it was found that there exist an impact of the TSO
zone on the network tariffs. More specifically, four different TSOs are active in
Germany; their corresponding geographical coverage is depicted below.
Figure 2 – TSO regions in Germany
1. The West region which is made of Nordrhein-Westfalen, Rheinland-Pfalz
Saarland, and parts of Hesse and Bayern, where Amprion is the TSO.
2. The South-West region which is made of Baden-Württemberg where Transnet
BW is the TSO.
3. The Central region which is made of Niedersachsen, the other part of Hesse and
Bayern, Schleswig-Holstein, Bremen and where Tennet operates the
transmission grid.
4. The East region which is made of former East-Germany and Hamburg; 50 Hertz
operates the transmission grid in this region.
Given the differences in underlying transmission tariffs, these zones will be analysed
separately.
Regarding the choice of DSOs, differences in tariffs were found between urban DSOs
and rural DSOs. Therefore, the largest urban and the largest rural DSO of each
transmission zone will be selected, for which then a weighted average is calculated
to integrate these DSOs in a German tariff. A similar approach is taken for the
natural gas market.
6 Monitoringsbericht 2017, Bundesnetzagentur, 2017, p. 36.
CREG – A European comparison of electricity and natural gas prices for residential and small professional
consumers
28 June 2018
[19]Table 5 – Normalised market shares of German electricity DSOs
Number of EAN
Normalised
TSO DSOs connections
market share
(2018)7
TenneT Bayernwerk 2.379.726 71,13%
SWM Infrastruktur,
965.955 28,87%
Stammgebiet
Total 3.345.681 100,00%
50 Hertz E-Dis 1.407.334 37,57%
Stromnetz Berlin 2.339.003 62,43%
Total 3.746.337 100,00%
Amprion Westnetz 4.965.607 82,44%
RNG-Netz 2 - Köln 1.057.479 17,56%
Total 6.023.086 100,00%
Transnet BW Netze BW 2.300.226 85,78%
Stuttgart Netze 381.165 14,22%
Total 2.681.391 100,00%
As stated before, the commodity cost differs between DSO-regions. The commodity
cost will therefore be calculated for each DSO zone, and will be weighted according
to the same weighing as the DSO tariffs.
France
In terms of electricity market, France will be treated as one single zone. The same
commodity cost and network charges apply everywhere on the national territory for
the two consumer profiles under review. Concerning network tariffs, Enedis, the
largest DSO of France has a market share of over 95%. Therefore, only this DSO will
be taken into consideration. Municipalities and departments have the option to
differentiate local electricity taxes. However, almost 80% of all municipalities and
almost 90% of all departments apply the maximum tax rate. Therefore, this
maximum tax is considered for the entirety of the French territory.
The Netherlands
The Netherlands will also be treated as one single zone in this study. In terms of
commodity costs and taxes, levies and certificates schemes, no regional differences
are observed: there is one single electricity market and the taxes on electricity are
only imposed on a national basis.
On the network cost level, the situation is somewhat more complicated. The network
cost for profiles E1 and E2 consists out of the distribution tariffs imposed by the
DSOs.
The Dutch distribution network counts seven different DSOs8 of different size and
importance (see map below), who each apply different tariffs. As is the case in
Germany, these distribution costs are integrated with transmission costs (two layers
integrated in one cumulative tariff).
7 Every DSO publishes the number of EAN connections on its website. The considered data
is the “entnahmestellen bzw. Anschlusspunkte Niederspannung”.
8 Endinet Eindhoven has been integrated in Enexis as of 1st of January 2017.
CREG – A European comparison of electricity and natural gas prices for residential and small professional
consumers
28 June 2018
[20]Figure 3 – DSO regions in the Netherlands
These DSOs are characterised by differences in size and number/type of clients. For
profiles E1 and E2, we will therefore present a weighted average of distribution
tariffs in accordance with the number of grid connections for every DSO. An
overview of their number of connections (and hence their market share) can be
found in the table below.
Table 6 – Market shares of Dutch electricity DSOs
DSO Number of connections (2016)9 Market share
Liander 2.950.296 36,13%
Enexis10 2.778.347 34,02%
Stedin 2.081.144 25,49%
Enduris 213.280 2,61%
Westland 57.224 0,70%
Cogas 53.155 0,65%
Rendo 32.248 0,39%
Total 8.165.694 100,00%
9 The number of connections are those from 2016, collected by Netbeheer Nederland and
Gasunie Transport Services. For more details: https://energiecijfers.info/hoofdstuk-1/
10 The number of connections of Endinet Eindhoven are added to those of Enexis.
CREG – A European comparison of electricity and natural gas prices for residential and small professional
consumers
28 June 2018
[21]Liander, Enexis and Stedin have a combined market share of almost 95%. Therefore
their tariffs have a high impact on the weighted average for distribution tariffs for
profiles E1 and E2.
United Kingdom
As is the case for France and the Netherlands, the United Kingdom will also be
treated as one single zone in this study. In terms of commodity costs and taxes, levies
and certificates schemes, no regional differences are observed: there is one single
electricity market and the only taxes on electricity are imposed on a national basis.
In terms of network costs, the United Kingdom has three transmission system
operators:
1. National Grid (for England and Wales);
2. Scottish Hydro Electric Transmission (SHET);
3. Scottish Power Transmission (SPT).
On top of these three transmission system operators, six distribution system
operator groups are active.11 The TSOs and DSOs all charge different tariffs in the
same fourteen tariff zones in the UK (without Northern Ireland).
Figure 4 – DSO zones of the United Kingdom
For network costs - transmission and distribution tariffs for profiles E1 and E2 - we
will once again present weighted average values for all fourteen zones.
In addition to these large DSOs, the UK also has some smaller Independent Network
11
Operators (IDNO’s). These are not taken into account in this study.
CREG – A European comparison of electricity and natural gas prices for residential and small professional
consumers
28 June 2018
[22]Table 7 - Market shares of United Kingdom electricity DSOs
Number of connections Market share
DSO
points (2016)12
SHEPD (Northern 762.398 2,58%
Scotland)
SPD (Southern 2.002.257 6,78%
Scotland)
ENWL (North West) 2.381.080 8,06%
NPg (Northern) 1.596.374 5,40%
NPg (Yorkshire) 2.291.522 7,76%
SPMW (North Wales & 1.503.914 5,09%
Mersey)
WPD (East Midlands) 2.622.449 8,88%
WPD (West Midlands) 2.463.217 8,34%
WPD (South Wales) 1.122.920 3,80%
WPD (South Western) 1.590.050 5,38%
SEPD (Southern) 3.016.250 10,21%
UKPN (Eastern) 3.599.594 12,18%
UKPN (South East) 2.281.009 7,72%
UKPN (London) 2.311.906 7,83%
Total 25.544.940 100,00%
12Figures from
http://www.energynetworks.org/assets/files/news/publications/Energy%20Networks%20
Performance.pdf
CREG – A European comparison of electricity and natural gas prices for residential and small professional
consumers
28 June 2018
[23]3.4. Natural gas: Countries/zone(s)
identified
Belgium
In terms of commodity cost and transmission cost, there are often no regional
differences observed in Belgium13. The same commodity prices on the natural gas
market are available to all consumers. Belgium counts only one Transmission
System Operator: Fluxys Belgium.
Figure 5 – Regions of Belgium
We take as assumption that both profiles are connected to the lowest operational
pressure of the distribution grid (T2). The Flemish region has 11 DSOs14 for natural
gas that are operated by Eandis and Infrax, whilst in the Walloon region (7 DSOs)
the distribution grid is mainly operated by ORES and RESA. We will present a
weighted average of the distribution tariffs in each of the regions, based on the
number of EAN connections on each of their grids. The DSO for natural gas in the
Brussels Capital Region is Sibelga.
13 In some cases, energy suppliers do differentiate the price of their commodity element
between regions, but this was not the case for the suppliers under review in the study.
14 Enexis, active in the Belgian enclave of Baarle-Hertog, is not considered in the study.
CREG – A European comparison of electricity and natural gas prices for residential and small professional
consumers
28 June 2018
[24]Table 8 – Market shares of Flemish natural gas DSOs
Number of EAN Market share
DSO
connections (2017)15
Gaselwest 300.406 13,55 %
Intergem 199.711 9,01 %
Iveka 267.417 12,07 %
Iverlek 347.289 15,67 %
Imewo 405.063 18,28 %
IMEA 240.839 10,87 %
Inter-Energa 264.141 11,92 %
IVEG 86.332 3,90%
Sibelgas 46.049 2,08 %
Infrax West 59.120 2,67%
Total 2.216.367 100,00%
Table 9 – Market shares of Walloon natural gas DSOs
Number of EAN Market share
DSO
connections (2017)16
Ores Hainaut 307.034 42,53%
RESA 238.574 33,05%
Ores Brabant Wallon 89.003 12,33%
Ores Mouscron 27.167 3,76%
Ores Namur 41.811 5,79%
Gaselwest 7.324 1,01%
Ores Luxembourg 11.047 1,53%
Total 721.960 100,00%
In terms of taxes and levies, however, some minor differences exist between regions.
This is why we present the results for Belgium in the same way as we did for
electricity: a separate analysis for Wallonia, Flanders and the Brussels Capital
Region.
Germany
As is the case for electricity, the standard contract (“Grundversorgung”) of natural
gas consumers depends on the DSO of its region. For this reason, the commodity
cost will be determined per selected DSO (see below).
As there are over 800 different DSOs in Germany17 we will once again present a
weighted average of the distribution tariffs of two large rural and two large urban
DSOs from each of the four previously defined market areas, similar to what has
been done for the electricity market, which will be weighed based on their respective
15 Latest available information on the number of EAN connections of natural gas DSOs in
Flanders (situation on 31st of December 2017), retrieved from the CREG.
16 Latest available information on the number of EAN connections of natural gas DSOs in
the Walloon region (situation on 31st of December 2017), retrieved from the CREG.
17 From Distribution networks to smart Distribution systems: rethinking the regulation of
European electricity DSOs, European University Institute, THINK paper topic 12, Final
report, 2013, pgs. 12-13.
CREG – A European comparison of electricity and natural gas prices for residential and small professional
consumers
28 June 2018
[25]normalised market shares. The DSOs that were selected18 to calculate the network
cost and their market shares are presented in the table below.
Table 10 – Normalised market shares of German natural gas DSOs
Number of EAN Normalised market
DSO
connections19 (2018) share
Bayernwerk 86.632 50,98%
SWM 83.302 49,02%
Total 169.934 100,00%
E-Dis 33.023 15,91%
NBB 174.497 84,09%
Total 207.520 100,00%
Westnetz 448.436 65,55%
RNG-Netz 2 - Köln 235.712 34,45%
Total 684.148 100,00%
Netze BW 146.223 84,07%
Karlsruhe Netz 27.697 15,93%
Total 173.920 100,00%
France
France has six different price zones for residential and small professional natural
gas contracts.20 As no information regarding the number of EAN connections per
zone could be identified, the median zone is taken. In terms of the network costs, the
distribution and transmission costs are integrated. GrDF (Gaz Réseau Distribution
France) distributes 96% of all natural gas in France.21 No regional differences in
taxes could be identified. Therefore, France is considered as one zone.
The Netherlands
Concerning the commodity costs, suppliers have the option to apply a regional
surcharge, based on how far the region is situated from Groningen. In this regard,
ten regions exist. However, the consulted suppliers in the selection of underlying
report do not apply differentiated tariffs according to region. Therefore, the
commodity component is assumed to be equal in the whole country. The
Netherlands have one Transmission System Operator: Gasunie Transport Services.
There are 7 DSOs in the Netherlands, whose tariffs will be weighted according to
their number of EAN connections, which can be found below. Therefore, the
Netherlands will be treated as one zone, with weighted averages regarding
distribution tariffs.
18 These DSOs that were selected are slightly different from the DSOs that were selected for
electricity. This is due to the fact that geographical coverage of the distribution of electricity
and natural gas are not identical within a certain area. So has Stromnetz Berlin been
replaced by Netzgesellschaft Berlin-Brandenburg and Stuttgart Netze by Karlsruhe Netz.
19 Every DSO publishes the number of EAN connections on its website. The number
considered is the Anzahl der Ausspeisepunkte which can be retrieved from the
Netzstrukturdaten section of each DSO.
20 https://particuliers.engie.fr/gaz-naturel/conseils/prix-du-gaz-naturel/zones-
tarifaires.html
21 http://www.cre.fr/reseaux/infrastructures-gazieres/description-generale#section3
CREG – A European comparison of electricity and natural gas prices for residential and small professional
consumers
28 June 2018
[26]Figure 6 – DSO regions in the Netherlands
Table 11 – Market shares of Dutch natural gas DSOs
Number of EAN
DSO Market share
connections22 (2016)
RENDO Netwerken 104.062 1,45%
Coteq Netbeheer 140.165 1,95%
Liander 2.256.085 31,38%
Enexis 2.485.126 34,57%
Stedin 1.958.462 27,24%
Westland Infra 53.646 0,75%
Enduris 190.626 2,65%
Total 7.189.272 100,00%
United Kingdom
The United Kingdom will be presented as one single zone for natural gas in this study
(leaving out Northern Ireland). There are no regional taxes, and there is one single
natural gas transmission system operator, National Grid Gas plc.
22The number of connections are those from 2016, collected by Netbeheer Nederland and
Gasunie Transport Services. For more details: https://energiecijfers.info/hoofdstuk-1/
CREG – A European comparison of electricity and natural gas prices for residential and small professional
consumers
28 June 2018
[27]Figure 7 – TSO region in the United Kingdom
On top of the transmission system operator, there are eight natural gas distribution
networks23. These eight networks are owned and managed by the following four
DSOs:
1. Cadent Gas Ltd:
• West Midlands;
• North West;
• East of England and North London;
2. Northern Gas Networks Ltd.:
• North East England (including Yorkshire and Northern Cumbria);
3. Wales & West Utilities Ltd.:
• Wales;
• South West England;
4. Southern Gas Networks
• Scotland;
• Southern England (including South London).
23 https://www.ofgem.gov.uk/gas/distribution-networks/gb-gas-distribution-network
CREG – A European comparison of electricity and natural gas prices for residential and small professional
consumers
28 June 2018
[28]You can also read


