Solar feed-in tariffs - The value of electricity from small-scale solar panels in 2018-19 - NSW Government
←
→
Page content transcription
If your browser does not render page correctly, please read the page content below
Solar feed-in tariffs

The value of electricity from small-scale solar panels in
                          2018-19

        Draft Report
                                        May 2018
         Electricity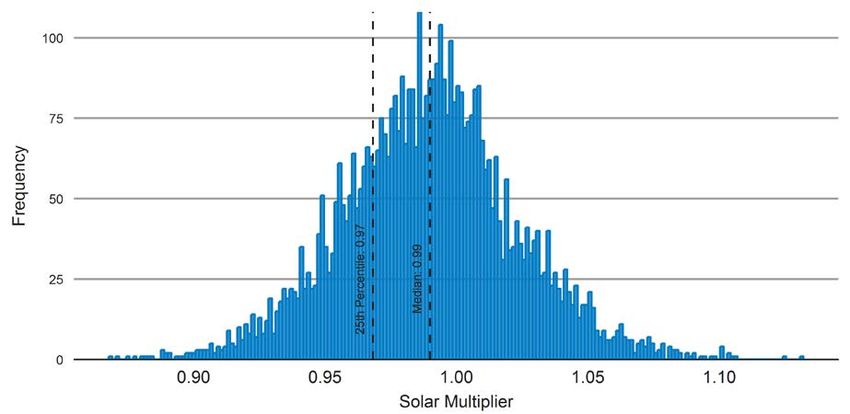
© Independent Pricing and Regulatory Tribunal (2018)

     With the exception of any:

       (a) coat of arms, logo, trade mark or other branding;

       (b) third party intellectual property; and

       (c) personal information such as photos of people,

     this publication is licensed under the Creative Commons Attribution-NonCommercial-
     NoDerivs 3.0 Australia Licence.

                        The licence terms are available at the Creative Commons website:
                        https://creativecommons.org/licenses/by-nc-nd/3.0/au/legalcode

     IPART requires that it be attributed as creator of the licensed material in the following
     manner: © Independent Pricing and Regulatory Tribunal ([Year of Publication]).

     The use of any material from this publication in a way not permitted by the above licence or
     otherwise allowed under the Copyright Act 1968 (Cth) may be an infringement of copyright.
     Where you wish to use the material in a way that is not permitted, you must lodge a request
     for further authorisation with IPART.

     Disclaimer

     IPART does not guarantee or warrant, and accepts no legal liability whatsoever arising
     from or connected to, the accuracy, reliability, currency or completeness of any material
     contained in this publication.

     Information in this publication is provided as general information only and is not intended
     as a substitute for advice from a qualified professional. IPART recommends that users
     exercise care and use their own skill and judgment in using information from this
     publication and that users carefully evaluate the accuracy, currency, completeness and
     relevance of such information. Users should take steps to independently verify the
     information in this publication and, where appropriate, seek professional advice.

     Nothing in this publication should be taken to indicate IPART’s or the NSW Government’s
     commitment to a particular course of action.

     ISBN 978-1-76049-212-0

      The Independent Pricing and Regulatory Tribunal (IPART)
      IPART provides independent regulatory decisions and advice to protect the ongoing
      interests of the consumers, taxpayers and citizens of NSW. IPART’s independence is
      underpinned by an Act of Parliament. Further information on IPART can be obtained
      from IPART’s website: https://www.ipart.nsw.gov.au/Home.

ii    IPART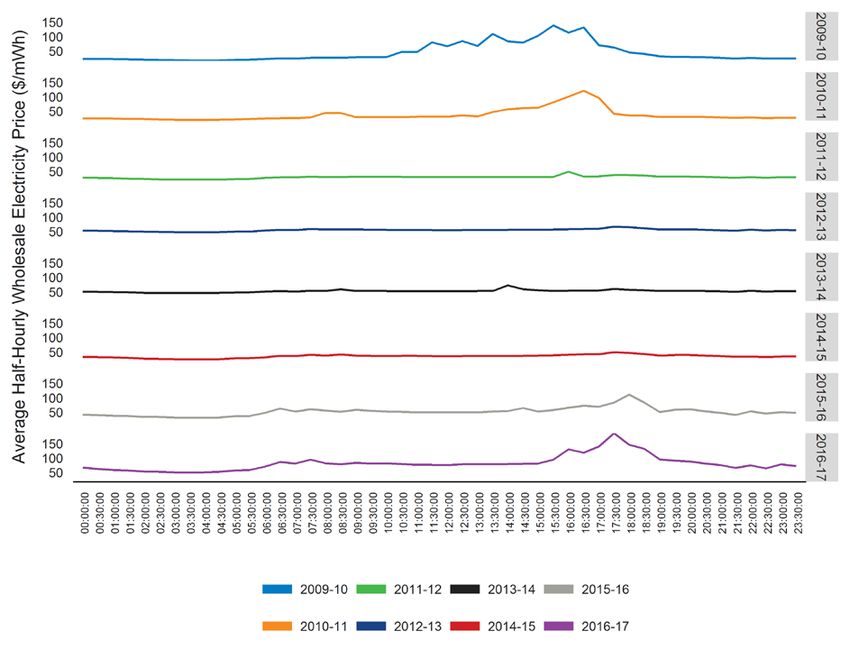
Tribunal Members

The Tribunal members for this review are:
  Dr Peter J Boxall AO, Chair
  Mr Ed Willett
  Ms Deborah Cope

Enquiries regarding this document should be directed to a staff member:
  Jessica Robinson     (02) 9290 8405

Invitation for submissions
IPART invites written comment on this document and encourages all interested parties to
provide submissions addressing the matters discussed.

Submissions are due by 4 June 2018

We would prefer to receive them electronically via our online submission form
.

You can also send comments by mail to:
  Solar feed-in tariff benchmarks
  Independent Pricing and Regulatory Tribunal
  PO Box K35
  Haymarket Post Shop NSW 1240

Late submissions may not be accepted at the discretion of the Tribunal. Our normal
practice is to make submissions publicly available on our website
as soon as possible after the closing date for submissions. If you wish to view copies of
submissions but do not have access to the website, you can make alternative arrangements
by telephoning one of the staff members listed on the previous page.

We may choose not to publish a submission - for example, if it contains confidential or
commercially sensitive information. If your submission contains information that you do
not wish to be publicly disclosed, please indicate this clearly at the time of making the
submission. However, it could be disclosed under the Government Information (Public
Access) Act 2009 (NSW) or the Independent Pricing and Regulatory Tribunal Act 1992 (NSW), or
where otherwise required by law.

If you would like further information on making a submission, IPART’s submission policy
is available on our website.

                                                                             IPART       iii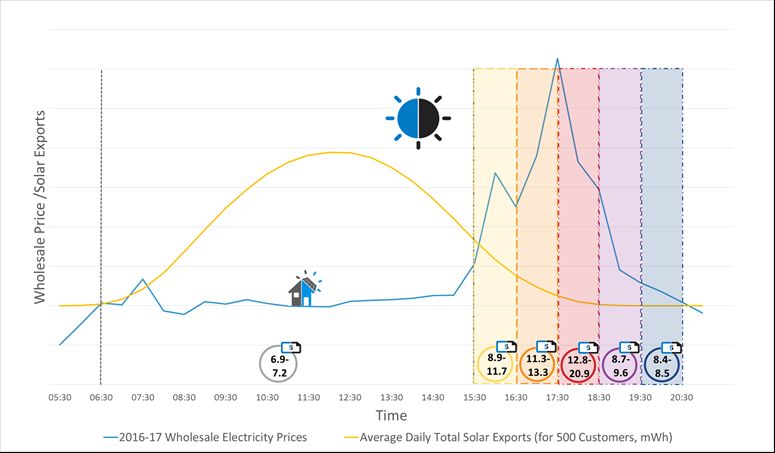
Contents

     1     Executive summary                                                                      1
           1.1 Our draft benchmark for all-day solar feed-in tariffs is 7.5 c/kWh                 1
           1.2 Our draft benchmark is lower than the current benchmark because the forecast
                wholesale value of solar exports in 2018-19 is lower                              3
           1.3 We have not proposed a range for the all-day tariff benchmark as we expect
                little variation in the value of solar exports across the day                     5
           1.4 We have proposed benchmark ranges for time-dependent solar feed-in tariffs 5
           1.5 We considered stakeholder comments and do not agree that solar feed-in
                tariffs should be higher                                                          7
           1.6 We have found offers with higher feed-in tariffs are unlikely to result in cheaper
                bills overall for solar customers                                                10
           1.7 How you can contribute to this review                                             11
           1.8 List of draft decisions                                                           12
           1.9 What the rest of this report covers                                               13

     2     Context for this review                                                                14
           2.1 IPART’s role in reviewing solar feed-in tariffs                                    14
           2.2 Solar customers make substantial savings off their bills                           16
           2.3 Retailers are currently offering feed-in tariffs of around 6-20 cents              19
           2.4 Do higher feed-in tariffs lead to lower electricity bills?                         21

     3     Solar feed-in benchmarks for 2018-19                                                   23
           3.1 Overview of draft decisions for 2018-19                                            23
           3.2 Our draft benchmark for all-day solar feed-in tariffs is 7.5 c/kWh                 24
           3.3 We propose to set a single benchmark for the all-day solar feed-in tariff rather
                 than a range                                                                     25
           3.4 We propose to set time-dependent benchmark ranges                                  26
           3.5 We used different years of data to set the values at the top and bottom of our
                 time-dependent benchmark ranges                                                  29
           3.6 We only set our draft benchmark feed-in tariffs for one-year                       30
           3.7 We continue to prefer setting benchmarks for solar feed-in tariffs over
                 regulating minimum feed-in tariffs                                               31
     4     Our approach for setting the draft benchmarks for solar feed-in tariffs                33
           4.1 Overview of stakeholder comments on our approach                                   34
           4.2 Using historical data to adjust for when solar energy is exported is more
                accurate than modelling                                                           35
           4.3 Retailers do not profit unfairly from solar customers as they only avoid
                wholesale costs when they supply solar exports                                    35
           4.4 Requiring retailers to pay a higher feed-in tariff would increase bills for all
                customers                                                                         37
           4.5 Customers already receive a subsidy for the external benefits of solar when
                they install a solar system                                                       38
           4.6 Customers should be paid the market value for the electricity they generate        40
           4.7 Solar exports are not likely to provide system-wide net benefits for networks      41

iv       IPART
5   How we forecast the average wholesale electricity price                      43
    5.1 Overview of draft forecast average wholesale electricity price           43
    5.2 Sourcing publicly available price data                                   44
    5.3 Adjusting to reflect the contract premium                                46
6   How we estimated the solar multiplier                                        47
    6.1 Overview of the draft solar multiplier for 2018-19                       47
    6.2 We used the same modelling approach as previous years                    47
    6.3 We used the last three years of historical data                          50
    6.4 We used Ausgrid data on solar exports only                               55
A   Terms of Reference                                                           56

                                                                         IPART        v
1 Executive summary
In NSW more than 10% of households and small business premises have installed a solar
photovoltaic (PV) system, or solar panels. 1 When these solar customers use electricity
generated by their solar panels rather than buying it from their retailer, they can make
significant savings on electricity bills. When they don’t use all the electricity they generate
themselves, the excess amounts are exported to the grid, and they may be paid a ‘solar feed-
in tariff’ for these solar exports.
Retailers aren’t obliged to offer solar customers a solar feed-in tariff for their solar exports.
Rather, they can choose to do so in their market offers to solar customers. And if they do,
they set this tariff themselves. Currently, most retailers do offer solar customers a solar
feed-in tariff of between 6 cents and 20 cents per kilowatt hour (c/kWh).
To help retailers in setting their solar feed-in tariffs and solar customers in deciding whether
these tariffs are reasonable, the Independent Pricing and Regulatory Tribunal of NSW
(IPART) has set a ‘benchmark range’ for solar feed-in tariffs for each year since 2012. Our
benchmarks provide guidance on the financial value of electricity exported by solar
customers in NSW in the coming financial year.
The NSW Government has asked IPART to continue setting benchmarks for solar feed-in
tariffs annually for the next three financial years, from 2018-19 to 2020-21 (our Terms of
Reference are provided in Appendix A). 2 We have also been asked to set time-dependent
benchmark ranges for solar feed-in tariffs.
This report outlines our draft decisions on benchmarks for solar feed-in tariffs for 2018-19,
and explains why and how we reached these decisions, including our responses to
stakeholder comments on our Issues Paper. We invite all interested parties to comment on
this Draft Report (see Section 1.7 for more information).
1.1 Our draft benchmark for all-day solar feed-in tariffs is 7.5 c/kWh
To set our benchmarks for solar feed-in tariffs, we forecast what retailers would pay for
customers’ solar exports if this electricity were sold into the wholesale spot market (the
National Electricity Market or NEM) in the same way as other generators’ output. 3 In this
market, wholesale prices are set for each half hour of the day to reflect the supply and
demand for electricity at that time.
1 Department of Planning and Environment, Solar Panels and Systems,
https://www.resourcesandelectricity.nsw.gov.au/electricity-consumers/solar/solar-panels, accessed 14
February 2018. AER, NSW – Small Customers, https://www.aer.gov.au/retail-markets/retail-statistics/nsw-
small-customers, accessed 14 February 2018.
2 We have been asked to conduct this review under Section 9 of the IPART Act.
3 This is a hypothetical concept, as customers with small-scale solar PV cannot sell their exported energy into
the wholesale spot market.
IPART 1Typically, these wholesale prices are:
lower late at night (when demand is lowest), and through the middle of the day (when
solar energy meets a proportion of demand), and
highest in the late afternoon and evening (when demand is highest as people return
home from work, and when solar energy meets little or none of this demand as the sun
sets).
We set the draft benchmark for the all-day solar feed-in tariffs based on our forecast of the
average price that retailers would pay for solar exports across the day (weighted by solar
output) if they were buying them on the wholesale market.
For 2018-19, our draft all-day benchmark is 7.5 c/kWh.
We consider this benchmark is reasonable, and that setting a higher benchmark would lead
to unacceptable outcomes. In particular, if retailers were required to pay more for these
solar exports than they would pay for wholesale electricity on the NEM, retail prices for all
customers would need to be higher to recover the difference. While some retailers choose to
offer feed-in tariffs that are higher than our benchmarks, we estimate that:
If all retailers paid a solar feed-in tariff of 15 c/kWh in 2018-19 (or double the forecast
average wholesale value of solar), their total costs would be $59 million higher across
NSW, compared to paying an average feed-in tariff of 7.5 c/kWh in line with our all-day
benchmark. To recover these additional costs from NSW households, the average
annual household bill would need to increase by around $22.
If all retailers paid a feed-in tariff of 25 c/kWh (17.5 c/kWh above the forecast average
wholesale price and equal to the current average retail price of electricity), their total
costs would be $137 million higher, and the average annual household bill would need
to increase by around $50. 4
In effect, a higher feed-in tariff would result in households without solar panels paying
higher electricity bills so that customers with solar could receive more for their solar exports.
This would be contrary to the requirement in our Terms of Reference from the Government
that our benchmark range not lead to higher retail prices. It would also disproportionately
affect the households who are unable to install a solar system themselves (for example,
because they rent or they cannot afford the upfront costs).
All electricity customers are already paying an average of around $15 per year to customers
with solar panels to subsidise the upfront installation costs under the Small-Scale Renewable
Energy Scheme, as well as an average of $55 per year for other ‘green costs’ (including
subsidies for the Renewable Energy Target, the climate change fund, and the Energy Saving
Scheme).
Currently, average annual bills for solar customers are an average of $450 lower than
customers without solar panels, before revenue earned from solar feed-in tariffs (see Box
1.1). This represents an ongoing saving to customers after their payback period (which is
currently approximately 6-8 years).
4 See footnote 14 for information on our estimation methodology.
2 IPARTBox 1.1 Bills for households with solar panels are significantly lower
The average household bill for a solar customer with a 2-kW system is around $1,550 per annum,
compared to $2,100 for households without panels. Solar customers can save around $450 a year
by using the solar energy they generate themselves (rather than purchasing it from their retailer), in
addition to receiving any solar feed-in tariff from their retailer (an average of around $100).
Solar customers also receive an upfront subsidy for installing their panels under the Small-Scale
Renewable Energy Scheme. For a 2-kilowatt solar system installed in Sydney, the subsidy is
currently worth around $1,050 to $1,330. After this subsidy, the upfront costs of a solar system are
around $3,400. The payback period for these upfront costs is around 6 years.
Following the payback period, the customer is able to make ongoing savings off their bills for the
remaining life of the panels (around 19 years).
Even without any feed-in tariff, this customer would still pay off their panels in around 7.5 years.
Similarly, if the upfront subsidy were removed, the payback period would be 8 years, with a
remaining life after payback of almost 17 years.
Note: The values for financial incentives under the SRES assume the solar unit is installed in Sydney on 24 April 2018. The
dollar range is based on certificate prices of $30 and $38. Assumes a solar panel life of 25 years.
Source: Clean Energy Regulator, Small generation unit STC calculator, https://www.rec-registry.gov.au/rec-
registry/app/calculators/sgu-stc-calculator, accessed 24 April 2018; Green Energy Markets, STC Market Prices,
http://greenmarkets.com.au/resources/stc-market-prices, accessed 24 April 2018. Solar Choice, Current Solar System
Prices: Residential and Commercial, https://www.solarchoice.net.au/blog/solar-power-system-prices, accessed 24 April
2018.
1.2 Our draft benchmark is lower than the current benchmark because the
forecast wholesale value of solar exports in 2018-19 is lower
To estimate the value of solar exports for the coming financial year, we estimate the average
wholesale electricity price based on the NSW future contracts, and then apply a ‘solar
multiplier’. This multiplier takes account of whether wholesale prices are likely to be higher
or lower than average at the times when solar customers export to the grid (that is,
weighting wholesale prices by solar output):
If more solar exports occur during times when spot wholesale prices are higher than
average, the solar multiplier will be greater than one.
If more exports occur when spot wholesale prices are lower than average, then it will
be less than one.
We calculate the solar multiplier using historical data on the average wholesale price across
the day and the times when solar customers export to the grid.
For 2018-19, our draft benchmark for all-day solar feed-in tariffs of 7.5 c/kWh is lower than
our current all-day benchmark of 12.8 c/kWh for 2017-18. This is because both the average
forward price and the solar multiplier for 2018-19 are lower than for 2017-18.
As Table 1.1 shows, the Australian Stock Exchange (ASX) baseload electricity contract prices
are around 7.4 c/kWh for 2018-19, which have fallen from 11 c/kWh for 2017-18 (when we
published our Final Report last year). 5
5 ASX baseload electricity contract prices are less the assumed 5% contract premium.
IPART 3The reduction in the ASX forward contract prices is consistent with the forecasts in the
Australian Energy Market Commission’s (AEMC) 2017 Residential Electricity Price Trends
report:
The trend in wholesale costs in 2018/19 and 2019/20 is downwards and is driven by:
• approximately 4,100 MW of new committed and expected (modelled) generation entering the
NEM in 2018/19 and 2019/20.
• the return to service of the Swanbank E gas power station (385 MW) in early 2018
• reduced short-run costs for South Australian gas plants in 2019/20 due to the pass through of
certificate revenue related to the Energy Security Target. 6
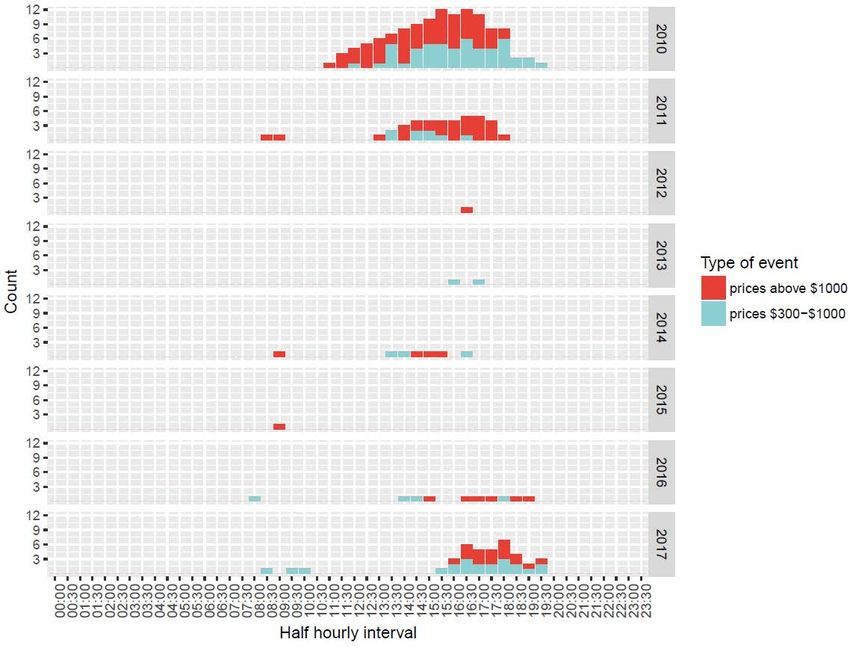
In addition, the most recent historical data suggests that wholesale prices are likely to be
lower at the times of the day when solar is exported to the grid than they were in previous
years. In our 2017-18 review, we estimated a solar multiplier of 1.14 (based on seven years
of data from 2009-10 to 2015-16), which meant that the value of solar exports would be 14%
higher than the average wholesale price across the day. This reflected historical spikes in
wholesale prices in the middle of the day.
However, since 2011-12, wholesale prices have trended lower in the middle of the day as
solar generation has increased and met a greater proportion of demand at this time.
Therefore, we have calculated the solar multiplier for our 2018-19 draft benchmarks based
on the most recent three years of data (to 2016-17) to best reflect supply and demand
conditions for the forecast year. Using this data, we have calculated a solar multiplier of
0.99, which means we expect the value of solar exports will be slightly lower than the
average wholesale price of energy across the day (a solar multiplier of 1 would indicate that
the value of solar exports is equal to the average wholesale price of energy). 7
As part of our methodology to calculate the value of solar exports, we also:
multiply the value of the solar energy by a loss factor 8, to gross up solar generation to
account for the avoided losses that usually arise as electricity flows through the
transmission and distribution networks because solar exports tend to be consumed
close to where the electricity is produced, and
add the value of the NEM fees and charges that are avoided because these charges are
levied on retailers’ net purchases.
These components account for a relatively small fraction of our benchmark (less than
0.2 cents).
6 AEMC, 2017 Residential electricity price trends Final report, December 2017, p 19.
7 For this review, we used only the most recent three years of historical data to estimate the solar multiplier,
whereas in previous years we used data from each year from 2009-10. The reasons for this change in our
methodology are explained in Chapter 6.
8 We use a weighted average loss factor across the three distribution network areas in NSW, accounting for
both transmission and distribution line losses. Our Draft Report uses 2018-19 estimates based on loss
factors for 2017-18, which will be updated for the Final Report.
4 IPARTTable 1.1 Draft benchmark components for all-day solar feed-in tariffs in 2018-19
compared to 2017-18
2017-18 (final) 2018-19 (draft)
Average forward price (ASX
11.0 c/kWh 7.4 c/kWh
baseload price)
Solar multiplier 1.14 0.99
Network loss factor 1.01 1.01
NEM fees and charges 0.08 c/kWh 0.08 c/kWh
Note: The all-day feed-in tariff is calculated according to the following formula:
(Average forward price x solar multiplier x network loss factor) + NEM fees and charges.
2018-19 estimates based on loss factors for 2017-18, and projected NEM fees and charges for 2018-19. These will be updated
for the Final Report.
1.3 We have not proposed a range for the all-day tariff benchmark as we
expect little variation in the value of solar exports across the day
In previous years, we have set a benchmark range based on the value of solar at different
times of the day. We set the top of the range based on the two-hour window when the value
of solar exports was forecast to be highest (this was between 2 pm and 4 pm in 2017-18), and
the bottom of the range based on the value of exports at all other times.
However, in 2018-19, the wholesale value of solar is highest after 5:30 pm when less than 1%
of solar exports occur. Because such a small amount of solar generation occurs in this time
window, we considered that setting the top of the range in line with the value of solar at this
time in the same way as we have done in previous years would not provide a realistic guide
to customers about the value of solar for the overwhelming majority of their exports.
Our forecasts for 2018-19 indicate that the value of solar exports will hardly vary across the
times of the day when most solar exports occur. In particular between 6:30 am and 3:30 pm,
when 90% of all solar exports occur, there is very little variation. As a result, we have made
a draft decision to set a single ‘all-day’ benchmark for this review. This single benchmark
also provides a more useful comparator for the offers that are currently available in the
market, which provide only one feed-in rate regardless of the time that solar exports into the
market.
1.4 We have proposed benchmark ranges for time-dependent solar feed-in
tariffs
As noted above, for this review, the Government has asked us to also set a benchmark range
for time-dependent solar feed-in tariffs (ie, to guide retailers in setting a tariff that varies
depending on the time of day the solar customer exports to the grid). Retailers could offer
different feed-in tariffs across the day as an alternative to an all-day rate (however, currently
retailers are choosing to offer their customers a single feed-in tariff that applies at all times).
Our draft decision on the benchmark ranges for these tariffs are shown in Table 1.2. We
have set these ranges based on when the most price variation occurs during the day.
IPART 5Table 1.2 Draft benchmark ranges for time-dependent solar feed-in tariffs
Time window 2018-19 Proportion of solar
(c/kWh) exports
6:30 am to 3:30 pm 6.9 – 7.2 90.8%
3:30 pm – 4:30 pm 8.9 – 11.7 5.8%
4:30 pm – 5:30 pm 11.3 – 13.3 2.6%
5:30 pm – 6:30 pm 12.8 – 20.9 0.72%
6:30 pm – 7:30 pm 8.7 – 9.6 0.07%
7:30 pm – 8:30 pm 8.4 – 8.5 0.002%
Table 1.2 shows that the average value of solar is higher in the afternoon. This means it
would be more cost-reflective if retailers offered a higher feed-in tariff in the afternoon,
compared to the morning rate. If this were the case, some customers might respond by
supplying a greater proportion of their exports to the market during the afternoon (for
example, they may choose to install panels that face more towards the west instead of
north). Supplying more energy to the grid when it is most needed could help drive market-
wide efficiencies by putting downward pressure on wholesale prices at these times.
Even though solar exports are very low after 5:30 pm, we set separate benchmarks in the
later afternoon and evening because wholesale prices are highest at this time. Currently,
customers have a limited ability to respond to a high feed-in tariff in the very late afternoon
because there is limited sunlight at this time. However, these benchmarks provide a price
signal to customers with batteries, or considering purchasing batteries, about when they
should export their energy to the grid. Only around 1,600 households in NSW currently
have batteries, representing less than 0.1% of households. 9 But over time this signal will
become more important, as battery prices fall and their uptake increases.
The peak prices in the late afternoon and evening are being driven by high levels of
electricity demand at the same time of the day as solar output is falling. Higher wholesale
prices in the evening also reflect increasing ‘peakiness’ of wholesale prices in recent years, as
the demand-supply balance has tightened, particularly following the closure of Hazelwood
in Victoria in March 2017. This means that prices are often driven by higher cost generation
(such as gas generators) when demand is highest.
In setting the benchmarks, we:
Set one benchmark between 6:30 am and 3:30 pm, because there is very little variation
in wholesale prices across these times.
Set benchmarks for each one-hour period after 3:30 pm, when there is much more
price variation.
Set benchmarks after 6:30 pm that are not weighted by solar output. Solar exports are
negligible during these times, so the main reason for setting these benchmarks is to
provide a price signal for the value of battery exports.
We note that while the time-dependent feed-in tariffs are likely to be more cost-reflective,
retailers may continue to prefer to set an all-day rate, reflecting the small amount of
variation in the value of the vast majority of solar exports. Retailers submitted that a single
9 Australian Energy Council, Solar Report – January 2018, p 6.
6 IPARTall-day solar feed-in tariff is simple to understand and does not create complexity and
additional costs to retail operations. 10
1.5 We considered stakeholder comments and do not agree that solar feed-
in tariffs should be higher
Around 410 stakeholders made a submission in response to our Issues Paper. Many of these
stakeholders submitted that solar feed-in tariffs should be higher than our preliminary
estimate of 8.3 cents per kWh. Our draft benchmark for all-day solar feed-in tariffs is lower
than this, at 7.5 c/kWh, because it reflects the most recent forward contract wholesale price
from the ASX, which has fallen from 8 cents to 7.4 cents (less the contract premium) since we
released our Issues Paper.
Most of the issues that were raised in submissions have also been raised in previous reviews.
The most common themes in submissions were:
feed-in tariffs should include a subsidy to reflect the value of the environmental and
health benefits that solar electricity provides to the broader community,
feed-in tariffs should be the same as retail prices or retailers will profit unfairly from
solar customers,
reducing the solar feed-in tariff benchmark in line with wholesale costs would be
effectively punishing solar panel owners for their contribution in helping to reduce the
wholesale power price for all consumers, and
feed-in tariffs should also reflect the financial benefit to electricity network suppliers,
particularly the potential to defer network investment.
In general, if we were to set the benchmark for solar feed-in tariffs higher than the financial
value of customers’ solar exports to retailers (ie, the cost they avoid when they supply this
electricity to other customers rather than purchasing an equivalent amount on the NEM),
retailers would likely set the feed-in tariffs they offer below this benchmark.
Even if retailers were required to offer a minimum feed-in tariff equal to our benchmark, we
consider this benchmark should not exceed the financial value of solar exports to retailers
because this would result in:
higher costs to retailers, which they would then need to recover from all customers, or
retailers choosing not to supply solar customers, which would reduce competition for
solar customers.
As outlined in Section 1.1, our view is that households without solar panels should not have
to pay higher retail prices to reduce the bills of customers with solar panels. This would
disproportionately affect the households who are unable to install a solar system themselves
(for example, because they rent or they cannot afford the upfront costs).
Our specific responses to the common themes raised by stakeholders are set out below.
10 AGL submission to IPART Issues Paper, April 2018, p 2.
IPART 71.5.1 Customers already receive a subsidy when they install a solar system
Some stakeholders submitted that solar feed-in tariffs should include a subsidy to reflect
environmental and health benefits that solar electricity provides to the broader community.
However, solar customers already receive a subsidy designed to take account of benefits of
solar to the broader community. This is the subsidy provided by the Australian
Government’s Small-Scale Renewable Energy Scheme (SRES) when they install a solar
system. 11 This subsidy reduces the upfront costs of a solar system. The amount of the
subsidy is based on geographical location, installation date, and the amount of electricity the
system will generate or displace over its lifetime. For a 2-kilowatt solar system installed in
Sydney, the subsidy is currently worth around $1,050 to $1,330. 12 On average, all NSW
households pay around $15 each year through their bills to fund the Small-Scale Renewable
Energy Scheme subsidy. 13
In addition, retailers don’t capture the environmental or health benefits associated with solar
energy. This means that if a value for these benefits were included in feed-in tariffs, retailers
would need to recoup this amount from all their customers through higher retail prices.
1.5.2 Retailers would make a loss if feed-in tariffs were equal to retail prices
Numerous stakeholders submitted that retailers are unfairly profiting from solar customers
because they offer feed-in tariffs that are much lower than their retail charges, and that feed-
in tariffs should be the same as retail prices (‘1-for-1’). These stakeholders considered that
retailers can sell the solar electricity exported by their customers to other customers at little
or no cost on top of any feed-in tariffs they pay. But this is not true.
The metering and settlement arrangements in the NEM mean that retailers incur network
and green scheme costs for every kWh of electricity they supply to a customer, regardless of
where and how the electricity was generated. Therefore, retailers still pay these costs when
they supply electricity from solar exports (Figure 1.1).
If retailers were required to pay 1-for-1 solar feed-in tariffs, they would make a substantial
loss on solar customers. Therefore, they would most likely choose not to supply solar
customers. Alternatively, they would increase their retail prices to recoup this loss. We
11 Under the Small-Scale Renewable Energy Scheme, electricity retailers are required to purchase certificates
based on the volume of electricity they acquire each year. Retailers’ costs are recovered through their retail
electricity prices. See http://www.cleanenergyregulator.gov.au/RET/Scheme-participants-and-
industry/Renewable-Energy-Target-liable-entities, accessed 3 May 2018.
12 The estimated subsidy is based on a solar unit installed in Sydney on 24 April 2018. The price of certificates
(STCs) is assumed to be between $30 and $38 and the number of eligible certificates is based on the Clean
Energy Regulator’s Small generation unit STC calculator, https://www.rec-registry.gov.au/rec-
registry/app/calculators/sgu-stc-calculator, accessed 24 April 2018.
13 AEMC, 2017 Residential Electricity Price Trends, Final Report, 18 December 2017, p 100.
8 IPARTestimate that for 2018-19, this loss would be around $137 million per year state-wide, which
would add around $50 to the average annual household bill in NSW. 14
Figure 1.1 Cost components recovered in retail electricity prices
Note: Based on a representative market offer.
Data source: AEMC, 2017 Residential Electricity Price Trends, Final Report, 18 December 2017, p 100.
1.5.3 Customers should be paid the market value for the electricity they generate
As discussed in the sections above, we have found that solar generation has reduced
demand for electricity from retailers during daylight hours, which has contributed to lower
prices during these times. Many stakeholders argued that reducing the solar feed-in tariff
benchmark in line with wholesale costs would be effectively punishing solar panel owners
for their contribution in helping to reduce the wholesale power price for all consumers.
Similarly, the argument was put that because solar exports have contributed to the lower
wholesale prices upon which our solar feed-in benchmark calculation is based, that solar
customers should receive some of this benefit.
However, any new generator (or new customer) entering or exiting the electricity market
would change the balance of supply and demand, and thus could lead to lower or higher
wholesale electricity prices. Such a generator (or customer) would not be compensated for
this impact. For example, a new generator that contributes to a reduction in wholesale spot
prices does not receive any additional payment to reflect the lower wholesale price. It takes
the same market price as all other generators, and so all customers benefit from the price
reduction. Likewise, a customer who consumes electricity by switching on an appliance and
thereby increasing the market demand for electricity and electricity prices for all customers
is not required to compensate the other customers for these higher prices. These are normal
outcomes of a competitive market.
14 Based on total estimated solar exports, and forecast number of households in NSW, using data from
networks on solar exports and number of solar customers, and data from ABS 2016 Census data and New
South Wales Department of Environment and Planning for forecast of number of households (4% growth
assumed since 2016 based on average annual growth 2016-2021). See ABS, ‘2016 New South Wales
(STE) Community Profile’, cat. No 2001.0, Table G32,
http://www.abs.gov.au/websitedbs/D3310114.nsf/Home/2016%20Census%20Community%20Profiles;
http://www.planning.nsw.gov.au/Research-and-Demography/Demography/Population-projections. Estimates
may understate the total annual solar output, as no growth factor has been applied to latest available
customer numbers for 2018-19. This would result in an underestimate of additional costs to retailers and
customers.
IPART 9In our view, solar customers should be treated like any other generator in the competitive
electricity market.
1.5.4 Solar exports are not likely to provide system-wide net benefits for networks
Some stakeholders called for feed-in tariffs to include a value for the benefit that solar
provides to the electricity network, particularly the potential to defer investment in the
networks.
Because retailers do not capture any value associated with benefits to the networks, our
view is that such a payment would need to be made from the networks (rather than
retailers) to customers.
However, when this issue was considered by the AEMC in 2016, it decided not to introduce
a payment from networks to customers because it found that even in areas where there was
projected network congestion, payments to embedded generators (like solar) can increase
costs to consumers while offering little or no deferral of network investment. The analysis
showed that any benefit from additional embedded generation as a result of introducing a
network credit scheme would be far outweighed by the costs of the scheme. 15 The analysis
also showed solar combined with batteries had a limited additional effect on deferring
network investment, and that the benefit is still outweighed by the cost. 16
This is consistent with our analysis. We have found that solar exports are unlikely to
contribute to meeting peak demand on the distribution and transmission networks (because
the peak occurs in the late afternoon when the proportion of exports is very low), and
therefore are unlikely to defer network costs. Solar exports may impose costs on the
distribution network. For example, investments may be needed to support bi-directional
flows of electricity to handle the volume of solar exports.
1.6 We have found offers with higher feed-in tariffs are unlikely to result in
cheaper bills overall for solar customers
Our analysis shows that offers with higher feed-in tariffs do not necessarily result in lower
bills. As most solar customers import much more electricity than they export, the most
important thing they should consider when comparing market offers is the retail electricity
price they will be charged. This price typically includes per kilowatt hour (kWh) usage
charges, and a fixed daily supply charge ranging from 80 cents to $1.50 per day. Other
important factors are the terms and conditions associated with the offer, such as any contract
period, fees such as exit fees, and late payment fees.
Figure 1.2 compares the annual bills for all solar offers that are currently available in the
Ausgrid network area. We calculated the bills for a solar customer with a 2 kW system
(around 8 panels), assuming they used the average amount of electricity (6,500 kWh), and
used two-thirds of it in their home.
It shows that there is not a strong correlation between customers’ total bills and the feed-in
tariff offered. For many offers, a customer is better off overall with a lower-feed-in tariff
15 AEMC, Local Generation Network Credits, Final Rule Determination, December 2016, pp vi-vii.
16 AEMC, Local Generation Network Credits, Final Rule Determination, December 2016, pp vi-vii, 34.
10 IPART(because the retail tariffs offered by retailers are also lower). Of the offers in the market that
resulted in the highest bills, some had relatively high feed-in tariffs, and others had
relatively low feed-in tariffs.
Figure 1.2 Annual bills and feed-in tariffs (April 2018, Ausgrid network area)
Note: in this example, the 2 kW solar system generates 2,546 kWh per year.
Data source: IPART
Customers need to look at all elements of a retailer’s offer in deciding whether to accept an
offer, rather than focussing on the feed-in tariff. We encourage all customers, including
solar customers, to regularly shop around for a better deal. The Australian Government’s
Energy Made Easy website (www.energymadeeasy.gov.au) provides information about the
offers that are available. Customers can use the tool provided on the IPART website
(www.ipart.nsw.gov.au) to help compare these offers based on how much solar energy they
are likely to consume and export.
1.7 How you can contribute to this review
Our review process to date has involved detailed analysis and public consultation:
In March 2018 we released an Issues Paper that set out our proposed approach for the
review. We received 410 submissions.
We appointed Frontier Economics to provide expert advice on our proposed approach
to estimating feed-in tariffs. The Frontier Economics Report is available on our
website.
We are now inviting written submissions on this Draft Report from stakeholders by
4 June 2018. Page iii at the front of this report provides information on how to make a
submission. Late submissions may not be accepted. We do not have a specific set of
IPART 11questions for stakeholders to comment on. Instead, we invite stakeholders to address any of
our draft decisions, or provide additional information that is relevant to our estimates.
We will also be holding a public hearing on 15 May 2018 at the IPART offices in Sydney, to
provide stakeholders with a further opportunity to comment or seek clarification on this
report. We encourage stakeholders to register their attendance on our website.
We will consider all the issues raised in submissions and at the public hearing, and provide
a Final Report to the Minister by 30 June 2018.
For our following reviews of the benchmark feed-in tariffs (2019-20 and 2020-21) we propose
to undertake our consultation and analysis, and complete the reviews in April of each year.
1.8 List of draft decisions
1 The all-day solar feed-in tariff benchmark in NSW in 2018-19 is 7.5 c/kWh. 26
2 The time-dependent solar feed-in tariff benchmarks are: 30
– 6.9 to 7.2 c/kWh between 6:30 am and 3:30 pm (when 90.8% of solar exports occur) 30
– 8.9 to 11.7 c/kWh between 3:30 pm and 4:30 pm (when 5.8% of solar exports occur) 30
– 11.3 to 13.3 c/kWh between 4:30 pm and 5:30 pm (when 2.6% of solar exports
occur) 30
– 12.8 to 20.9 c/kWh between 5:30 pm and 6:30 pm (when less than 1% of solar
exports occur) 30
– 8.7 to 9.6 c/kWh between 6:30 pm and 7:30 pm (when less than 0.1% of solar
exports currently occur). 30
– 8.4 to 8.5 c/kWh between 7:30 pm and 8:30 pm (when less than 0.01% of solar
exports currently occur). 30
12 IPART1.9 What the rest of this report covers
The rest of this report explains our review and our draft decisions in more detail:
Chapter 2 outlines the context for this review
Chapter 3 explains our draft decisions on the benchmark for all-day solar feed-in tariffs
and the benchmark ranges for time-dependent solar feed-in tariffs for 2018-19
Chapter 4 explains our methodology for calculating these benchmarks
Chapter 5 explains how we forecast the average wholesale price of 2018-19, which is the
key component of our benchmark range
Chapter 6 explains how we calculated the solar multiplier.
IPART 132 Context for this review
To help retailers in setting solar feed-in tariffs, and solar customers in deciding whether
these tariffs are reasonable, IPART sets benchmark solar feed-in tariffs each year. However,
the revenue customers receive from solar feed-in tariffs is a relatively minor benefit of
having solar panels. The main benefit is that customers can save money when they use
electricity generated by their solar panels, rather than buying it from their retailer.
As context for our review, the sections below:
explain IPART’s role in reviewing solar feed-in tariffs
provide more information on the financial benefits of having solar panels, and how this
varies under different metering arrangements
report on the feed-in tariffs currently on offer, and
analyse whether higher solar feed-in tariffs lead to lower electricity bills.
2.1 IPART’s role in reviewing solar feed-in tariffs
We have been reviewing the solar industry since 2011, following the introduction of the
Solar Bonus Scheme in 2010. Initially, our role was to set ‘retailer contributions’ towards the
costs of the Solar Bonus Scheme, and to set a benchmark range for solar feed-in tariffs for
solar customers who were not part of this scheme 17 (see Box 2.1).
This year, we have received a Terms of Reference under Section 9 of the Independent Pricing
and Regulatory Tribunal Act 1992 (IPART Act) which asks us to review solar feed-in tariffs
annually for the next three financial years.
Consistent with our reviews for previous years, we are required to set a benchmark range
that:
should not lead to solar feed-in tariffs that contribute to higher retail electricity prices,
and
should operate in a way that supports a competitive electricity market in NSW.
Essentially, these two conditions mean that we cannot set the benchmark range higher than
the financial value of the electricity exported by solar customers to a retailer – that is, the
price it would pay to purchase that electricity from the NEM.
We are also required to set time-dependent benchmark ranges for solar feed-in tariffs – that
is, ranges for electricity supplied to the grid at different times of day.
17 IPART, Solar feed-in tariffs – 2011-2012,
https://www.ipart.nsw.gov.au/Home/Industries/Energy/Reviews/Electricity/Solar-feed-in-tariffs-2011-to-
2012?qDh=0, accessed 1 May 2018.
14 IPARTBox 2.1 IPART’s role in reviewing feed-in tariffs over time
Setting Solar Bonus Scheme ‘retailer contributions’
IPART was first asked to review solar exports in 2011. At that time, the NSW Government had
introduced the Solar Bonus Scheme, which provided a subsidised feed-in tariff to solar customers
from 2010. Initially, the feed-in tariff was set at 60c/kWh. This was reduced to 20c/kWh for
participants that entered the scheme between 28 October 2010 and 1 July 2011, when it was
closed to new participants. Participants in the scheme received these payments until the scheme
ended on 31 December 2016.
Over the life of the scheme, the total amount paid in feed-in tariffs was around $1.25 billion. Most
of the subsidy to customers was funded through a levy on electricity distribution networks, which
was passed on to all electricity customers in NSW. However, retailers were also benefiting from
the scheme: when customers exported solar energy to the grid, retailers could save on the amount
of wholesale electricity they had to purchase from the NEM (National Electricity Market) to supply
their customers. Therefore the NSW Government passed legislation that allowed the Minister to
ask IPART to determine the ‘retailer contribution’ to the Solar Bonus Scheme each year based on
the value of these savings. We published our first determination in June 2012 for the 2012-13
financial year.
Setting the benchmark range for customers outside the Solar Bonus Scheme
Customers who installed solar panels after 1 July 2011 were not eligible for the Solar Bonus
Scheme. As part of our first review in 2011, the Government asked us to advise whether retailers
should be obliged to provide a feed-in tariff for these solar customers, and if so, how it should be
set.
We recommended that the best way to implement a feed-in tariff was to set a benchmark range to
help guide retailers and customers, based on the savings to retailers. We considered that this
would provide the best balance between the risk that regulatory intervention would deter
competition for solar customers, against the risk that solar customers may not receive a payment
for the value of the electricity they export to the grid without regulatory intervention. We considered
that the benchmark range should be set annually because the significant volatility in wholesale
prices would make it difficult to set a reasonably accurate range for a period longer than one year.
As part of our 2011 review, we set a benchmark range for 2011-12, and in each year following this
review, the NSW Government has asked us to continue to set an unsubsidised benchmark range.
Our legislative role in determining the retailer contribution and benchmark range ended with the
conclusion of the Solar Bonus Scheme in December 2016. However, the NSW Government has
asked us to continue reviewing solar feed-in tariffs.
Source: IPART, Solar feed-in tariffs, Final Report, March 2012, pp 145-148, Section 43ECA of the Electricity Supply Act
1995 (repealed); IPART, Solar Feed-in tariffs, Final Report, March 2012, pp 115-116, 101-102, Statutory Review, Report to
the Minister for Resources and Energy, August 2014, p ii.
IPART 152.2 Solar customers make substantial savings off their bills
Most solar customers in NSW have net meters. Under a net metering arrangement
customers:
Use the electricity they generate to power their home, and they save money because
they don’t need to buy this electricity from their retailer.
Export solar energy to the grid when they generate more electricity than they need to
power their home. They may receive a solar feed-in tariff for this amount (if such a
tariff is included in their market offer).
Import the shortfall from the grid when their solar panels generate less electricity than
required to power their home (such as at night). They pay the retail price for this
amount.
The savings that customers make off their bills are the largest financial benefit from having
solar panels. They are typically much larger than the revenue they make from receiving a
solar feed-in tariff for the energy that they export. This means that customers are better off
consuming the energy that they generate, which saves them from buying this electricity
from their retailer, rather than exporting it to the grid.
For example, Figure 2.1 shows an example of two customers on a typical offer who consume
the same amount of energy (6,500 kWh per year), and generate the same amount of energy
with panels (around 2,546 kWh with a 2 kW panel). Inclusive of GST, the offer has:
a fixed charge of 87.07 cents per day,
a consumption charge of 27.5 c/kWh, and
a feed-in tariff of 11.3 c/kWh.
The first customer only exports one-third of the electricity that they generate (and uses two-
thirds to power their home). With a feed-in tariff of 11.3 c/kWh exported, they earn $101 on
the energy they export over the year. The second customer exports two-thirds of their solar
electricity, and earns a higher amount of $187 per year.
However, the first customer has a significantly lower bill ($1,555 compared to $1,677),
because by consuming their energy in the home, they have saved $452 in retail charges,
compared to only $243 saved by the second customer.
16 IPARTFigure 2.1 Annual bills for typical solar customers with a net meter
Note: In this example, the 2 kW solar system generates 2,546 kWh per year.
Source: IPART analysis using data from energymadeeasy.com.au.
In addition to the savings from their bills and the revenue from feed-in tariffs, solar
customers are eligible for a one-off subsidy when they install solar panels under the
Commonwealth Small-Scale Renewable Energy Scheme (SRES). The size of the subsidy
varies with the size of the system installed, as it is based on the expected generation from the
system until the Small-Scale Renewable Energy Scheme ends in 2030. Currently, the subsidy
ranges from around $1,050 to $1,330 for a 2 kW system to around $3,000 for a 5 kW system.
This covers around 25-35% of the total system costs. 18 The costs of the Small-Scale
Renewable Energy Scheme subsidy are paid for by retailers, and passed onto customers
through electricity retail prices.
2.2.1 Customers are currently better off with net meters than gross meters
Unlike customers with net meters, customers with gross meters do not make savings off
their bill when they generate solar electricity. All the energy that they generate is exported
to the grid, and they earn a feed-in tariff on this energy. They then have to buy all the
energy that they use from their retailer. Customers with gross meters will only be better off
than customers with net meters if their feed-in tariff is higher than the retail price of
electricity. This was the case under the Solar Bonus Scheme, when the initial feed-in tariff
was 60 c/kWh, outlined in Box 2.1 above.
18 The values for financial incentives under the Small-Scale Renewable Energy Scheme assume the solar unit
is installed in Sydney on 24 April 2018. The dollar range is based on certificate prices of $30 and $38.
Clean Energy Regulator, Small generation unit STC calculator, https://www.rec-registry.gov.au/rec-
registry/app/calculators/sgu-stc-calculator, accessed 24 April 2018; Green Electricity Markets, STC Market
Prices, http://greenmarkets.com.au/resources/stc-market-prices, accessed 24 April 2018. Solar Choice,
Current Solar System Prices: Residential and Commercial, https://www.solarchoice.net.au/blog/solar-power-
system-prices, accessed 24 April 2018.
IPART 17Figure 2.2 shows the difference in the annual bill for the same offer as in Figure 2.1,
however, in this example one customer has a net meter, and one customer has a gross meter.
The customers consume two-thirds of the energy they generate, and export one-third to the
grid.
For the customer with the gross meter, for each kilowatt hour they use at the same time their
panels are exporting electricity, they pay the full 25 cents for the usage tariff, to their retailer,
and receive a 11.3 cent feed-in tariff for the electricity they generate. This means that they
pay a net amount of 13.7 cents for this electricity that they consume. By contrast, with a net
meter, for each kilowatt hour a customer generates and consumes themselves, they receive
no feed-in tariff, but they save the full 25 cents on the retail price of electricity because they
can avoid purchasing this electricity from their retailer. Figure 2.2 shows that in this
example, for the same consumption and solar exports, the customer with the net meter is
$265 better off.
Figure 2.2 Annual bills for customer with net meter versus gross meter
Note: In this example, the 2 kW solar system generates 2,546 kWh per year.
Source: IPART analysis using data from energymadeeasy.com.au.
Solar customers who still have a gross meter can ask their retailer to install a net meter.
Retailers may charge customers for the costs of the meter and installation.
We note that throughout 2017, it sometimes took several months for retailers to install a net
meter after receiving a customer request. The Energy and Water Ombudsman (EWON)
received a large number of complaints about installation delays. These delays were due to a
range of factors – including installations taking more time than expected; a lack of qualified
installers, aged/damaged house/meter wiring; the presence of asbestos or other meter
18 IPARTboard/box quality issues; and problems with access to meters. EWON is working with
retailers to resolve these issues. 19
2.3 Retailers are currently offering feed-in tariffs of around 6-20 cents
As at April 2018, 20 of the 25 retailers operating in NSW offered a solar feed-in tariff as part
of their generally available market offers. 20 These tariffs varied from 6.1 cents to 20 c/kWh
(Figure 2.3). Retailers offered the same feed-in tariff across each network area where they
were selling electricity.
Our recommended benchmark range for 2017-18 is 11.9 c/kWh (for off-peak times) to
15.0 c/kWh (at peak times). 21 We note that for their generally available offers, all retailers
are offering a flat all-day rate across the whole day, rather than different feed-in tariffs for
peak and off-peak times. IPART’s equivalent all-day benchmark is 12.8 c/kWh. However,
some retailers are partnering with technology companies and offering pricing plans that
intermittently pay customers more than $1 per kWh, or around 10 times the usual rate to
provide an incentive for customers to export electricity during extreme high price events (for
more details see Box 3.2 in Chapter 3).
When comparing retailers’ all-day feed-in tariffs to our benchmark feed-in tariff range for
2017-18, we found that of the retailers offering tariffs:
Eighteen offered a solar feed-in tariff that was below our all-day benchmark feed-in tariff
of 12.8 c/kWh, and 15 of these were below the lower end of the benchmark range. The
lowest of these was 6.1 c/kWh.
Six offered a feed-in tariff equal or greater than our all-day benchmark, with five
retailers offering more than 15.0 c/kWh (the upper end of the benchmark range). The
highest of these was 20 c/ kWh.
Five retailers had more than one solar feed-in tariff option.
19 EWON, Consumer Issues, 16 March 2018, https://www.ewon.com.au/page/publications-and-
submissions/annual-reports/2016-17/consumer-issues
20 Data from www.energymadeeasy.com.au.
21 IPART, Solar feed-in tariffs – benchmark range 2017-18, Final Report, June 2017, p 1.
IPART 19Figure 2.3 Solar feed-in tariffs available in NSW, based on retailers’ market offers in
April 2018
25
20
20
17 17 17
16
15
15
12.5 12.8 12.87
12 12
c/kWh 11.1 11.1 11.1 11.1
10 10
9 9 9
10 11.3 11.6 11.6
8
7
6.1
5
0
CovaU
EnergyAustralia
Enova Energy
Amaysim
Sanctuary Energy
Red Energy
Commander
Click Energy
Mojo Power
Momentum Energy
People Energy
Pooled Energy
Alinta Energy
Lumo Energy
Dodo
Diamond Energy
Energy Locals
Actew AGL
AGL
1st Energy
Qenergy
Simply Energy
Origin Energy
Powerdirect
Powershop
IPART's Benchmark Range Solar feed-in tariffs offered IPART's all-day feed-in tariff
Note: Enova Energy was only retailing in the Essential Energy network area and Pooled Electricity was only supplying
electricity in the Ausgrid and Endeavour Energy network areas.
Data source: IPART analysis, using data from www.energymadeeasy.com.au.
Figure 2.4 shows that feed-in tariffs offered in the market have changed from year to year,
mainly reflecting the fluctuation in the forecast average wholesale prices.
Figure 2.4 IPART’s solar benchmarks over time (2011-12 to 2017-18, nominal $)
18
16
14
12
10
c/kWh
8
6
4
2
0
2011/12 2012/13 2013/14 2014/15 2015/16 2016/17 2017/18
Benchmark Range Solar Feed-in Tariffs Offered
Source: IPART reports, and IPART analysis using data from energymadeeasy.com.au.
20 IPART2.4 Do higher feed-in tariffs lead to lower electricity bills?
When solar customers are comparing retailers’ market offers, the level of the feed-in tariff
included in the offer is not the only factor they should consider. Most solar customers
import much more electricity than they export, and so the most important driver of their
bills is the retail price they pay to buy electricity when their solar panels are not generating
(such as at night or on cloudy days when the sun is not shining). Customers also pay a fixed
retail charge of around 80 cents to $1.50 per day. Other important factors are the terms and
conditions associated with the offer, such as any contract period, early termination fees etc.
This means that offers with higher feed-in tariffs will not necessarily result in lower bills.
We analysed the offers that are currently being offered to customers to consider whether
customers are likely to be better off on offers with higher solar feed-in tariffs. Figure 2.5
compares the annual bills for all solar offers that are currently available in the Ausgrid
network area. We calculated the bills for a solar customer with a 2 kW system (around 8
panels), assuming they used the average amount of electricity (6,500 kWh), and used two-
thirds of it in their home.
It shows that there is not a strong correlation between customers’ total bills and the feed-in
tariff offered. For many offers, a customer is better off overall with a lower-feed-in tariff
(because the retail tariffs offered by retailers are also lower). Of the offers in the market that
resulted in the highest bills, some had high feed-in tariffs, and others had lower feed-in
tariffs.
Figure 2.5 Annual bills and feed-in tariffs (April 2018, Ausgrid network area)
Note: In this example, the 2 kW solar system generates 2,546 kWh per year.
Data source: IPART analysis using data from energymadeeasy.com.au.
IPART 21You can also read