Working Paper Series Strategic interactions and price dynamics in the global oil market
←
→
Page content transcription
If your browser does not render page correctly, please read the page content below

Working Paper Series
          Irma Alonso Alvarez, Virginia Di Nino,   Strategic interactions and price
                               Fabrizio Venditti
                                                   dynamics in the global oil market

                                                    No 2368 / January 2020

Disclaimer: This paper should not be reported as representing the views of the European Central Bank
(ECB). The views expressed are those of the authors and do not necessarily reflect those of the ECB.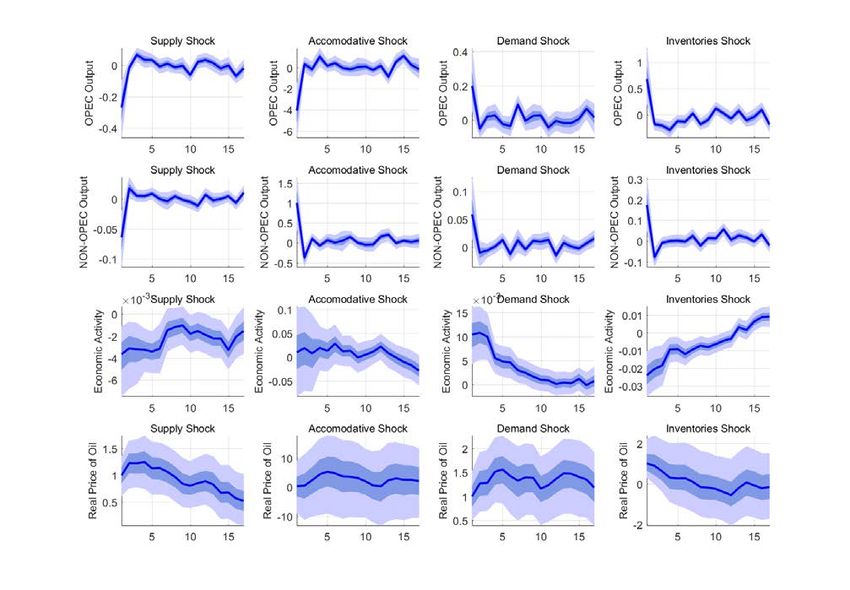
Abstract

      In a simplified theoretical framework we model the strategic interactions between OPEC
      and non-OPEC producers and the implications for the global oil market. Depending on
      market conditions, OPEC may find it optimal to act either as a monopolist on the resid-
      ual demand curve, to move supply in-tandem with non-OPEC, or to offset changes in
      non-OPEC supply. We evaluate the implications of the model through a Structural Vec-
      tor Auto Regression (VAR) that separates non-OPEC and OPEC production and allows
      OPEC to respond to supply increases in non-OPEC countries. This is done by either in-
      creasing production (Market Share Targeting) or by reducing it (Price Targeting). We find
      that Price Targeting shocks absorb half of the fluctuations in oil prices, which have left
      unexplained by a simpler model (where strategic interactions are not taken into account).
      Price Targeting shocks, ignored by previous studies, explain around 10 percent of oil price
      fluctuations and are particularly relevant in the commodity price boom of the 2000s. We
      confirm that the fall in oil prices at the end of 2014 was triggered by an attempt of OPEC
      to re-gain market shares. We also find the OPEC elasticity of supply three times as high
      as that of non-OPEC producers.

      JEL classification: Q41, Q43
      Keywords: OPEC, shale, oil, VAR

ECB Working Paper Series No 2368 / January 2020                                                     1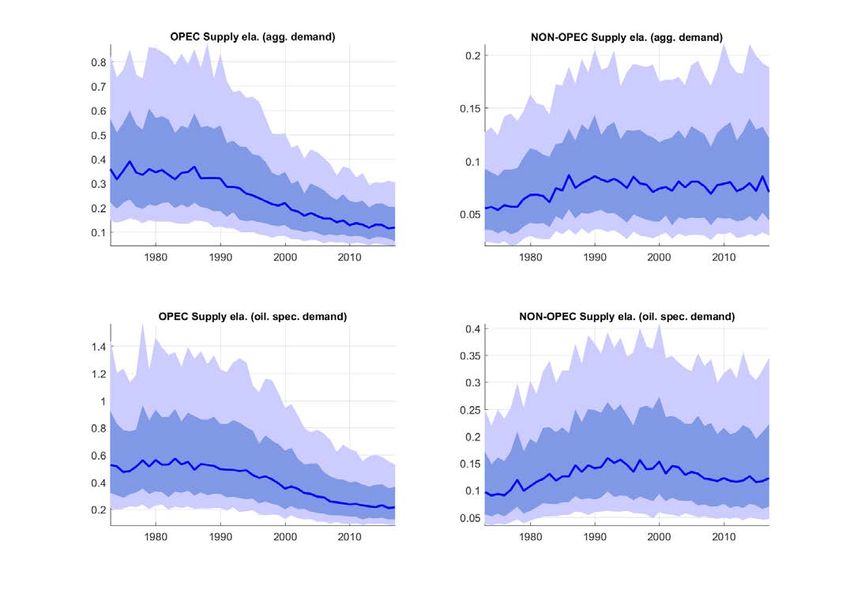
Non-technical Summary

Academics have long debated about the competitive structure of the global oil market and on the
consequences for oil price formation. Existing studies have discussed whether OPEC is a cartel or
a form of internal Stackelberg competition, to what extent members cooperate-coordinate their pro-
duction strategies and the role of Saudi Arabia as the swing producer. More recently theoretical
frameworks have considered the possibility that OPEC pursues different production strategies, de-
pending on competitors’ efficiency, production capacity and aggregate demand, in addition to internal
OPEC cohesion.

    We find the macro-empirical literature has somewhat disconnected from the debate, remaining
anchored to the question of whether oil price fluctuations are dominated by unexpected changes
in the supply of oil, or by shifts in global demand. In these studies, differences in the competitive
environment of the global oil market play a limited role in guiding the identification of structural
shocks. This is despite the acknowledgement that OPEC has the possibility and incentive (given
the large market share and the production spare capacity) to act as a monopolist on the residual
part of the demand curve. In recent years, the unprecedented surge in US shale oil production has
radically changed market conditions, raising the question on whether this had an influence on oil price
dynamics.

    In this work we bridge the gap between theory and empirics, drawing a direct link between market
structure and implications for structural empirical models of the global oil market. We show, in a
simplified theoretical framework, how strategic interactions between a dominant player and fringe
competitive firms can affect the oil market equilibrium. In particular the dominant player (OPEC)
can operate alternative strategies, whereas fringe firms take as given market conditions and produce
as much as their capacity allows. Specifically OPEC can act as a monopolist on the residual demand
curve, and move its production in tandem with the production of the fringe firms (thereby following
Market Share targeting). This is an attempt to keep market shares stable. Another option is to move
production in the opposite direction to non-OPEC producers, thus attempting to stabilize prices
around a target (Price Targeting). Next we ask to what extent these results can help our understanding
of oil price dynamics in recent decades.

    Following Kilian and Murphy (2014), we set up a Structural Vector Autoregressive Model (SVAR)
of the global oil market in which we jointly model oil production, global economic activity, oil invento-
ries and the price of oil. We modify the model in two directions to take into account the implications of
our theoretical setup. First, we model OPEC and non-OPEC production separately. Second, we allow
for distinct reactions from OPEC following a supply shock from non-OPEC countries. In the first case

ECB Working Paper Series No 2368 / January 2020                                                        2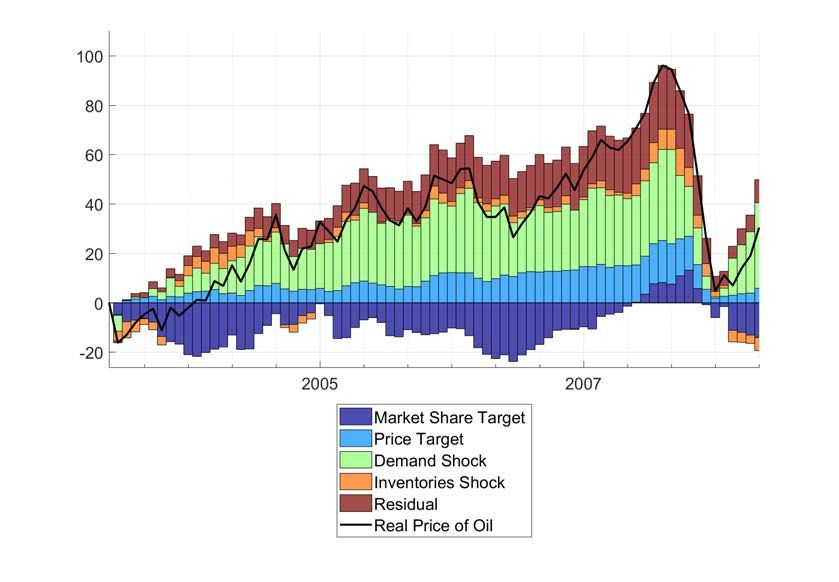
we let OPEC production move in the same direction as that of non-OPEC production. This identi-
fication restriction coincides with the one employed by Kilian and Murphy (2014), Baumeister and
Peersman (2013) and Baumeister and Hamilton (2019) to identify an oil supply shock. Consistently
with our theoretical model, we define such shock a Market Share Targeting shock. In the second case
we let OPEC production move in the opposite direction with respect to that of non-OPEC production,
therefore stabilizing prices. We call this second shock a Price Targeting shock.

    The main results of our empirical analysis are the following. First, Price Targeting shocks account
for around 10 percent of the overall oil price forecast error variance on all horizons. They absorb
around half of the forecast error variance that is left unexplained in a smaller model in which OPEC
and non-OPEC production are not distinguished and only aggregate supply shocks are considered.
Second, OPEC targeted prices, rather than market shares, in the early 2000s, somewhat contributed
to booming oil prices in the run-up to the crisis. Third, we can characterize the supply elasticity
for OPEC (0.20) to be notably higher than non-OPEC supply elasticity (0.06), on account of the
OPEC’s option to rapidly resort to spare capacity. Demand elasticity (−0.28) is quantitatively in line
with those obtained in recent studies (see Caldara, Cavallo, and Iacoviello (2019) and Baumeister and
Hamilton (2019)).

ECB Working Paper Series No 2368 / January 2020                                                      3
1        Introduction

Theoretical papers have long debated on the competitive structure of the global oil market and on
the consequences for oil price formation. Existing studies have discussed whether OPEC is a cartel
or a form of internal Stackelberg competition (Dahl (2004) and Berg, Kverndokk, and Rosendahl
(1997)), to what extent members cooperate-coordinate their production strategies (Geroski, Ulph,
and Ulph, 1987) and the role of Saudi Arabia as the swing producer (Nakov and Nuno, 2013). A
more sophisticated approach is taken by Behar and Ritz (2017), who set up a model where OPEC can
pursue alternative production strategies, depending on competitors’ efficiency, production capacity
and aggregate demand, in addition to internal OPEC cohesion. Some authors have also looked at how
the market structure has evolved over time; Huppmann and Holz (2012b), for instance, argue that it
has shifted from an oligopoly to a more competitive environment following the Great Recession.

        The macro-empirical literature has remained somewhat disconnected from these studies and has
focused on a relatively top-down question, i.e. whether oil price fluctuations are dominated by un-
expected changes in the supply of oil or by shifts in global demand. In the early literature, supply
factors were typically assumed to be the major drivers of oil prices. Little attention was paid to the
underlying nature of oil price shocks and to their different macroeconomic effects. This view persisted
until the end of the 2000s, when an increasing consensus identified global demand conditions as the
key factor explaining oil price movements, especially in specific episodes like the run-up to the 2008
crisis, (see Kilian (2008), Kilian (2009), Kilian and Murphy (2014), Baumeister and Peersman (2013)
and Baumeister and Hamilton (2015)). It is worth noticing that, in these studies, differences in the
competitive environment of the global oil market play a limited role in guiding the identification of
structural shocks. This is despite the acknowledgement that OPEC has the incentive and the ability
(given their production spare capacity and their relatively large market share) to act as a monopolist
on the residual part of the demand curve (Caldara, Cavallo, and Iacoviello, 2019). A loose relationship
between market conditions and structural oil price drivers is implicitly drawn by Kilian and Murphy
(2014), who assume oil supply elasticity to be relatively low. In recent years, the unprecedented surge
in US shale oil production has radically changed market conditions, raising the question on whether
this has had a influence on oil price dynamics (Foroni and Stracca (2019)), and its potential impact
on Arab oil producers’ economic policies (Kilian (2017)).1

        While the focus in this work lies on an improved assessment of the contribution of OPECs strategy,
and therefore of the contribution of supply shocks, to oil price fluctuations, a number of studies have
    1
     The shale oil revolution has attracted significant interest because it has marked a historical and unexpected turning
point in US energy production trends. After three decades of steady decline, US oil production provided the largest
contribution to global supply growth in the period from 2012 to 2014 and today rivals Saudi Arabia and Russia in terms
of its share in global oil production.

ECB Working Paper Series No 2368 / January 2020                                                                         4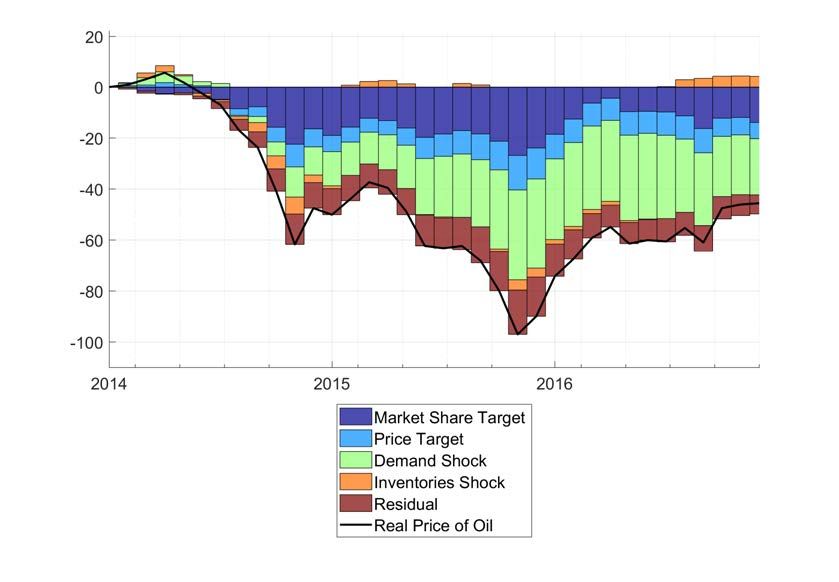
instead investigated to what extent the activity of speculators in oil financial markets influences
crude prices. Results are not univocal. Juvenal and Petrella (2015) encompass speculative shocks
identified through a standard scheme of sign restrictions in a VAR model using factors extracted from
a dynamic factor model. They find that speculative shocks start driving oil price upward in 2004,
which is consistent with the timing when oil financial markets begun experiencing brisk investment
inflows. They however confirm demand remains the dominant driver behind the oil price spike of 2008.
On the contrary Chari and Christiano (2017) using a large panel dataset containing information on
multiple commodities find no significant empirical link between price behaviour and futures market
trading. In the same vein, Fattouh and Mahadeva (2013) argue that there is no enough evidence to
support a relevant role of speculation in driving oil prices in the run up to the global financial crisis.2

    In this paper we contribute to the literature by drawing a direct link between strategic interactions
in the oil market and its implications for structural empirical models of the global oil market. We start
by presenting a simple theoretical framework that shows how strategic interactions can affect the oil
market equilibrium. We consider a standard dominant firm-competitive fringe model for the crude oil
market (see Golombek, Irarrazabal, and Ma (2018) among others). This environment is populated by
fringe firms (shale producers for instance) that are atomistic, and one large player/producer (namely
OPEC) that can exert market power and willingly influence the oil market equilibrium. In our setup,
fringe firms take as given market conditions and supply as much as their capacity allows them to
produce. OPEC, on the other hand, takes as given the production of the fringe firms and acts as a
monopolist on the residual demand, strategically adjusting its production. However we depart from
standard frameworks since in our model, depending on market conditions, OPEC can follow three
strategies. Specifically it can operate as a monopolist on the residual demand curve, it can move its
production in tandem with the production of the fringe firms, in an attempt to keep market shares
stable. Alternatively it can modify the production in the opposite direction to non-OPEC producers,
this time in an attempt to stabilize prices. Next we ask to what extent these results can help our
understanding of oil price dynamics in recent decades.

    This empirical strategy seems to be underpinned by the time-varying correlation between OPEC
and non-OPEC supply. The developments of the correlation of OPEC and non-OPEC supply across
time may reflect changes in the modus operandi of OPEC. In particular, Figure 1 shows the two
strategies pursued by OPEC in the aftermath of the emergence of US shale production: its Price
Targeting strategy and the switch from Price to Market Share Targeting in September 2014. Both
policies are indicated by the red dotted vertical bars. We interpret the chart through the lenses of our
theoretical underpinnings.
   2
     Another question is the relation between oil prices and stock markets. For an extensive and interesting survey on
this topic, see Degiannakis, Filis, and Arora (2018)

ECB Working Paper Series No 2368 / January 2020                                                                     5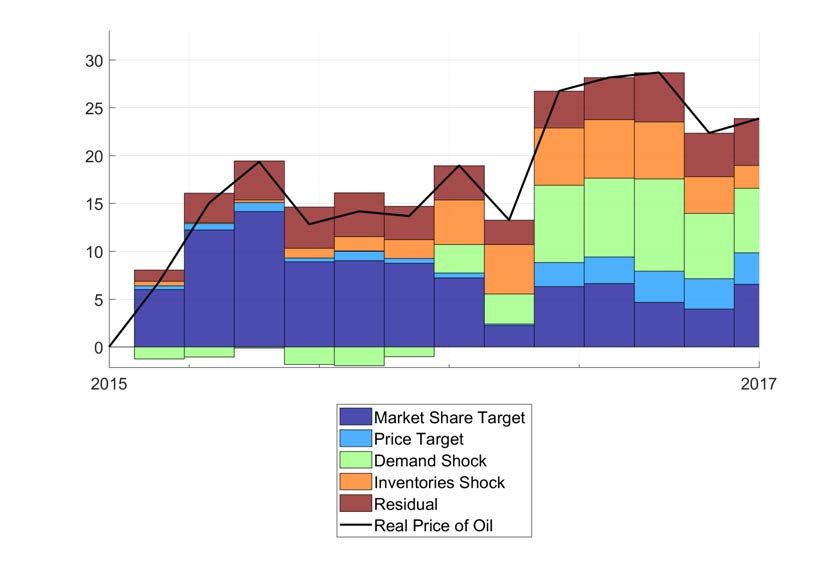
Figure 1: Time varying correlation between OPEC and non OPEC supply

Notes: 60-month moving windows correlation between OPEC and non OPEC supply.

       Until the start of the commodity super-cycle in early 2000, OPEC appears to have acted mainly as
a monopolist on the residual demand. A modest positive correlation between OPEC and non-OPEC
production suggests that higher global consumption was met gradually at increasing crude oil prices.
But, the price spiral during the super-cycle period was also the result of OPEC manipulating global
supply to maintain quotations rather high (since the correlation falls below zero). If we exclude the
peak of the global financial crisis ( when this correlation was mainly driven by demand forces), the
Price Targeting strategy was pursued until 2014. Indeed in the first stage of the shale age (from
2010 until the third quarter of 2014) OPEC kept restraining its own production as shale supply
kept expanding unabated.3 Over this period, the correlation between OPEC and non OPEC supply
remained below zero, exactly as predicted by the Price Targeting strategy in our model. Since then,
OPEC has been mainly worried about defending its market share. In a world of declining production
costs, as we explain in details in section 2, the attempt of the dominant player to fix a price is doomed
to fail. Indeed we believe a trigger of the switch in OPEC’s production strategy was the persistent
upward revision of the medium and long-term profile of shale production and reserves in mid-2014.
From the end of 2014 the correlation reverts to a positive trend.

       Following Kilian and Murphy (2014), we set up a Structural Vector Autoregressive Model (SVAR)
of the global oil market in which we jointly model oil production, global economic activity, oil invento-
ries and the price of oil. We modify the model in two directions to take into account the implications
of our theoretical setup. First, we model OPEC and non-OPEC production separately. Second, we
   3
       This is documented in monthly oil bulletins by the increasing spare capacity of the cartel joint with a reduced supply

ECB Working Paper Series No 2368 / January 2020                                                                            6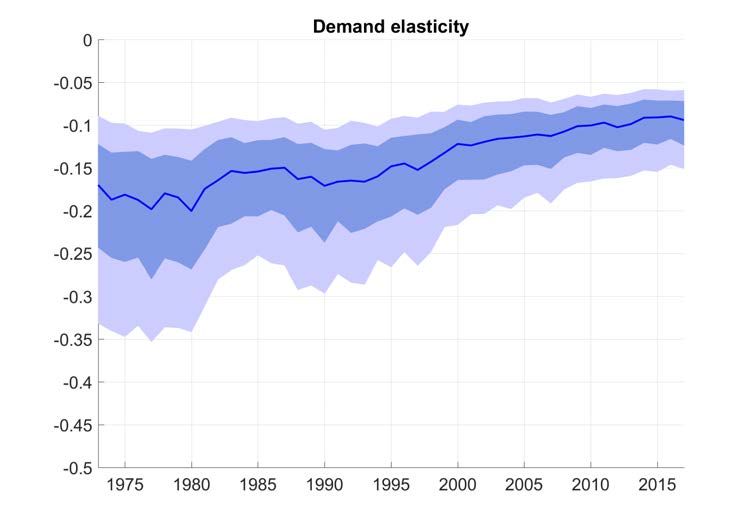
allow for distinct reactions of OPEC following a supply shock from non-OPEC countries. In the first
case, we let OPEC production move in the same direction as that of non-OPEC production. This
identification restriction coincides with the one employed by Kilian and Murphy (2014), Baumeister
and Peersman (2013) and Baumeister and Hamilton (2019) to identify an oil supply shock. Consis-
tently with our theoretical model, we define this shock as a Market Share Targeting shock. In the
second case, we let OPEC production move in the opposite direction to that of non-OPEC produc-
tion, therefore stabilizing prices. We call this second shock a Price Targeting shock. To the best of our
knowledge, no previous work has so far quantified the implications for price developments of different
OPEC’s production strategies. In particular the literature has so far only considered one type of sup-
ply shock, overlooking the fact that in oligopolistic markets major producers can decide to compete
over quantities or over prices.

    The main results of our empirical analysis are the following. First, Price Targeting shocks account
for around 10 percent of the overall oil price forecast error variance on all horizons. They absorb
around half of the forecast error variance that is left unexplained in a smaller model in which OPEC
and non-OPEC production are not distinguished and only aggregate supply shocks are considered.
Second, OPEC targeted prices, rather than market shares, in the 2000s, somewhat contributed to
booming oil prices in the run-up to the crisis. Third, we can characterize different supply elasticities
for OPEC and non-OPEC producers. We estimate aggregate price elasticities of supply (0.10) and
demand (−0.28) that are quantitatively in line with those obtained in recent studies, see Caldara,
Cavallo, and Iacoviello (2019) and Baumeister and Hamilton (2019). We estimate the price elasticity
of OPEC supply to be around 0.2, similarly to (Caldara, Cavallo, and Iacoviello, 2019), and to be
notably higher than that of non-OPEC suppliers (0.06). This difference is related to the OPEC’s
option to rapidly adapt production by resorting to spare capacity.

    The remainder of the paper is organized as follows. In section 2, we provide a brief overview of the
theoretical underpinnings behind the empirical identification strategy. Section 3 discusses the empirical
strategy developed, highlighting the differences with previous known models. Section 4 presents the
empirical results. Section 5 concludes.

2     Theoretical framework

In this section, we present a simple theoretical framework that accounts for strategic interactions of
oil producers. This model will be used to assess under which conditions it is optimal for OPEC to
switch from one strategy to another.

    The oil market has traditionally been modeled as a special case of an imperfectly competitive

ECB Working Paper Series No 2368 / January 2020                                                        7
market. While previous works suggest that oil players compete a la Cournot, or OPEC acts as a
Stackelberg leader, Huppmann and Holz (2012a) show that the oil market structure has evolved
over time, changing from an oligopoly to a more competitive framework after the Great Recession.
Moreover, Hansen and Lindholt (2008) suggest that the characteristics of a dominant producer model
can fit well the behaviour of OPEC after 1994.
As in Golombek, Irarrazabal, and Ma (2018), we consider a dominant firm-competitive fringe model
for the crude oil market. We assume the existence of one large player/producer, namely OPEC, that
can exert market power and influence the equilibrium. Nonetheless our theoretical framework departs
from their model in a series of key features. Foremost our model encompasses three possible different
types of behaviour of the dominant player. OPEC can play monopolist on the residual demand or act
strategically adjusting its production in response to changes in the production of the fringe firms in
order to either steer the equilibrium price or to make room for greater production. Unlike OPEC, the
rest of producers, called fringe firms, (shale producers for instance) are atomistic, meaning that they
take as given market conditions and stay ready to supply as much as their capacity allows them to
produce. Therefore, non-OPEC producers are assumed to be price-takers. The different competitive
behaviour between the dominant and the fringe firms is determined by the lower cost of production of
the former, in this case OPEC. Furthermore the possibility for OPEC to pursue alternative strategies
in our model depends on the assumption we hold about marginal costs of the two different types
of players. Our model assumes constant marginal costs for OPEC and increasing marginal costs for
non-OPEC.
In this framework, OPEC can act strategically since its production has an impact on the price of oil:
if OPEC increases (decreases) its production, the price of oil will decrease (increase), caeteris paribus.
Specifically OPEC can follow two different strategies as the marginal revenue has two sections in this
model: it can charge a high price so both the dominant and the fringe firms make profits or break-even
or it can set a low price such as the fringe firms are obliged to shut down to avoid making losses and
the dominant firms becomes a monopoly. The decision will depend on OPEC’s inter-temporal profit
maximization problem, given by the following function:
t=T
X
Π= β t [(pt − c)QO ] (1)
t=0
where QO is OPEC’s production, pt is the price of oil, c is the constant marginal production cost
and β is the time discount factor. To keep the model as streamlined as possible, the demand schedule
ECB Working Paper Series No 2368 / January 2020 8is assumed linear, a hypothesis that implies that the price elasticity of demand varies with p and Q.
pt = a − bQt (2)
where a and b are parameters representing respectively market size and price sensitivity to change in
quantities. Q is the sum of OPEC and non-OPEC supply (QO and QN O respectively). Non-OPEC
operates at a unit production cost equal to cN O = αc with α measuring the inefficiency relative to
OPEC, which we assume to be strictly greater than 1.
Let’s assume that OPEC sets a price higher than the marginal cost of the fringe firms (p ≥ αc),
so that all the firms make profits. From the maximization of OPEC’s profit, subject to the residual
demand constraint, we know that QO can be expressed as a function of QN O :
a − c QN O
QO = − (3)
2b 2
and plugging back QO in (2) also the price becomes a sole function of QN O and parameters:4
a+c QN O
p= −b (4)
2 2
For a given demand, equation (3) shows that OPEC will restrain its supply following an increase in
non-OPEC production, counteracting the initial shock in the attempt to stabilize the price. However
it will accommodate only half of the variation ( ∆Q2N O ). As a result, total supply will increase and the
price will fall but by less than in the case in which OPEC had not adjusted (by 2b ∆QN O in equation
(4)).
Because non-OPEC producers are price-takers and cannot act strategically, they will produce as
long as the oil market price remains above their production costs: p ≥ αc. In this case QN O can be
derived by imposing p = αc in 4. The equilibrium supply of non-OPEC will be:
a + (1 − 2α)c
QN O = (5)
b
c(α−1)
OPEC production is QO = b , a positive function of the profit margin. Notice however that,
under a linear demand assumption, while non-OPEC increases its production in response to a positive
demand innovation (i.e. a increases), OPEC will only do it if α is not constant. Total supply on the
market is given by:
4
Notice that QN O is constrained by the capacity of the fringe firms, and therefore QN O ≤ K, where K stands for the
fringe firms capacity.
ECB Working Paper Series No 2368 / January 2020 9a − αc
QT = (6)
b
Substituting equations 5, 3 and 4 in 1, it is immediate to show that, without structural changes,
the discounted value of OPEC future profits can be expressed as:
1 (α − 1)2 c2
Π= (7)
1−β b
As T is finite, the game repeats over time unchanged but exogenous factors may intervene to alter
market conditions, for instance an improvement in the production efficiency of non-OPEC producers.
Technology progress can decrease α and the dominant player will revise its production accordingly.
OPEC’s profits will be negatively affected via two channels: 1) the profit margin is compressed and
2) the residual demand is reduced. However, does this provide an incentive to OPEC to revise its
production strategy?
2.1 When are strategic deviations from the equilibrium preferable?
So far, we have defined the equilibrium of the oil market under a dominant firm-competitive fringe
model based on the assumption that OPEC will set a price higher than the marginal cost of the fringe
firms, so all the firms can compete in this market. However, is it always optimal for OPEC to act like
a monopolist on the residual demand? Or would it be better to act strategically? In this subsection,
we analyze two new strategies that OPEC can follow and determine under which conditions OPEC
has incentives to deviate from the “equilibrium” of acting as a monopolist on the residual demand.
In the spirit of Behar and Ritz (2017), we imagine two possible strategies that can be enforced
by the dominant player: in the former OPEC can decide to regain market share by pushing some
fringe firms out of the market, in the latter OPEC decides to target the oil market price to stabilize
it around a desired value.5
We therefore assume these two strategies to be possible objectives of OPEC and investigate under
which conditions OPEC has incentives to deviate from the equilibrium. As T is finite, the game
repeats over time unchanged but following any change in market conditions, OPEC will reconsider
its strategy and evaluate whether deviating from the equilibrium is preferable.
Specifically, defining ΠP T the profits obtained under Price Targeting and Πo the status quo profits,
OPEC will follow a Price Targeting Strategy when ΠP T > Πo . In this case OPEC will cut production
by a ∆QO to support oil prices, given new market conditions. This means that as non-OPEC pro-
5
This can be driven by idiosyncratic reasons, such as maintaining their internal fiscal balance, which are not explicitly
modeled in our framework.
ECB Working Paper Series No 2368 / January 2020 10duction expands for exogenous reasons, OPEC will reply by cutting production, and hence the two
productions will move in an opposite direction under a Price Targeting Strategy in the same period .
This strategy is preferable when6 :
∆QO
pP T − p0 = ∆pP T > (p0 − c)
QO − ∆QO
(8)
∆QO
∆pP T > (α − 1)c
QO − ∆QO
where p0 and QO are the equilibrium values of price and OPEC production when OPEC acts as a
monopolist on the residual demand. Similarly, a deviation from the status quo, consisting in increasing
production above the equilibrium level by ∆QO , is preferred by OPEC in order to regain market shares
when ΠM ST > Πo . Differently from the previous strategy, in this situation both oil productions for
OPEC and non-OPEC move in the same direction at the same time; a condition verified when:
∆QO
pM ST − p0 = ∆pM ST > (p0 − c)
QO + ∆QO
(9)
∆QO
∆pM ST > (α − 1)c
QO + ∆QO
Both conditions state that profits gains from deviation must be larger than profits losses. The
conditions under which equation 8 and 9 are satisfied depend fundamentally on the assumptions
made about demand schedule and the functional form of non-OPEC production costs.
Focusing on the functional form of non-OPEC production costs, when α is constant, Market Share
Targeting is always the preferred strategy. This is intuitive because if the marginal production cost of
non-OPEC does not vary with QN O , every effort made by OPEC to raise the price will only result in
non-OPEC expanding its share as the equilibrium price remains determined by non-OPEC production
costs. Under such conditions, Price Targeting is clearly sub-optimal but Market Share Targeting is
instead preferred to the situation of OPEC playing monopolistic on the residual demand. By the same
token if OPEC increases, even marginally, its production, the price will decrease below αc, resulting
in non-OPEC producers leaving the market and OPEC earning the monopoly profits shaved by a
tiny value; therefore Market Share Targeting results the winning strategy. Less trivial is the situation
when α increases with total non-OPEC production.7
6
See Appendix 6.1.1 for derivation details.
7
The case of unit costs decreasing in total production, that is increasing return to scale is not considered as it will
always lead, in the absence of maximum production capacity, to the entire market concentrated in the hands of a single
producer.
ECB Working Paper Series No 2368 / January 2020 11In the case of a linear demand schedule, imposing equation 2, it is immediate to obtain that OPEC
will adopt a Price Targeting Strategy when:
∆QPNTO (α0 − 1)c 1
P T
1+
∆QO b QO + ∆QM
O
ST
Ultimately whether one of the two strategies is preferred to the status quo and which of the two
strategies is pursued depends on the reaction of non-OPEC production to OPEC moves, determined
by the functional form of the fringe firms costs.8
When non-OPEC production costs are increasing in QN O , if OPEC attempts to raise the price
above the equilibrium by cutting its production (Price Targeting strategy), the possibility of non-
OPEC expanding its own production by the same amount will be limited by the increase in marginal
production costs. It must therefore exist a range of α for which Price Targeting is feasible and optimal.
Similarly in order to regain market shares, OPEC will expand production pushing down the oil
market price, non-OPEC then cuts back on its production but less than OPEC’s initial expansion,
as unit production costs decrease. In conclusion, when α increases with total non-OPEC production,
it is not obvious any longer that Market Share Targeting is preferred to the status quo and to Price
Targeting.
Although it is not necessary for the sign restrictions imposed in the empirical model, we can
determine the range of parameters under which it is optimal for OPEC to deviate from the equilibrium.
In particular, it can be proved that under the linear demand schedule hypothesis, assuming that non-
OPEC production costs also increase with production linearly (α = δQN O ), we have that:
∆QN O b
=− (10)
∆QO δc + b
The ratio of non-OPEC to OPEC production decreases with demand sensitivity to prices ( 1b ) and
relative to inefficiency of non-OPEC. More importantly, exogenous shocks to δ can induce OPEC to
start or cease a strategy. Finally, replacing equation 10 in 8, we obtain the optimal OPEC deviation
8
It is immediate to verify that as long as OPEC production is positive, it never happens that both conditions 2.1
and 2.1 are satisfied at the same time.
ECB Working Paper Series No 2368 / January 2020 12from status quo under Price Targeting:9
∆QO −b
< (11)
QO δc
and the optimal OPEC deviation from the status quo under Market Share Targeting is found by
replacing 10 into 9:10
∆QO b
> (12)
QO δc
−b ∆QO b
Therefore for δc < QO < δc , the status quo (acting as a monopolist on the residual demand)
is preferred by OPEC. Small perturbations in quantities will not be sufficient to deviate from the
optimal equilibrium, but relevant changes in production can trigger a switch in the optimal strategy.
Moreover whatever strategy is followed, it has to become more aggressive as δ decreases, which is
when non-OPEC producers become relatively more efficient, or when oil prices are more sensitive to
a change in quantities.
Last, like in other theoretical frameworks, following positive demand shocks total supply increases.
In particular, maintaining the assumption of increasing non-OPEC marginal production costs, demand
shocks originate shifts in the same direction of both OPEC and non-OPEC productions, regardless of
whether the pursued strategy is the status quo, Price or Market Share targeting. Moreover, demand
shocks consisting in ∆a do not generate switches of OPEC strategy since they do not enter the two
conditions 12 and 11.
2.2 Price Targeting vs Market Share targeting
We have identified a range of parameters under which deviating from the status quo of playing
monopolistic on the residual demand curve seems to be optimal. However, it is also relevant to know
when OPEC prefers to follow a Market Share Strategy or a Price-Targeting Strategy.
OPEC decides its optimal strategy based on its inter-temporal profit maximization problem given
the information set available at each time t. OPEC will follow a Price Targeting Strategy whenever:
9
See appendix 6.1 for derivation details.
10
see appendix 6.1 for derivation details.
ECB Working Paper Series No 2368 / January 2020 13ΠP T > ΠM ST
δbc∆QO δbc∆QO
(p0 + − c)[QO − ∆QO ] > (p0 − − c)[QO + ∆QO ]
b + δc b + δc
b + δc
QO > (p0 − c)
δbc
QO a + c b + δc
> (δ − )
QN O b + δbc δbc
Price Targeting is preferred to Market Share Targeting as long as OPEC production remains
above a precise threshold (δ), and therefore a certain market share seems to be guaranteed by OPEC.
However, whenever OPEC’s production is largely and negatively affected, for instance by a fierce
competition from the fringe firms, OPEC might find optimal to switch from one strategy to another
in order to defend its production, even at the cost of accepting a drop in oil prices.
This simple framework provides a better understanding of strategic interactions in the oil market in
order to assess the impact of OPEC’s strategies on oil price dynamics. It also provides underpinnings
to bridge theoretical considerations with the empirical identification of the oil market. It highlights
the three possible strategies that OPEC can pursue and provides precise conditions under which one
strategy prevails on the other: 1) act as a monopolist on the residual demand, 2) target oil prices
to keep them around a desired target, by cutting down its own production in some cases, 3) regain
market shares if competitors are expanding.
More importantly, this simple theoretical model shows that following an exogenous shock to non-
OPEC production, OPEC can decide to switch from one to another strategy. When OPEC finds
optimal to pursue a Price Targeting Strategy, it will cut on its original production following a non-
OPEC positive supply shock, therefore the two productions changes will have opposite signs. When
Market Share Targeting is found to be optimal, OPEC will increase beyond its initial status quo level
its production. Notice that the framework encompasses the possibility of uncertainty around which
strategy is optimal to play as non-OPEC efficiency can change exogenously. It also exists a range of
market conditions (demand and competitor efficiency) that accommodates a period of inertia during
which no active strategy is pursued. This can explain OPEC’s behaviour during the initial stages of
the shale revolution.
Based on the policy reaction function of OPEC to non-OPEC supply shocks depending on the
strategy pursued, in section 3 we present an empirical model that aims at formalizing the theoretical
considerations presented in this section. Our ultimate goal is to better understand oil price dynamics
ECB Working Paper Series No 2368 / January 2020 14in recent decades, and specifically to assess in which episodes OPEC was acting strategically.
3 Empirical strategy
3.1 Data
We jointly model a vector of five time series Yt = [QOpec , QN on−Opec , REA, Poil , Inv], where QOpec
and QN on−Opec are, respectively, oil production from OPEC and Non-OPEC, REA is a measure of
global real economic activity, Poil is the real price of oil, and Inv are oil inventories. All time series
are transformed to achieve stationarity.
OPEC and non-OPEC production are obtained from the Monthly Energy Review published by
the US Energy Information Administration (EIA), and they are expressed in monthly percentage
changes. In order to measure global economic activity we use a monthly series of world GDP obtained
by interpolating quarterly world GDP growth.11 The measure of real oil prices is derived from the
average Brent crude prices, obtained from the International Financial Statistics (IFS), and deflated
by the US consumer price index. Brent prices enter the model in log-levels. Finally, owing to the lack
of available data and following Kilian and Murphy (2014), world crude inventories are proxied by
monthly changes in total US crude oil inventories, rescaled by the ratio of OECD to US petroleum
stocks, which are taken from the EIA.12
3.2 A SVAR model
We model the vector of variables Yt in a Structural Vector Auto Regression (SVAR). We follow
the previous literature including 24 lags (Kilian and Murphy, 2014) and employ monthly data. The
structural form representation of the model is as follows:
A0 Yt = B(L)Yt−1 + t (13)
Yt is a vector of five endogenous variables, including (1) the monthly percentage change in OPEC
crude oil production, (2) the monthly percentage change in non-OPEC crude oil production, (3) the
monthly growth rate of the interpolated global GDP, (4) the log-real price of oil, (5) the monthly
11
Results do not change fundamentally when using Kilian’s measure for global economic activity, which is based on
dry cargo single voyage ocean freight rates, see Kilian (2009). Notice, however, that the performance of this indicator, as
pointed out by ?, has deteriorated in recent years. During the slowdown in economic activity in early 2016, for instance,
the negative spike in Kilian’s indicator would have predicted a more severe crisis than the Global Financial Crisis, casting
doubts about its suitability as a leading indicator.
12
As OECD petroleum series is only available from 1987, the series is backcasted from 1973 using the growth rate of
US petroleum inventories, closely correlated to overall OECD changes especially in the early years of the sample (see
Kilian and Murphy (2014)).
ECB Working Paper Series No 2368 / January 2020 15changes in global oil inventories. The matrix A0 shapes the contemporaneous interaction among the
endogenous variables, while B(L) is a matrix polynomial and t is a vector of structural disturbances.13
The reduced form representation of the model is the following:
Yt = C(L)Yt−1 + ut (14)
where ut = A−1 −1
0 B(L) and C(L) = A0 B(L). The reduced form residuals have a full rank covariance
matrix, Σ = A−1 −10
0 A0 = DD0 . Identification of the structural shocks is achieved via sign restrictions on
the columns of D following the standard method popularized by Arias, Rubio-Ramirez, and Waggoner
(2018).
In order to identify structural shocks and to study their effects on the price of oil we need to place
restrictions on the structural impact matrix D. A number of papers have shown that fluctuations of
the price of oil in the global oil market can be mostly attributed to three fundamental shocks, namely
oil supply, oil demand and precautionary demand shocks, see for instance Kilian and Murphy (2014)
and Baumeister and Hamilton (2015). We deviate from these analyses by allowing for a richer charac-
terization of the behaviour of oil suppliers, given the focus of our analysis on the strategic interaction
of oil producers. The existent empirical literature has typically bundled together the behaviour of
OPEC and non-OPEC producers and considered a single aggregate global supply shock. To see how
such an aggregate shock is identified in a SVAR model of the type hereby employed, let us suppose
that such oil supply shock is identified as the first shock in the system. This would be obtained by
imposing restrictions on the signs of the first column of D, let us call it d1 . In particular, an exogenous
tightening of oil supply would lead to a fall in oil production, an increase in prices and a contraction
of global economic activity. Therefore, the first three elements of d1 , corresponding to the response of
(1) OPEC production, (2) non-OPEC production and (3) real economic activity are supposed to be
negative, while the fourth one, corresponding to the response of the real price of oil, is supposed to
be positive. However, the theoretical model derived in section 2 suggests that OPEC and non-OPEC
producers interact strategically. Such strategic interaction, in turn, implies that OPEC producers
would likely adjust their response to non-OPEC producers in a time-varying fashion, depending both
on market conditions and on domestic economic considerations.14
One would be tempted to address this issue by making the coefficients in d1 time-varying, but this
by itself would not solve the problem. What one needs, in fact, is to allow for the second element of d1
(corresponding to the behaviour of OPEC suppliers) to switch sign over time so as to give OPEC the
13
An intercept and seasonal dummies are also included in the model.
14
For instance, domestic fiscal balance considerations could shape the decision by OPEC members to react one way
or another to a supply shock originating in non-OPEC countries.
ECB Working Paper Series No 2368 / January 2020 16possibility to follow non-OPEC production (so as to target market shares) or to partially/completely
offset it (so as to target prices). In order to strike a sensible balance between flexibility and simplicity,
our solution consists of identifying an additional structural shock, which imposes opposite signs on the
response of OPEC and non-OPEC production. In other words, we identify two independent structural
shocks— a “Market Share Targeting” shock and a “Price Targeting” supply shock, related to the
strategic interactions of OPEC and non-OPEC supply decisions. The former is the typical global oil
supply shock identified as in Kilian and Murphy (2014) and Baumeister and Hamilton (2015), where
OPEC and non-OPEC production moves in the same direction. The latter is identified by allowing
OPEC to move its production in the opposite direction to that of non-OPEC, in order to partially
stabilize prices. Besides these shocks, we also identify a global demand and a precautionary demand
for oil shock, as in Kilian and Murphy (2014). Table 1 reports a summary of the sign restrictions
imposed on the first four columns of D in order to recover the structural shocks.
Table 1: Identification Restrictions
Variables Market share Price Aggregate Speculative
targeting supply targeting supply demand demand
OPEC production - - + +
Non-OPEC production - + + +
Real activity - + -
Real price of oil + + +
Inventories +
Notes: As commonly done in the literature, all responses have been normalized such as structural shocks have a pos-
itive impact on oil prices. Moreover, a fifth shock, not represented in the table, captures the linear combination of all
unidentified shocks accounting for the unexplained part of variables’ dynamics.
The key identifying assumptions are sign restrictions imposed on the responses at time 0 of the five
variables to the structural shocks, as well as dynamic restrictions on some of the variables. The novelty
of this set-up is that it exploits specific conditions derived within a simple theoretical framework to
identify the two types of supply shocks. If OPEC seeks to maintain its market share (MST strategy),
it reacts to expansions (declines) in non-OPEC production by also increasing (decreasing) its sup-
ply. In this case, both productions move in the same direction at the same time, and therefore the
contemporaneous responses have the same sign, leading to an amplification of the decrease (increase)
in oil prices.15 On the contrary the “Price Targeting supply shock”, considers opposite movements
in OPEC and non-OPEC production. If OPEC aims at stabilizing oil prices around a target (for
given global demand conditions), it must drain the eventual excess supply by reducing its own supply
to support prices. In this case, no sign restrictions are imposed on price and global activity since
there are two forces operating in opposite directions and the overall effect on prices and activity is
15
To select only supply shocks with some persistent effect, we further impose that the oil price reaction persists for at
least 12 months.
ECB Working Paper Series No 2368 / January 2020 17ambiguous, depending on the net impact on production (see Table 1). Notice that, at any point in
time, the model will assign some of the changes in the price of oil to both the Market share and to
the Price targeting strategies. This simply implies that following an exogenous increase in production
from non-OPEC producers, the overall net reaction of OPEC producers will be determined by the
sum of the two shocks. Despite being a crude shortcut for allowing OPEC to react differently at each
point in time, this identification strategy allows us to capture the main qualitative implications of the
theoretical model. Furthermore it allows for an endogenous optimal selection of the strategy pursued
within a single econometric workhorse. This compares with other works (see Golombek, Irarrazabal,
and Ma (2018)) where the dominant OPEC and the competitive OPEC paradigms lead to alterna-
tive estimation methodologies (a non linear instrumental variable and a 3 stage least square method
respectively) and econometric models carried out on different time frames.
Similarly to previous works, positive aggregate demand shocks in the oil market (i.e. a shift in the
demand curve) are identified by simultaneous increases in oil prices and production in both OPEC and
non-OPEC countries. A positive speculative demand shock gives origin to a situation when market
players purchase oil inventories ahead of expected future shortages in the oil market and as a result
the current level of inventories and the real price of oil rise. At the same time, higher oil price boosts
oil production in OPEC and non-OPEC countries while aggregate economic activity decreases.16
4 Results
We name 3-shocks and 4-shocks models, respectively, a standard model which identifies, demand,
supply and precautionary demand shocks and our model which distinguishes two types of supply
shocks in addition to demand and precautionary demand shocks. In order to highlight the main
contribution of the novel framework accommodating for producers strategic interactions, we rely first
on the comparison of the forecast error variance decomposition of oil prices between the 3-s and the
4-s model.17 We then move to compute oil supply and oil demand elasticities, and finally comment
on the historical decomposition.
4.1 Forecast Error Variance Decomposition
We start by comparing how the 3-s and the 4-s models decompose the oil prices’ forecast error variance,
see Figure 2. The plot is organized in four panels. The top-left panel reports the share of forecast
16
Notice that we do not impose any particular elasticities bounds on oil supply and demand. The main reason is that
there is no consensus on what the correct values of elasticities that should be imposed are. A recent paper by Caldara,
Cavallo, and Iacoviello (2019), for instance, finds that the short-run oil supply elasticity might be as high as 0.077, three
times higher than the supply bound (0.0258) imposed in Kilian and Murphy (2012).
17
Impulse response functions are shown to be well behaved in the appendix.
ECB Working Paper Series No 2368 / January 2020 18error variance that is explained by the typical supply shock in the 3-s model and by the Market
Share targeting shock in the 4-s model. The top-right and bottom-left panels report the shares of,
respectively, the demand and the speculative demand shocks for both models. Finally, the bottom-
right panel compares the share of variance that in the 3-s model is attributed to the residual shock,
to the share that in our setup is captured by the Price Targeting shock.
We draw attention to three results. First, the supply shock in the 3-s model and the Market Share
Targeting shock in the 4-s model explain by large the same share of oil price fluctuations (around 40
percent at short horizons and about half as much at longer horizons). This, by itself, suggests that our
newly identified shock is not subtracting explanatory power from the traditional supply shock. Second,
in our model global demand is slightly less relevant than in the 3-s model, especially at longer horizons,
while the relevance of shocks that originate from precautionary demand for inventories is somewhat
lower. Last and most importantly, the Price Targeting shock explains almost an additional 10% of the
FEVD, which in the 3-s is left non-identified and therefore attributed to the residual shock. Indeed
the part of the variance of the forecast errors explained by the residual.18 is substantially reduced in
the 4-shocks framework (to about half of what is in the 3-s model), suggesting that the added model
flexibility captures indeed some relevant heterogeneity in the behaviour of OPEC supply over the
considered sample.
4.2 Elasticities
Based on the structural shocks identified in our specification, we can estimate implied short-run price
elasticities for oil demand and oil supply. Furthermore, having split oil production in OPEC and
non-OPEC countries, we allow for heterogeneous oil supply elasticities in these two economic areas,
by looking at how their production react in the face of a structural demand shock.19
Table 2 summarizes the median short-run price elasticities derived in our model. They turn out
to be consistent with those recently estimated of the recent literature. Indeed, the median of the
aggregate oil supply elasticity is 0.10, qualitatively close to the elasticity obtained in Caldara, Cavallo,
and Iacoviello (2019) and in Baumeister and Hamilton (2019). More specifically, Baumeister and
Hamilton (2019) derive a short-run oil supply elasticity of 0.15 using Bayesian inference with relaxed
prior information on the size of elasticities, while Caldara, Cavallo, and Iacoviello (2019) estimate a
0.077 short-run supply elasticity using country-level instrumental variable regressions.
18
Not shown in the graph.
19
Given that we model two different producers that can adopt different strategies we need to make some assumptions
when estimating elasticities. The global oil price supply elasticity is obtained by considering the overall percentage
increase in global oil production determined by OPEC and non-OPEC (conditional on a demand shock) and dividing
the resulting percentage change by the percentage increase in global oil prices. The price elasticity of demand is obtained
conditioning on the Market Share targeting shock.
ECB Working Paper Series No 2368 / January 2020 19Figure 2: Forecast Error Variance Decomposition of oil prices: comparing the 3-s and 4-s models Notes: The 4-shock model refers to the new model that distinguishes between two types of supply shocks, while the 3-shock model focuses on a standard model which identifies, demand, supply and precautionary demand shocks. ECB Working Paper Series No 2368 / January 2020 20
Turning to the difference between OPEC and non-OPEC supply elasticity, unsurprisingly we find
that the elasticity of OPEC supply is higher than that of non-OPEC supply. A similar result, albeit
with very different techniques, is obtained by Caldara, Cavallo, and Iacoviello (2019), who estimated
an elasticity of 0.22 for Saudi Arabia, 0.19 for the rest of OPEC members and non significantly
different from zero for non-OPEC countries. While our results are qualitatively similar for OPEC
countries with a supply elasticity of 0.2, we also derive a small positive supply elasticity for non-
OPEC countries, of around 0.06. OPEC adjust production in response to price changes more easily
due to available spare capacity, but also to optimally decided production policies.

                     Table 2: Median price elasticities of crude oil supply and demand
                Elasticities                            Our model KM14 CCI19 BH19
                Price elasticity of crude oil demand       -0.28       -0.08   -0.07 -0.35
                Price elasticity of crude oil supply
                - Global                                   0.10        0.03    0.08   0.15
                - OPEC                                     0.20                0.19
                - non-OPEC                                 0.06                -0.01

Notes: Estimates Km14 refers to Kilian and Murphy (2014), CCI19 refers to Caldara, Cavallo, and Iacoviello (2019) and
BH19 refers to Baumeister and Hamilton (2019). Notice that in the case of KM14, elasticities refer to the upper bound
for supply and to lower bound for demand.

       The short-run demand elasticity (-0.28) is also closer to the estimates retrieved in the recent
literature. Indeed, there is an extensive literature on oil demand elasticities, with heterogeneous results
as elasticities range from -0.81 for the long-run price elasticity of gasoline demand (Hausman and
Newey (1995) to -0.07 of short-run oil elasticity of Caldara, Cavallo, and Iacoviello (2019).20 However,
the recent literature challenges previous estimates and points to lower elasticities. Caldara, Cavallo,
and Iacoviello (2019) find a demand elasticity around -0.07 using data from 1985 to 2007. Gelman,
Gorodnichenko, Kariv, Koustas, Shapiro, Silverman, and Tadelis (2016) retrieve a short-run elasticity
for gasoline of -0.22. Therefore, a short-run elasticity around -0.285 is reasonable for an average
estimation using a larger sample period, from 1973 to 2017, as there is a persistent decline in elasticities
over time.

       Since we model OPEC and non-OPEC supply separately, we also look at possible breaks over time
in the oil supply elasticity of these two producers. In particular, we obtain a time-varying version of
our VAR model using the non-parametric estimator by Giraitis, Kapetanios, and Yates (2018) and
identify at each point in time structural shocks. This allows us to have an estimate of time-varying
supply and demand elasticities. The elasticity of OPEC and non-OPEC supply are obtained as price
  20
    Of course, one needs to differentiate between crude oil and gasoline elasticities and between short and long run
elasticities. While it is reasonable to argue that short-run elasticity is smaller than long-run elasticities, Hamilton (2009)
makes the case that crude oil demand elasticity should be around half the gasoline demand elasticity since crude oil
accounts for half the retail cost of gasoline.

ECB Working Paper Series No 2368 / January 2020                                                                            21
percentage changes following demand shocks, that is the response of production to oil price when an
exogenous expansion or contraction of world demand occurs (e.g. shifts of the demand curve along the
supply curve). Therefore, as explained in section 2, and irrespective of the strategy OPEC is pursuing,
both OPEC and non-OPEC, to a different degree, will adjust their supply in the same direction to
accommodate demand at least partially.21 The evolution of supply elasticities is shown in Figure 3 .
As two different demand shocks have been identified in our model, the global aggregate demand shock
and the speculative demand shock, we can derive different OPEC and non-OPEC supply elasticities
conditional on each of these shocks. While the dynamics of supply elasticities are quite similar, oil
supply seems to be slightly more elastic in the case of a speculative shock, pointing to a different
reaction depending on the source of the shock.
Figure 3: Time varying supply elasticity
In addition, these time-varying supply elasticities confirm that OPEC elasticities are higher than
21
In section 2 we clarify that it is for a given demand level that, depending on the strategy pursued, OPEC may
restrain its supply when non-OPEC expands its own, while the elasticity of OPEC and non-OPEC supply are computed
over different demand schedules
ECB Working Paper Series No 2368 / January 2020 22non-OPEC elasticities for both demand shocks. Nevertheless, while OPEC supply elasticity seems to
decline, for non-OPEC countries it slightly increases over time. OPEC supply elasticities are relatively
more elastic in the seventies and eighties with median elasticities between 0.3 and 0.4 when computed
as shifts along the aggregate demand and around 0.5 when computed from shifts along the speculative
demand, while currently they are around 0.15 and 0.2, respectively. Focusing on non-OPEC time-
varying supply elasticities, there is no evidence so far of a recent structural break in elasticities due
to the surge in shale oil production in the US. Elasticities remained rather constant over the past two
decades despite the fact that shale producers are able to stop and restart production more easily than
conventional non-OPEC producers, see also Foroni and Stracca (2019). Two factors can be behind
this result: the phenomenon is too recent for a structural break to be properly identified in a time
series analysis which has to be performed including many lags (up to 24) and the share of shale oil in
total production is still only around 6.5% of world oil and 11% of non-OPEC production.
Figure 4: Time varying overall demand elasticity
Estimates of oil demand time-varying elasticities, reported in Figure 4, indicate that this has
declined quite markedly over time. In the seventies, oil demand median estimate was close to -0.2
until 1980, period in which they started their downward trend, in absolute value, until reaching
a current level close to -0.1. The lower elasticity may result from economies having become more
resilient to oil price shocks over time, chiefly owing to lower energy intensity. Its decline by a third
since the early nineties is a consequence of the improved energy efficiency and the declining share of
the energy intensive manufacture in global production.22
22
A similar pattern is also shown in Baumeister and Peersman (2013). However, our estimates display a smaller
ECB Working Paper Series No 2368 / January 2020 234.3 Historical Decomposition
The historical decomposition of oil prices obtained from the 4-shocks model confirms some of the
major findings of the previous literature but it also contains relevant innovations. To illustrate this
point, in Figure 5 we show the contribution of each shock to fluctuations in the price of oil between
2000 and 2017 in the 3-s and in the 4-s models.
Supply shocks in the two models behave similarly. In Figure 5, top-left panel, the contribution of
the Market Share Targeting shock of the 4-shocks model and that of the supply shock in the 3-s
model overlap to a great extent over the entire period. It is worth remarking that the 4-shocks model
imposes productions of OPEC and non-OPEC to comove, that is both must change at the same time
in the same direction, for a Market Share Target shock to occur, while the 3-s only requires a positive
innovation in the sum of the two. Therefore, despite the 4-s definition of Market Share Target is more
restrictive, we find that its contribution to price dynamics is comparable to that of the supply shock
identified in the 3-s model.
Demand shocks continue to play a relevant role; in particular, they remain the most important
factor explaining the pre-crisis spike. Nonetheless their contribution in our 4-s model is smaller both
during the post-crisis fall as well as during the recovery phase of oil quotations in the aftermath of
the global crisis, when also OPEC production strategy supported prices.
The importance of speculative demand shocks in explaining oil price evolution remains marginal
(Kilian and Murphy (2014), Peersman, Baumeister, et al. (2009)).23
The Price Targeting strategy turns out to explain a relevant fraction of price variation in a few
specific historical episodes. This can be seen in the bottom-right panel of Figure 5, which plots side by
side the contribution of the unidentified shocks in the 3-s model (blue dashed line) and of the Price
Targeting shock in our 4-s model (red solid line). It is clear that part of the unidentified shock the
3-s model is picked up in our richer set-up by the Price Targeting behaviour of OPEC countries. We
take this as the validity of the 4-shocks model comes from the much smaller contribution to oil price
dynamics of unidentified shocks. In particular, the Price Targeting strategy seems to have played a
significant role in explaining oil price changes in the five years before the crisis, picking up part of the
run-up in the price of oil that in the simpler 3-s model is attributed partly to demand, and partly left
unexplained.
In a nutshell, this new model seems to provide a better understanding of key episodes with large
volatility and their magnitudes are considerably smaller in the seventies and early eighties.
23
We noticed that this result seems to be rather sensitive to the indicator of global activity adopted. In particular,
using the freight bulk dry rates used in Kilian (2009), seems to inflate the role of precautionary demand for inventories
shocks
ECB Working Paper Series No 2368 / January 2020 24You can also read


