Market and Trade Profile: Brazil - Brazil - Visitbritain.org
←
→
Page content transcription
If your browser does not render page correctly, please read the page content below
Market and Trade Profile Brazil

Market and
Trade Profile: Brazil

Brazil
Market and Trade Profile Brazil

Overview

•   Chapter 1: Inbound market statistics provides insights on key statistics about
    Brazilian travellers and who they are. It takes a look at Britain and its competitive
    set, as well as activities of Brazilian visitors in the UK.

•   Chapter 2: Understanding the market takes a close look at Brazilian consumer
    trends, booking patterns, planning and the travel behaviour of this source
    market. Perceptions of Britain held by Brazilians are also highlighted.

•   Chapter 3: Access and travel trade outlines how Brazilians travel to
    the UK, how to best cater for their travel needs and wants as well as offering
    insights into how to work with the Brazilian travel trade. The chapter
    also outlines how suppliers can work with VisitBritain in the Brazil market.

                                                                                                       2
Market and Trade Profile Brazil

Contents
Chapter 1:
Inbound market statistics
   1.1 Key statistics               6
   1.2 Visitor demographics        17
   1.3 Britain & competitors       21
   1.4 Inbound activities          23

Chapter 2:
Understanding the market
   2.1 Structural drivers          31
   2.2 Consumer trends             35
   2.3 Booking and planning        37
   2.4 Reaching the consumer       40
   2.5 Perceptions of Britain      44

Chapter 3:
Access and travel trade
   3.1 Access                      51
   3.2 Travel Trade                54
   3.3 Caring for the consumer     59
   3.4 Working with VisitBritain   62
   3.5 Useful research resources   63

                                                                          3
Market and Trade Profile Brazil

Chapter 1:
Inbound market
statistics

                                                   4
Market and Trade Profile Brazil
Chapter 1: Inbound market statistics
Chapter summary
• Brazil’s outbound travel market is anticipated to increase.
According to Oxford Economics, the market is forecast to
account for almost 10.6 million overnight trips abroad by
2020. This is an increase of 24% compared to 2016. Visits from
• France (44%), Italy (38%), Germany (37%), Portugal (36%) Brazil to the UK
and Spain (35%) were the holiday destinations that Brazilian were up 49% in
holidaymakers to Britain were most likely to consider as the first half of
alternative destinations.
2017*
• Brazilians rank in 23rd place globally for international tourism
expenditure with US$14.5bn spent in 2016.
• Brazil is the 36th largest inbound source market for the UK
and the 29th most valuable for visitor spend in 2016.
• Brazil was in deep recession during 2016, causing a
decrease in arrivals and spend. Both have rebounded during
the first half of 2017. There were 136,000 visits to the UK in
this period, up 49% on the first half of 2016 (5% below the
first six months of 2015*, a record year for arrivals from
Brazil) and spend was up 91% at £141 million.
Source: International Passenger Survey by ONS, Oxford Economics, UNWTO, VisitBritain/IPSOS 2016
* provisional data
5Market and Trade Profile Brazil
Chapter 1.1: Key statistics
Key insights
• Brazil’s outbound travel market is in recovery. After a drop in 2016
owing to economic recession, the number of overnight visits from
Brazil to the UK is forecasted to increase significantly during the 89%
next decade. of departing Brazilian
holiday visitors felt “very”
• Brazilians have the tendency to visit in even numbers throughout or “extremely” welcome in
the year. In 2016, arrivals were level during all quarters. Great Britain in 2016
• Holiday visits continue to lead the volume of arrivals from the
Brazilian market; 58% of visits were made for holiday purposes
in 2016.
• Brazilian visitors spent an average of 11 nights per visit in the UK
during 2016, longer than the global average.
• London is the leading destination for Brazilian visitors; 70% of
Brazilian nights were spent in London between 2014-2016.
• 94% of departing Brazilian travellers in 2016 would be “very” or
“extremely likely” to recommend Great Britain for a holiday or
short-break.
Source: Oxford Economics, International Passenger Survey by ONS, CAA 2016 (asked to leisure visitors)
6Market and Trade Profile Brazil
1.1 Key statistics: global context and 10 year trend
Global context Inbound travel to the UK overview
Measure 2016 Measure Visits Nights Spend
(000s) (000s) (£m)
10 year trend
International tourism
14.5 2007 131 2,483 139
expenditure (US$bn)
2008 179 2,490 148
Global rank for 2009 151 2,249 151
international tourism 23
expenditure 2010 177 1,764 160
2011 276 2,652 302
Number of outbound 2012 260 2,401 227
8.6
overnight visits (m)
2013 258 2,283 277
Most visited destination for 2014 293 2,878 253
USA
overnight visits 2015 324 2,786 256
2016 187* 2,006* 196*
Share of
0.5%* 0.7%* 0.9%*
UK total in 2016
Source: International Passenger Survey by ONS, UNWTO (as of November 2017), Oxford Economics
* After a weak 2016, both visit and spend levels from Brazil to the UK have rebounded in the first half of 2017. There were 136,000 visits in the first half of 2017 – 49% more that in the first half of 2016 and just 5% below
the first six months of 2015 (provisional data).
7Market and Trade Profile Brazil
1.1 Key statistics – volume and value
Inbound volume and value Nights per visit, spend
Measure 2016 Change Rank out of Averages by Nights Spend Spend
vs. 2015 UK top journey purpose per per per
markets in 2016 visit night visit
Visits (000s) 187 -42% 36 Holiday 6 £121 £690
Nights (000s) 2,006 -28% 34 Business* 7 £208 £1,473
Visiting friends/
Spend (£m) 196 -23% 29 16 £41 £674
relatives*
After a weak 2016, both visit and spend levels from All visits 11 £98 £1,052
Brazil to the UK have rebounded in the first half of
2017. There were 136,000 visits in the first half of
2017 – 49% more that in the first half of 2016 and
just 5% below the first six months of 2015**.
Source: International Passenger Survey by ONS
* small base
** provisional data
8Market and Trade Profile Brazil
1.1 Key statistics: journey purpose
Journey purpose 2016 Journey purpose trend (visits 000s)
60% 58%
250
Share of visits
50% 200
37%
40%
31% 150
30% 24%
109
20% 100
20% 12%
50 38
10% 5% 4% 6% 22
1% 9
0% 0 8
Holiday Business VFR Study Misc.
Holiday Business VFR Study Misc.
Brazil All markets
• In 2016, 58% of all visits to the UK from Brazil were • Despite the sharp decline in 2016 caused by Brazil’s
made for holiday purposes. 20% were to visit friends economic recession, holiday visits continue to lead in
and/or relatives. terms of visit volume from the Brazilian market.
• 36% of holiday visits from Brazil to the UK • Brazil’s economy in Q1 2017 recorded growth, ending
(excl. UK Nationals) in 2016 were made by repeat its deepest recorded recession ever.
visitors. On average, a Brazilian holidaymaker has • The country’s outbound travel market is also in a state
come between 1 and 2 times to the UK in the past 10 of recovery after 2016. Visit levels from Brazil to the
years. UK have rebounded in the first half of 2017. There
• Business visitors and those coming to visit friends were 136,000 visits in the first half of 2017, which is
and/or relatives who live in the UK are more likely to 49% more than in the first half of 2016 and just 5%
be repeat visitors (81% and 70% respectively). below the first six months of 2015*.
Source: International Passenger Survey by ONS; repeat / first time visitors question asked in 2015
* Provisional data
9Market and Trade Profile Brazil
1.1 Key statistics: seasonality
Seasonality 2016
28% 28%
30%
24% 25%
27%
25% • The third quarter (July to September), which is the
Share of visits
25% 23%
winter period in Brazil, attracts the most Brazilian
20%
20% visitors. In 2016, 28% of visits from Brazil to the UK
15% were made in this third quarter. Visitation in other
10% quarters was evenly spread. Brazilians visit the UK
5% more often in the first quarter of the year compared to
0% the average UK visitor.
Jan-Mar Apr-Jun Jul-Sep Oct-Dec
• Due to the economic recession in Brazil the volume in
Brazil All markets all quarters in 2016 declined compared to 2015.
Seasonality trend (visits 000s)
120
100
80
60 53
46
40 45
42
20
0
2003 2004 2005 2006 2007 2008 2009 2010 2011 2012 2013 2014 2015 2016
Jan - Mar Apr - Jun Jul - Sep Oct - Dec
Source: International Passenger Survey by ONS
10Market and Trade Profile Brazil
1.1 Key statistics: length of stay and accommodation
Accommodation stayed in, 2016 Duration of stay trend (visits 000s)
(nights, % share) 140
1% 120
6% 100
80 75
9%
60
52
40 34
34%
20 23
0 2
26%
Nil nights 1-3 nights 4-7 nights
8-14 nights 15+ nights
• Brazilian visitors spent an average of 11 nights per visit in the UK
during 2016, longer than the global average of 7 nights. While
26%
holiday visitors stay an average of 6 nights, the same as the
global average, Brazilians visiting family and/or friends as well as
Free guest with relatives or friends Hotel/guest house study visitors tend to stay for longer.
Hostel/university/school Rented house/flat • The most common length of stay for Brazilian travellers to the UK
Bed & Breakfast Own home/other was 4-7 nights, followed by short trips of 1-3 nights.*
• More than one third of nights were spent for free in the house of
relatives or friends in the UK in 2016. Another 26% of nights were
spent in a hotel or guest house. 26% of nights were spent in a
Source: International Passenger Survey by ONS
* Many Brazilians visit the UK as part of a multi-country trip, explaining the hostel/university/ school (vs. the all-market average of 8%).
high number of short visits.
11Market and Trade Profile Brazil
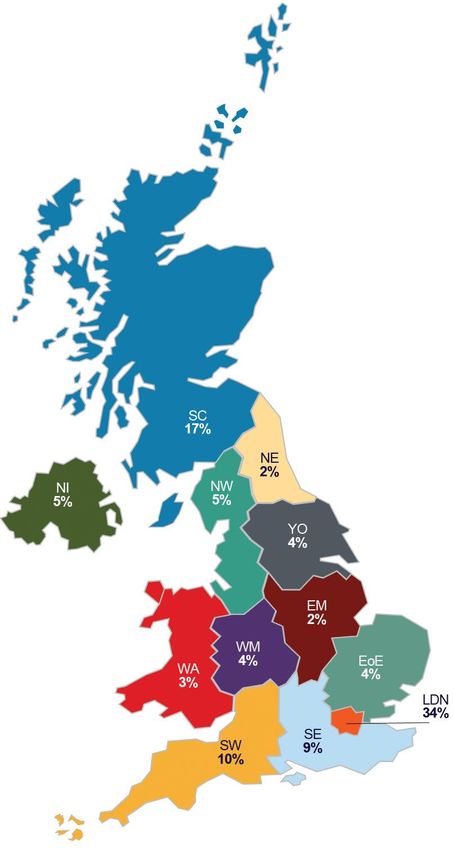
1.1 Key statistics: regional spread Nights (% share)
Nights & visits to the UK (2014-2016 averages)
Region* Nights Visits (000)
stayed** (000)
Total 2,557 268
Scotland (SC) 84 13
Wales (WA) 48 2
Northern Ireland (NI) 1Market and Trade Profile Brazil
1.1 Key statistics: regional spread and top towns and cities
Top towns and cities visited • Most Brazilian visitors stay in London, accounting for
70% of visitor nights between 2014 to 2016, much
(2014-2016 averages) higher than the global average. 25% of visitor nights
Town Overnight visits (000s) were spent in other parts of England.
• Brazilians are less likely to stay in Scotland. 3% of
London 221
nights in the period 2014 to 2016 were spent there,
Edinburgh 10 compared to a global average of 8% of all
Oxford 5 international nights spent.
• Holidaymakers from Brazil have a below average
Liverpool 5 propensity to visit rural and coastal areas of Britain
Manchester 4 on their trip.
• Brazilian visitors tend to be comfortable with taking
Regional spread 2014-2016 public transport in cities, showing above-average use
80%
of the bus, tube, tram or metro (79% compared to an
70%
70% all-market average of 53%).
Share of nights
60%
48%
50% 40%
40%
30% 25%
20%
8%
10% 3% 2% 3% 0% 1%
0%
Scotland Wales London Rest Of Northern
England Ireland
Brazil All markets
Source: International Passenger Survey by ONS
13Market and Trade Profile Brazil
1.1 Key statistics: visits to coast, countryside and villages
Propensity to visit coast, countryside and villages
5%
Holiday: Went to the coast or beaches
14%
12%
Holiday: Went to countryside or villages
18%
9%
All journey purposes: Went to the coast or beaches
10%
18%
All journey purposes: Went to countryside or villages
13%
0% 5% 10% 15% 20%
Source: International Passenger Survey by ONS 2016 Brazil All markets
14Market and Trade Profile Brazil
1.1 Key statistics: use of internal modes of transport
Propensity to use internal modes of transport
0%
Ferry/boat
2%
Car/vehicle you/group brought 6%
to the UK 15%
3%
Hired self-drive car/vehicle
8%
Private coach/minibus (for 7%
group only) 4%
Public bus/coach (outside 7%
town/city) 8%
42%
Taxi
32%
27%
Train (outside town/city)
28%
Bus, Tube, Tram or Metro Train 79%
(within town/city) 53%
2%
Domestic flight
2%
0% 10% 20% 30% 40% 50% 60% 70% 80% 90%
Brazil All markets
Source: International Passenger Survey by ONS 2013
15Market and Trade Profile Brazil
1.1 Key statistics: purchase of transport and package tours
Transport services purchased before or Proportion of visits that are bought as
during trip (%) part of a package or all-inclusive tour in
2016
60% 16%
54%
52% 14%
50% 50% 14%
50%
43% 12%
40% 40%
40%
36% 36% 10% 9%
31% 32%
30% 28% 29% 8%
27% 27%
26% 25%
24% 6%
6% 5%
20% 18%
15%
4%
10%
2%
0% 0%
Pre During Pre During Pre During Pre During Pre During Holiday All journey purposes
Transport Train travel Airport transfer Coach travel Car hire
within London
Brazil All markets Brazil All markets
International Passenger Survey by ONS, VisitBritain/IPSOS 2016, base: visitors To be defined as a package, a trip must be sold at an inclusive price covering both fares to and
from the UK and the cost of at least some accommodation. While some respondents may not know
the separate costs of their fares and their hotel because they bought several air tickets and several
sets of hotel accommodation from their travel agent, the ONS definition of a package is that the
costs cannot be separated.
16Market and Trade Profile Brazil
1.2 Visitor demographics
Visitor characteristics
• Brazilian business visitors in the UK are more than two
times as likely to be male than female.
• Brazilian visitors to the UK are predominantly aged 25 94%
of Brazilian travellers are
to 44 years (52% compared to the all-market average “very” or “extremely”
of 44%). likely to recommend
• The largest proportion of Brazilian visitors who came to Great Britain for a
holiday or short-break
the UK in 2016 reside in the city of São Paulo (48%), (2016)
followed by the city of Rio de Janeiro (23%).
• 88% of visits from Brazilian residents to the UK were
made by Brazilian nationals, 5% by British nationals.
• 36% of Brazilian holiday visitors (excl. UK nationals)
made a repeat visit to Britain.
• 89% of departing Brazilian holiday visitors felt “very” or
“extremely” welcome in Great Britain in 2016.
Source: International Passenger Survey by ONS, CAA 2016 (asked to leisure visitors)
17Market and Trade Profile Brazil
1.2 Visitor demographics: gender and age groups
Visitor demographics Age group trend
Gender ratio of visits from Brazil*:
48% women, 52% men 100
90
Women (% share of visits by journey purpose)*
80% 80
61% 56%
60% 52% 52% 70
40% 30%
Visits (000s)
20% 60
20%
50 50
0% 48
Business Holiday VFR 40
Brazil All markets
30 30
Men (share of visits by journey purpose)* 24
20 21
100% 80%
70% 10 12
80%
60% 48% 48% 44% 3
39% 0
40% 2002 2005 2008 2011 2014
20%
0% 0 -15 16-24 25-34
Business Holiday VFR
35-44 45-54 55-64
Brazil All markets
65+
Source: International Passenger Survey by ONS
* Data in this graph is based on 2014-2016 data
18Market and Trade Profile Brazil
1.2 Visitor demographics: origin
Visits to the UK in 2016
• The largest proportion of Brazilian
visitors who came to the UK reside in North
Recife
the city of São Paulo, followed by the 1 | 0.5%
4 | 4%
city of Rio de Janeiro. Together, each
Rest of Northeast
generated more than seven-in-ten 1 | 0.7%
inbound visits from Brazil in 2016.
rest of Central -
• Connectivity reflects these largest West
source cities. 1 | 0.6% rest of
Southeast
14 | 12%
Brasilia
Rio de Janeiro
6 | 5%
South 27 | 23%
Visits in 000s | % share of visits region
Unknown: 9 | 7% São Paulo
High 66 58 | 48%
Medium
Low
Source: International Passenger Survey by ONS, 2016
19Market and Trade Profile Brazil
1.2 Visitor demographics: welcome and recommending Britain
Feeling of ‘welcome’ in Britain Likelihood to recommend Britain
60% 70%
49% 60% 59%
50%
45% 45%
39% 50%
40% 45% 45%
40%
36%
30%
30%
20%
20%
12%
10%
10% 9%
10% 6%
0.4% 0.3% 0.0% 0.1% 0.0% 0.8% 0.0% 0.4%
0% 0%
Extremely Very Quite Not very Not at all Extremely Very likely Quite likely Not very Not at all
welcome welcome welcome welcome welcome likely likely likely
Brazil All markets Brazil All markets
Source: CAA 2016 (asked to leisure visitors)
20Market and Trade Profile Brazil
1.3 Britain and its competitors
Market size, share and growth potential
• The USA, Argentina and France were the most
visited destinations by Brazilian overnight visitors in
2016, with the UK holding 12th position.
• Brazil’s outbound travel market is recovering in 2017
from a decline caused by Brazil’s economic Forecast of
recession during 2016. overnight visits
• The number of overnight visits from Brazil to the UK from Brazil to the
is forecasted to increase significantly during the next UK in the period
decade. 2016 to 2025:
• Of those who came to Great Britain for a holiday, +112%
44% considered France, 38% Italy, 37% Germany,
36% Portugal and 35% Spain as an alternative
holiday destination.
• Among the competitor set, Italy and Portugal
recorded the highest growth in market share in terms
of Brazilian outbound overnight trips in the period of
2011 to 2016, of +4 and +3 percentage points
respectively.
Source: Oxford Economics, VisitBritain/IPSOS 2016
21Market and Trade Profile Brazil
1.3 Britain and competitors
UK’s market share of Brazilian overnight Historic and potential overnight visits from
visits among competitor set Brazil to the UK (000s)
37%
United States
36% 450
17% 391
France 400
23%
13% 350
Portugal
10%
11% 300
Italy
7%
250
8%
Spain
9%
200
6%
Germany
6% 150
4%
United Kingdom 100
6%
2% 50
Canada
2%
2% 0
Switzerland
2%
0% 10% 20% 30% 40%
2016 2011
Source: Oxford Economics
22Market and Trade Profile Brazil
1.4 Inbound activities
Inbound Britain activities
• Shopping, dining in restaurants, and
visiting museums or art galleries are the
most popular activities for Brazilian
visitors while in the UK, with 73%, 72%
and 54% doing so; these are all higher
than the all-market average.
• Brazilian visitors also have a high and
above average propensity to visit
parks/gardens (53%), going to a pub
(51%), visit castles/historic houses (47%)
or religious buildings (45%).
• Brazilian visitors have a high propensity
to purchase many items, including
clothes, cosmetics or toiletries and bags
or purses.
• About 8,000 visits per annum feature
time watching football.
Source: International Passenger Survey by ONS
23Market and Trade Profile Brazil
1.4 Inbound activities
Propensity to visit museums and Propensity to visit built heritage sites
galleries
63%
Holiday: visited religious buildings
67% 35%
Holiday
59%
48% Holiday: visited castles/historic houses
48%
All journey purposes: visited religious 45%
54% buildings 20%
All journey
purposes
All journey purposes: visited 47%
28%
castles/historic houses 28%
0% 20% 40% 60% 80% 0% 20% 40% 60%
Brazil All markets
Brazil All markets
Source: International Passenger Survey by ONS 2016
24Market and Trade Profile Brazil
1.4 Inbound activities
Propensity to attend the performing arts
5%
All journey purposes: Attended a festival
3%
16%
All journey purposes: Went to the theatre/musical/opera/ballet
9%
5%
Holiday: Attended a festival
4%
18%
Holiday: Went to the theatre/musical/opera/ballet
14%
0% 5% 10% 15% 20%
Brazil All markets
Source: International Passenger Survey by ONS 2016
25Market and Trade Profile Brazil
1.4 Inbound activities
Propensity to go for a walk Propensity to visit a park or garden
3%
Holiday: Walking along the coast
11% 57%
1% Holiday: Visiting
Holiday: Cycling parks or gardens
2%
50%
29%
Holiday: Walking in the countryside
26%
All journey purposes: Walking along the 5%
coast 8%
53%
1%
All journey
All journey purposes: Cycling purposes: Visiting
1% parks or gardens
32%
All journey purposes: Walking in the 23%
countryside 20%
0% 10% 20% 30% 40% 0% 20% 40% 60%
Brazil All markets Brazil All markets
Source: International Passenger Survey by ONS 2007, 2010 and 2016
26Market and Trade Profile Brazil
1.4 Inbound activities
Propensity to go shopping during visits to Propensity to purchase selected items
Great Britain
None of these 38%
16%
16%
Other holiday souvenir (not mentioned above)
39%
Items for your home e.g. furnishing 3%
73% 4%
All journey 3%
Electrical or electronic items e.g. camera
purposes 6%
57% CDs, DVDs, computer games etc 5%
10%
24%
Food or drink
22%
Games, toys or gifts for children 9%
14%
Books or stationery 13%
18%
Cosmetics or toiletries e.g. perfume 12%
71% 27%
Bags, purses etc 9%
Holiday 22%
70% Personal accessories e.g. jewellery 10%
18%
Clothes or Shoes 41%
65%
0% 20% 40% 60% 80%
0% 20% 40% 60% 80%
Brazil All markets All markets Brazil
Source: International Passenger Survey by ONS 2011, 2013
27Market and Trade Profile Brazil
1.4 Inbound activities
Propensity to go to restaurants, pubs and socialise with locals
17%
Holiday: went to bars or night clubs
14%
76%
Holiday: dining in restaurants
70%
32%
Holiday: socialising with the locals
36%
51%
Holiday: went to pub
50%
All journey purposes: went to bars or night 22%
clubs 12%
72%
All journey purposes: dining in restaurants
61%
All journey purposes: socialising with the 37%
locals 34%
51%
All journey purposes: went to pub
45%
0% 20% 40% 60% 80%
Brazil All markets
Source: International Passenger Survey by ONS 2007, 2008, 2011 and 2013
28Market and Trade Profile Brazil
Chapter 2:
Understanding
the market
29Market and Trade Profile Brazil
2.Understanding the market
Chapter summary
• Brazil’s economy emerged in 2017 from its deepest recorded
recession. As a result, its outbound travel market is recovering. The
87%
of Brazilian
number of outbound overnight trips from Brazil is forecast to break the international travellers
record by 2020. used social media
• Almost 6-in-10 Brazilian holiday visitors start thinking about their trip during their last
to Great Britain early, more than half a year in advance. 37% of holiday abroad
Brazilian travellers booked their trip to Britain three to six months
before arrival.
• Word-of-mouth, websites providing travellers’ reviews and
information from search engines influence the destination choice of
many Brazilians.
• “Cultural attractions”, “a wide variety of places to visit” and “a culture
that is different from their own” are strong motivators for Brazilian
visitors to choose Great Britain as a holiday destination.
• Brazilians are quite positive about Great Britain: the nation is ranked
8th among 50 nations for its overall image, although this compares to
an average global ranking in 3rd place.
Source: Oxford Economcis, VisitBritain/IPSOS 2016, GfK Anholt Nation Brands Index 2017
30Market and Trade Profile Brazil
2.1 Structural drivers
Demographics & society
• In 2017, is estimated that Brazil has a population of more
than 209 million, making it the fifth largest country by
population. The economy
in Brazil is
• The population in Brazil is relatively young; the share of the
forecast to
population aged 65 years or over was just 9% in 2017
grow by 2.5%
(forecast to rise to 14% by 2030).
in 2018
• Brazil is a culturally diverse country owing to waves of
immigration, both during the three centuries of Portuguese
rule and the slave trade from Africa, as well as European
arrivals after the World Wars in the 20th Century.
• After a severe recession in 2015 and 2016, the Brazilian
economy is recovering and investors’ confidence in Brazil is
growing. The forecast for economic growth is positive,
although fiscal/pension reforms are necessary to drive
growth which the Government will be voting on in 2018.
Source: Oxford Economics, CIA World Factbook 2017, The Financial Times Limited 2017, The World Bank Group 2017, United Nations Population Division 2017.
31Market and Trade Profile Brazil
2.1 Structural drivers: population and economic indicators
Population dynamics Economic indicators (year-on-year growth)
Measure Estimate Indicator 2017 2018 2019
Total population in 2017 209,480,000 Real GDP 1.1% 2.5% 3.3%
Median age 32 Consumer spending 1.0% 2.8% 3.3%
Average annual rate of population Unemployment rate 12.8% 12.4% 11.1%
0.8%
change in 2015 - 2020
Average earnings 6.1% 5.9% 6.1%
Consumer prices 3.5% 4.1% 4.2%
Source: CIA World Factbook 2017, Oxford Economics November 2017
32Market and Trade Profile Brazil
2.1 Structural drivers: general market overview
General market conditions
• Brazil was the UK’s 36th largest source market in • The first nine months of 2017 registered the lowest
visitor arrivals and 29th most valuable market for inflation for nineteen years in Brazil.
visitor spend in 2016. It is the UK’s #1 market for • According to Capgemini, Brazil counted 164,000 High
arrivals and spend in Latin America. Net Worth Individuals (HNWI) in 2016; these are defined
• GDP per capita began growing again in 2017 after as people with investible assets worth more than US$1
two years of sustained economic depression in million. 87% of these have US$30 million or more in
2015 and 2016. It is forecast to continue its investable assets; the so-called ultra-HNWIs.
recovery in the years ahead. • The country has a population of 209+ million with a
Key demographic and economic data median age of 32. The majority of Brazilians live along or
close to the coast, with many living in urban areas
Measure 2017 (86%). The cities of São Paulo and Rio de Janeiro are
the largest and richest municipalities, home to
Population (m) 209.5 approximately 10% and 6% of Brazil’s population,
respectively. Both municipalities are located in the
GDP per capita PPP (US$) 13,837
southeast region of Brazil, the most populous region in
Annual average GDP growth over the country.
1.5
past decade (%) • Brazil is a culturally diverse country. It is estimated that
Annual GDP growth in 2017 (%) 1.1 about half of the population have mostly European
ancestry (e.g. Germany, Italy, Poland, Portugal, Spain)
paired with many with African descent as well as part of
the population with Japanese roots.
Source: Oxford Economics November 2017, CIA World Factbook 2017, Capgemini World
Wealth Report 2016, IBGE, ETC, WorldAtlas
33Market and Trade Profile Brazil
2.1 Structural drivers: exchange rate trends
Exchange rate trends (cost of GBP in BRL)
6.00
5.00
4.00
3.00
2.00
1.00
2001 2002 2003 2004 2005 2006 2007 2008 2009 2010 2011 2012 2013 2014 2015 2016 2017
Please find the most up-to-date exchange rate trend based on monthly averages at visitbritain.org/visitor-economy-facts.
Source: Bank of England
34Market and Trade Profile Brazil
2.2 Consumer trends
• Brazil has the largest tourism economy in Latin
America. Its outbound overnight travel market is
forecasted to grow by 24% between 2016 to 2020.
• An important reason for the growing outbound travel
market is the economic recovery in Brazil. The size of
42%
of Brazilian visits to
the middle classes is rising again; therefore more the UK were a part of
Brazilians can afford to travel internationally. a multi-country trip in
• Many Brazilians have European ancestry. Together 2016
with the cultural and historical ties between Brazil and
Europe, this creates a natural interest for Brazilians to
travel to Europe for either a holiday or for visiting
friends or relatives. Cultural attractions, shopping,
sports events and education are other important
motivators for Brazilians to visit Europe.
• Portugal is especially popular among Brazilians as
Brazil was once a Portuguese colony. As both
countries share the same language, there is no barrier
to communication.
Sources: Oxford Economics, ETC, UNWTO
35Market and Trade Profile Brazil
2.2 Consumer trends: overall travel trends
Travel trends Destination of overnight visits abroad
• Many Brazilians combine their trip to the UK with an in 2016
overnight stay in one or more other countries. 13%
visited a country on the way to the UK; 9% visited a 4% 3%
country on the way home from the UK and 21%
included at least one night in another country both on
the way to/from the UK.
• More than half of overnight trips outside Brazil were
38%
spent in the Americas during 2016, mostly in the USA 55%
and Argentina. Almost four-in-ten overnight visits
were spent in Europe in 2016. In order, these were
France, Portugal, Italy, Spain, Germany and Great
Britain
• Brazil’s e-commerce market is growing as an
Americas Europe Asia Pacific Africa & Middle East
increasing number of Brazilians become comfortable
with making online purchases. Most of online
purchases are made via desktop or laptop.
• The majority of long haul travellers use social media
to look for special offers and share their thoughts/
opinions about travel destinations.
Source: Oxford Economics, International Passenger Survey by ONS, Qordoba, ETC
36Market and Trade Profile Brazil
2.3 Booking and planning
• A large proportion of Brazilian holiday visitors tend to
start thinking about their trip early with 58% doing
this as early as half a year or more in advance. 58%
• 37% of travellers booked in the three to six months of Brazilian visitors
window before arrival in Great Britain; more than one start thinking about
fifth did so more than six months in advance and their trip to Great
more than a fifth between one and two months in Britain 6+ months
advance. in advance
• The majority of Brazilian travellers to Great Britain
book travel and accommodation together (67%),
mostly online (61%) or face to face (31%).
• They are more likely than the average visitor to
purchase tickets for tourist attractions, sporting
events and guided sightseeing tours prior to their trip.
Source: VisitBritain/IPSOS 2016, base: visitors
37Market and Trade Profile Brazil
2.3 Booking and planning: booking channels and ticket sales
How trips to Britain were booked Propensity to make a purchase before or
during trip
1% 0% 1%
100% 60%
4% 9% 8% 52%
50% 50%
90% 1% 50% 46%
27% 15% 42%
80% Don’t know 41%
31% 38% 38%
40%
70% 31%
Did not book – stayed with 30%
28% 28%
60% 30%
friends / relatives 23% 24% 24% 23%22%
50% By phone 18%19%
20%
40% 11%
74%
68% Face to face 10%
30% 61%
20% 0%
Online Pre During Pre During Pre During Pre During Pre During
10%
Theatre / Sporting event Guided Guided Tickets / passes
0% Musical / tickets sightseeing sightseeing for other tourist
Concert tickets tours in London tours outside of attractions
Travel Accommodation Holiday
London
(travel and
accommodation) Brazil All markets
• Most Brazilians book their trip to Great Britain online, • Many Brazilian visitors booked their holiday activities
especially when reserving their accommodation. The before they start their journey. Most popular are tickets
majority of online bookings are made via a laptop/desktop. for guided sightseeing tours and for miscellaneous
• About two thirds of Brazilian visitors to Britain book their tourist attractions.
travel and accommodation together (67% of visitors), • Some tickets are booked during the trip by Brazilian
which is above the all-market average of 50%. About visitors, mostly for tourist attractions and theatre/
three-in-ten bookings were made face-to-face for these musical/ concert tickets.
holiday packages.
Source: VisitBritain/IPSOS 2016, base: visitors (online survey)
38Market and Trade Profile Brazil
2.3 Booking and planning: lead-times
Decision lead-time for visiting Britain • Brazilian travellers to Britain show a higher tendency
to start thinking earlier about their trip to the
70% destination than the global average. 58% start
thinking about their trip more than six months in
60% 58% advance compared to 49% across all markets.
50% • 41% of Brazilian travellers made their decision to
41% travel to Britain more than six months before the
37% 37%
40%
36% 35% actual journey; another 37% made their decision
28% three to six months before departure.
30%
23% 22%
21%
• 36% of Brazilian visitors reviewed options and prices
17%
20% 15% more than six months in advance, which is higher
9% 8% than the all-market average of 21%. Another 35%
10%
4% 4%
1% 1% 1% 2%
reviewed options and prices between three and six
0% months ahead of the trip and an almost equal share
6+ months 3-6 months 1-2 months Less than 1 Don't know
before trip before before month before
booked their trip in that same time frame.
• About two thirds of Brazilian visitors to Britain book
% starting to think about trip at each stage
their travel and accommodation together, which is
higher than the all market average of 50%. 64% of
% deciding on the destination at each stage
Brazilians that book such a combined holiday make
% looking at options/prices at each stage use of a travel agent / tour operator / travel
% booking the trip at each stage comparison website. 19% book their combined
holiday directly with the transport company and
Source: VisitBritain/IPSOS 2016, base: visitors another 17% book directly with the accommodation
provider.
39Market and Trade Profile Brazil
2.4 Reaching the consumer
• Friends and relatives, travellers’ reviews and
information from search engines play an important role
for Brazilian travellers when choosing their destination.
• Technology is key for Brazilians when they travel; these
travellers are more ‘connected’ than residents from
other Latin American countries when on holiday.
Facebook
dominates the social
• The highest number of social media users in Brazil media platforms in
live in the Southeast of Brazil. Brazil’s most populous Brazil in terms of
cities of São Paulo and Rio de Janeiro can be found in daily usage.
this region.
• TV is the main medium for Brazilians to obtain news
and entertainment, however digital media consumption
has made strong gains.
• Brazilians are heavy social media users. In terms of
daily usage, Facebook is the most used social media
platform in Brazil, followed by YouTube. Instagram and
Google+ are other frequently used channels.
Source: VisitBritain/IPSOS 2016, comScore Media Metrix 2015, PwC’s Global Entertainment and Media Research
40Market and Trade Profile Brazil
2.4 Reaching the consumer
Broadcast media Radio
• TV is the preferred medium for Brazilians to obtain • 44% of Brazilians listen to the radio daily, with almost
news and entertainment with 77% of the population half of the audience within the affluent class A / B.
watching 3 to 4 hours each day. TV Globo dominates • Music is the most popular radio format, followed by
as the preferred free-to-air channel with Record, SBT news and traffic information.
as a distant second and third, followed by BAND.
News, films, reality programming, variety shows (on
weekends) and soap operas (novellas) are the most
Magazines
popular programs. • Almost one quarter of Brazil’s population read
magazines regularly, 50% of readers do so weekly.
• Pay TV penetrates 18.8 million affluent households. • Weekly celebrity, news and sport magazines attract
the highest number of readers. Within the
Newspapers travel/lifestyle space, circulations are much smaller,
• The average time spent reading newspapers by but targeted towards affluent Brazilian consumers.
Brazilians per day is one hour and 10 minutes. • Key titles include Viagem E Turismo, Viaje Mais,
• Brazilians continue to migrate from print to digital Viajar Pelo Mundo and Top Destinos.
newspaper platforms. Print circulations are decreasing
(-6% in 2016), while online readership grows. Online media
• Daily newspapers with the highest circulation (print and • About 140 million Brazilians use internet; this equates
web - # indicates rank) in 2016 that reach the affluent to 68% of the Brazilian population.
class A / B segments include O Globo (#2), Folha de • In 2017, smartphones surpassed computers as the
São Paulo (#3), O Estado de São Paulo (#4), Zero preferred device to access digital content.
Hora (#6), Estado de Minas (#14), A Tribuna (#19), O • YouTube and Facebook have the highest penetration
Tempo (#20) and Correio Brazilense (#21). rate, each at around 65%. Instagram engages 40%
• UOL, R7 and Terra are popular online news/info sites. and Twitter 36% of the population respectively.
WhatsApp is used by 52% of connected Brazilians.
Source: BBandaB, Meio & Mensagem, Inteligencia, Pesquisa Brasileira de Mìdia 2016, Pensario Internacional, Reuters Institute, StatistaMarket and Trade Profile Brazil
2.4 Reaching the consumer: social media on holiday
Use of social media on holiday
To keep in touch with people at home 61% • 87% of Brazilian international travellers used social
44% media during their last holiday abroad, higher than the
59%
To post / upload photos of my holiday
39%
all-market average of 71%. Many used social media
47%
during their holiday to keep in touch with people at
Look for recommendations for places to eat or drink
30% home and/or to post photos of their holiday.
I have not used social media at all on this type of
holiday
13%
29%
• Facebook dominates the social media platforms in
Share with others where you are / what you are doing 47%
Brazil in terms of daily usage, followed by YouTube,
while on holiday 29% Instagram, and Google+.
To let people know where I am at a given moment (e.g. 39% • Brazilian international travellers have a higher than
checking in on Facebook) 25%
To help you plan / decide where to go or what to see or
average usage of smartphones and tablets when on
35%
what to do 23% holiday. 9-in-10 visitors regard their smartphone as an
Ask for advice on where to go or what to do 39% essential item whilst they go on holiday (compared to
20% 73% all-market average).
Share my own advice or recommendations about 36%
visiting where I am 19% • In general, 74% of Brazilians enjoy writing reviews on
0% 50% 100%
social media about places they visited on holiday, and
a similar proportion place trust in social media reviews
Brazil All markets from other tourists. This is much higher than the all-
market average of 42% and 54%, respectively.
Source: VisitBritain/IPSOS 2016, base: all respondents: Have you used social media in any of the following ways whilst on your last holiday to Britain (visitors) /on your last holiday to a foreign
destination (considerers)?
42Market and Trade Profile Brazil
2.4 Reaching the consumer: influences
Influences on destination choice
31%
Talking to friends / relatives / colleagues 40%
28%
Information from search engines [e.g. Google] 33%
26%
Looking at prices of holidays/flights on price comparison websites 31%
29%
Websites providing traveller reviews of destinations [e.g. TripAdvisor] 30%
24%
Talking to friends or family in your social network (e.g. via Facebook / Twitter) 26%
23%
An accommodation provider/ hotel website 26%
23%
A travel guidebook 25%
26%
Travel agent or tour operator website 25%
21%
Travel blogs / forums 22%
21%
Travel programme on TV 19%
19%
A special offer or price deal you saw advertised online 19%
19%
Travel agent or tour operator brochure 18%
19%
An official tourist organisation website or social media site for the country or destination 18%
19%
An official tourist brochure for the country / city / region 17%
15%
A travel feature / article in a magazine or newspaper 16%
16%
Direct advice from a travel agent/tour operator (face-to-face, over the phone) 16%
17%
Images or videos your friends or family have posted to social media 15%
18%
Images / information in online adverts 15%
14%
A special offer or price deal you saw advertised offline e.g. in a newspaper, magazine or on TV 15%
18%
Images or videos from a photo/video sharing social network site 14%
19%
Travel app 14%
13%
Images / information in adverts in a magazine or newspaper 12%
10%
Articles on an online encyclopaedia e.g. Wikipedia, Wikitravel 12%
16%
Images / information in TV adverts 11%
11%
Seeing social media posts from celebrities talking about their holiday destinations 9%
9%
Images / information on billboards / poster adverts 9%
7%
Travel programme on radio 6%
8%
Information in radio adverts 6%
0% 5% 10% 15% 20% 25% 30% 35% 40% 45%
Brazil All markets
Source: VisitBritain/IPSOS 2016, base visitors & considerers. Which of the following sources influenced your choice of destination? (Market scores have been adjusted so that the sum of all influences
for each market is equivalent to the global total, to enable meaningful comparisons)
43Market and Trade Profile Brazil
2.5 Perceptions of Britain
• Brazilians rate Great Britain highly for contemporary culture as
well as historic buildings and monuments, but less for scenic
natural beauty. Britain is rated 8th out of fifty nations for the
Britain is the
former two attributes and 24th for the latter.
• Britain is ranked even higher for contemporary culture and 8th strongest
historic buildings at the global level. This could be a result of nation brand
the relatively low knowledge Brazilians have of Great Britain’s among 50 nations
destination attributes (see VisitBritain’s Britain and Competitors according to Brazilians
Foresight report for further analysis).
• Museums and music are the cultural products that are most
strongly associated with Great Britain by Brazilians.
• Cultural attractions motivated many Brazilian visitors (36%) to
choose Great Britain for their holiday destination. A wide variety
of places to visit and a culture that is different from the Brazilian
culture are important motivators as well (both 31%).*
• The USA, Italy, France and Australia are destinations that
Brazilians consider are the ‘best place’ for delivering what they
want most from a holiday destination.
Source: GfK Anholt Nation Brands Index 2017, Arkenford 2013, VisitBritain/IPSOS 2016
* (Market scores have been adjusted so that the sum of all motivations for each market is equivalent to the global total, to enable meaningful comparisons)
44Market and Trade Profile Brazil
2.5 Perceptions of Great Britain
Great Britain’s ranking (out of 50 nations)
Measure Brazilian All
respondents respondents
Overall Nation Brand 8 3
Culture (overall) 9 5
The country has a rich cultural heritage 11 7
The country is an interesting and exciting place for contemporary culture such as
8 3
music, films, art and literature
The country excels at sports 11 4
People (overall) 10 6
If I visited the country, the people would make me feel welcome 13 13
Tourism (overall) 12 3
Would like to visit the country if money was no object 11 6
The country is rich in natural beauty 24 24
The country is rich in historic buildings and monuments 8 5
The country has a vibrant city life and urban attractions 9 4
Source: GfK Anholt Nation Brands Index 2017
45Market and Trade Profile Brazil
2.5 Perceptions of Great Britain
Cultural associations Adjectives describing a potential trip to
Great Britain
37% 32%
Museums Educational
45% 33%
35% 32%
Music Fascinating
39% 32%
32% 32%
Films Exciting
37% 30%
31% 17%
Sports Romantic
36% 17%
26% 14%
Modern Design Relaxing
29% 16%
25% 6%
Pop videos Spiritual
29% 8%
25% 6%
Sculpture Stressful
23% 8%
25% 4%
Opera Risky
23% 7%
10% 5%
Street Carnival Boring
14% 7%
10% 5%
Circus Depressing
13% 5%
0% 10% 20% 30% 40% 50% 0% 10% 20% 30% 40%
Brazil All markets Brazil All markets
Source: GfK Anholt Nation Brands Index 2017
46Market and Trade Profile Brazil
2.5 Perceptions of Britain
Holiday wants and % saying destination is best place for…
Importance GB FR IT AU US GE
6.42 Have fun and laughter 18% 35% 28% 27% 62% 15%
6.40 Enjoy the beauty of the landscape 25% 56% 59% 53% 28% 28%
6.40 Offers good value for money 20% 23% 31% 24% 52% 19%
6.38 Fashionable destination 43% 69% 70% 50% 55% 41%
6.35 Experience activities/places with a wow factor 26% 44% 45% 43% 42% 31%
6.32 Experience things that are new to me 31% 40% 35% 36% 48% 34%
6.32 See world famous sites and places 45% 68% 66% 28% 58% 40%
6.29 It offers unique holiday experiences 43% 56% 57% 58% 54% 42%
6.25 Broaden my mind/ Stimulate my thinking 42% 54% 49% 31% 45% 39%
6.25 Visit a place with a lot of history/historic sites 53% 68% 73% 16% 25% 47%
6.25 Provides a wide range of holiday experiences 38% 51% 55% 54% 63% 39%
6.24 Explore the place 26% 34% 43% 43% 42% 25%
6.24 Enjoy local specialities (food and drink) 29% 74% 74% 25% 31% 34%
6.22 The people are friendly and welcoming 21% 28% 48% 37% 30% 21%
6.21 Do what I want when I want spontaneously 14% 32% 35% 32% 41% 15%
6.20 Enjoy peace & quiet 18% 42% 46% 33% 15% 19%
6.17 A good place to visit at any time of year 26% 40% 44% 41% 51% 25%
6.15 Get off the beaten track 27% 46% 42% 40% 41% 29%
6.15 Good shopping 20% 36% 22% 13% 77% 12%
6.12 Feel connected to nature 12% 36% 39% 70% 15% 11%
6.10 Enjoy high quality food and drink (gourmet food) 13% 70% 68% 16% 20% 29%
6.05 Do something the children would really enjoy 33% 36% 39% 44% 79% 26%
6.04 Easy to get around by public transport 50% 51% 42% 30% 52% 46%
6.00 Have dedicated time with my other half 40% 70% 69% 38% 44% 40%
5.96 Soak up the atmosphere 22% 42% 51% 34% 36% 38%
5.96 Be physically healthier 26% 36% 40% 43% 34% 26%
5.88 Meet the locals 42% 34% 67% 42% 25% 17%
5.85 Visit places important to my family's history 13% 22% 44% 10% 31% 25%
5.60 Do something environmentally sustainable/ green 31% 38% 38% 49% 19% 41%
5.57 Go somewhere that provided lots of laid on entertainment/nightlife 46% 52% 51% 34% 73% 36%
5.54 Feel special or spoilt 14% 29% 32% 19% 21% 11%
5.53 Chill/ slow down to a different pace of life 14% 22% 31% 20% 22% 13%
5.48 Party 38% 31% 46% 33% 52% 23%
5.47 Revisit places of nostalgic importance to me 24% 38% 41% 16% 24% 27%
5.46 Get some sun 10% 18% 25% 42% 34% 13%
5.43 Meet and have fun with other tourists 15% 36% 35% 10% 41% 27%
5.34 Experience adrenalin filled adventures 15% 25% 22% 51% 52% 16%
5.33 To participate in an active pastime or sport 17% 28% 31% 43% 50% 23%
5.22 Watch a sporting event 33% 35% 41% 26% 55% 31%
5.17 Do something useful like volunteering to help on a project 32% 30% 32% 33% 32% 28%
Source: VisitBritain/Arkenford 2013, base: international travellers from Brazil
47Market and Trade Profile Brazil
2.5 Perceptions of Britain
Motivations for choosing Britain as a holiday destination
36%
Cultural attractions 42%
31%
Wide variety of places to visit 25%
23%
Wanted to go somewhere new 23%
9%
Vibrant cities 22%
18%
Countryside/natural beauty 22%
21%
Easy to get around 22%
18%
Somewhere English-spoken 22%
14%
Visiting friends or relatives 22%
10%
Ease of getting to the country 21%
31%
A culture different from own 19%
21%
A mix of old and new 19%
23%
Contemporary culture 18%
20%
Try local food and drink 18%
12%
A good deal 18%
26%
Security / safety 17%
22%
Accommodation (variety & quality) 16%
14%
Easy to get plan/organise 16%
22%
Meeting locals 13%
13%
Wide range of holiday activities 13%
17%
The climate / weather 12%
12%
Cost of staying in the destination 12%
10%
Watching sport 10%
9%
Visit a film/TV location 9%
7%
Easy to visit with children 8%
0% 5% 10% 15% 20% 25% 30% 35% 40% 45%
Source: VisitBritain/IPSOS 2016, base: visitors (Market scores have been adjusted so that the sum of all
motivations for each market is equivalent to the global total, to enable meaningful comparisons) Brazil All markets
48Market and Trade Profile Brazil
Chapter 3:
Access and travel
trade
49Market and Trade Profile Brazil
3. Access and travel trade
• Brazilians are among the visitors who are most likely to visit
the UK as part of a multi-country tour (including an overnight
stay in another country either before arriving and/or after
leaving the UK). Thus many Brazilians arrive by the Channel
42%
Tunnel (24% of visitors in 2016 compared to 12% of all of Brazilian visits to
inbound visitors to the UK). the UK in 2016 were
• 74% of Brazilian visits to the UK were made by plane in 2016. part of a multi-country
trip
The international airports in the cities of São Paulo and Rio
de Janeiro are connected to London (Heathrow) via direct
non-stopping flights. In 2017 there was an average weekly
capacity of 5,500 seats.
• Brazil’s travel trade sector consists predominantly of travel
agencies that sell packages or bespoke itineraries, paired
with many products provided by tour operators.
• Many agencies and tour operators are growing their focus on
niche markets, especially in the luxury segment.
Source: Apex Rdc 2016, VisitBritain/IPSOS 2016, base: visitors
50Market and Trade Profile Brazil
3.1 Access: key facts
• 24% of Brazilian visitors arrive through the 24% of Brazilian
Channel Tunnel as part of a multi-country trip,
which is twice as high as the all-market average. visitors arrive to the
74% arrive by plane.
• After a decrease of two years, airline capacity
UK through the
picked up again at the end of 2017. In Channel Tunnel.
November and December 2017, seat capacity
increased by 9% compared to the same period
in the previous year. Access to Britain*
• The international airports in the cities of
São Paulo and Rio de Janeiro held 79% and Measure 2017
21% of seat capacity between Brazil and Great Weekly aircraft departures 19
Britain in 2017, respectively. Weekly aircraft seat capacity 5,500
• British Airways (São Paulo and Rio de Janeiro) Airports with direct routes in Brazil 2
and LATAM Airlines Brasil (São Paulo), are the
Airports with direct routes in Britain 1
airlines serving non-stop Brazil-Great Britain
routes, both arriving at London Heathrow.
Source: International Passenger Survey by ONS, Apex RdC 2017 * non-stop flights only
51Market and Trade Profile Brazil
3.1 Access: mode of transport
Visits by mode of transport Annual share by mode (2016)
250 80% 74% 74%
200
60%
Visits (000)
150
138 40%
100
24%
45 20% 14%
50 12%
2%
0 4 0%
Air Sea Tunnel
Brazil All markets
Air Sea Tunnel
Source: International Passenger Survey by ONS
52Market and Trade Profile Brazil
3.1 Access: capacity
Annual airline seat capacity trends Origin airport annual seat capacity (2017)
400,000 21%
Sao Paulo - Guarulhos International
350,000 Rio De Janeiro - Internacional
300,000
285,984 79%
Departing seats
250,000
200,000
Airline seat capacity by carrier (2017)
150,000
100,000
50,000 British Airways
49% 51%
LATAM Airlines Brasil
0
2006
2007
2008
2009
2010
2011
2012
2013
2014
2015
2016
2017
Source: Apex Rdc 2017: non-stop flights only
53Market and Trade Profile Brazil
3.2 Travel trade: general overview
• Brazil’s travel trade consists predominantly of travel agencies that sell package or bespoke
itineraries, as well as products provided by tour operators to the end consumer. Tour operators
within the market often specialise in specific areas of the world; such as Europe/USA/
Caribbean, or within market areas such as leisure, business/corporate, MICE etc.
• Since Brazil’s economic crisis officially came to an end in early 2017, the country’s travel trade
sector has evolved. There has been consolidation with operators purchasing its competitors, as
well as many agencies and operators going out of business.
• Today, significant operators within the Brazil market include: Abreutur, Agaxtur, Alatur, CVC,
Flytour Viagens, MMTGapnet, Newit, New Age, Orinter Tour & Travel, Primetour, Queensberry,
Teresa Perez, and Trend Operadora.
• Brazilian travel trade develop preferred business relationships with suppliers that offer
Portuguese speaking staff. Staff that speak Spanish is a distant secondary preference.
• Many agencies and tour operators are growing their focus on niche markets, especially within
the luxury segment. This has allowed agencies and operators to distinguish their business from
online booking platforms, providing personalized service and the ability to curate bespoke travel
experiences/itineraries for their clients.
54Market and Trade Profile Brazil
3.2 Travel trade: general overview
Trade Exhibitions Travel and accommodation booking
• Brazil has two large annual trade shows in São Paulo • More than two thirds of Brazilian holiday visitors to Great
(WTM Latin America – early April, ABAV late Britain book their travel and accommodation together.
September), paired with regional trade shows (such
as Festuris each November in southern Brazil). Some 2%
operators are organising their own events, such as
Hiperfeirão Flytour, as well as regional events by the
national tour operator association BRAZTOA. 31%
• ILTM Latin America each late April/early May
(previously Travelweek São Paulo by ILTM) is a
popular luxury travel trade show. Each year, a select
group of premium travel agents and tour operator
professionals from across Brazil and Latin America 67%
are invited to participate; engaging with luxury tourism
product from around the world during a three-day
program with scheduled meetings, networking events
and parties.
Booked travel & accommodation together
Booked travel & accommodation separately
Don't remember
Source graph on the right: VisitBritain/IPSOS 2016
55Market and Trade Profile Brazil
3.2 Travel trade: Brazilian holiday calendar
National public holidays
2018 2019 National public holidays
1 January 1 January New Year’s Day
12 – 13 February 4 – 5 March Carnaval
30 March 19 April Good Friday
21 April 21 April Tiradentes Day
1 May May 1 Labor Day / May Day
30 May 20 June Corpus Christi Day
7 September 7 September Independence Day
Our Lady Aparecida/
12 October 12 October
Children's Day
2 November 2 November All Souls' Day
15 November 15 November Republic Proclamation Day
25 December 25 December Christmas Day
Note: Many states and cities have their own public holiday schedules. Be sure to check before confirming visit dates.
Source: www.timeanddate.com/holidays/brazil/
56Market and Trade Profile Brazil
3.2 Travel trade: practical information
Where to find the trade Weather
• Most tour operators have head offices in the Greater São • Weather varies across Brazil owing to its immense size.
Paulo metropolitan area, with travel trade contacts spread Located in the Southern Hemisphere, its seasons are the
throughout Brazil. Rio de Janeiro is a secondary hub for opposite to Great Britain’s.
travel trade. Other cities of importance include Brasilia, • São Paulo has a temperate climate, ranging from 15°C in
Belo Horizonte, Curitiba, Porto Alegre and other cities in winter to around 35°C in summer. Rio de Janeiro is warmer
São Paulo state such as Campinas and Riberão Pretro. with temperatures ranging from the 20°Cs in winter to the
Time difference low 40°Cs in summer.
• Outside of daylight savings time, late February to late • Expect cooler weather in Southern Brazil. For example, in
October, Brazil is four hours behind Greenwich Mean Time Porto Alegre, temperatures can be close to freezing in the
(GMT). winter months and low 30°Cs in the summer.
• During daylight savings time, early November through mid Transport
February, the south, southeast and central eastern parts of • In São Paulo’s city centre or along Avenida Paulista, use
the country are two hours behind GMT. Many of Brazil’s the subway for short journeys.
north and northeast states (Bahia, Ceará, Pernambucu) do
not adopt daylight savings time and are three hours behind • In other cities across Brazil, public transport can be
GMT during this period. unreliable and limited in its reach. Uber is widely available
and provides an easy point-to-point travel solution.
• The transitions between standard time and daylight savings
time are on different dates within Great Britain and Brazil. • Taxis can also be hailed by hotels, from the street or picked
Owing to this, there can be a few weeks when the time up at stands (pontos) across each city.
difference can be three hours between Brazil and • Traffic is a major issue in most Brazilian cities. Always
Great Britain in late October/early November and mid/late leave plenty of time for travel between meetings.
February each year.
57Market and Trade Profile Brazil
3.2 Travel trade: planning cycle and etiquette
Planning cycle • Meetings will normally take longer than the allocated
time. Owing to the importance of personal relationships in
• January to March is the main time of year for planning
Brazil, always allow time for small talk before starting
and building products for the European and North
business discussion. On arrival, it is considered good
American summer. August to October is another
manners to greet each person in the room individually
important time of year.
with a handshake. Anticipate water and espresso to be
• Many Brazilians book their travel in the fourth quarter and served in every meeting.
in January of each year.
• Personal relationships are the key to business success in
Business meeting etiquette Brazil. Your relationship with clients will be with an
• Normal European business attire is standard dress code individual rather than a company, so changing personnel
for business in Brazil. Slightly more casual dress can be can be a setback to the development or maintenance of
acceptable in the north and northeast of the country business in the market.
owing to the warmer, tropical climate.
• Appearance is extremely important in Brazil. First Hospitality etiquette
impressions can count for a lot when establishing a
• Eating out is an important social activity in Brazil. As a
business relationship with Brazilians.
result, business lunches and dinners are an important
• Punctuality can sometimes be more flexible in Brazil, part of doing business. This links back to the
certainly in relation to British standards. However, if late importance of personal relationships in doing business.
for a business meeting, advise your Brazilian client – It is a good opportunity to socialise with your clients
they will usually understand. and help them build their trust in you.
• Most large cities in Brazil have heavy traffic issues, • Hectic appointment schedules, protracted meetings
so incorporate plenty of time for travel between and bad traffic can often mean you and/or your client
confirmed appointments. could be late for scheduled meetings.
58You can also read