Solar Thermal Markets in Europe - ESTIF
←
→
Page content transcription
If your browser does not render page correctly, please read the page content below
Solar Thermal
Markets
in Europe
                                    IN THIS ISSUE

                                    Country Focus:
                                    Croatia

                                    Solar Thermal
                                    Markets
                                    at a Glance

                                    Reaching the
                                    2020 targets
                                    with solar thermal!

                                    Energy Labelling
                                    and Solar Thermal

                                           AND MARKET STATISTICS
                                             FROM ACROSS EUROPE

Trends and Market Statistics 2012
June 2013
Table of contents
Editorial What have we achieved for the
Robin M. Welling, President of ESTIF.............................................. 3 European solar thermal industry in 2012?.............................. 3
Solar thermal markets in EU 27 Germany, the leader and main driver
and Switzerland (glazed collectors) ................................................. 5 of the European market ..................................................................................5
Solar thermal markets between Solar thermal markets between 35 and 140 MWth....8
140 and 350 MWth.................................................................................................6 Switzerland ........................................................................................................................8
Italy and Poland............................................................................................................6 Denmark, Portugal, UK, Belgium ...........................................................9
France, Greece and Spain..............................................................................7
Austria...................................................................................................................................... 8
Detachable map: Strategic Research Priorities .................................................................12
Solar thermal markets in Europe ...................................................10 Strategic Research and Innovation Agenda ...................... 12
Market size in terms of solar thermal capacity (KWth) Country Focus: Croatia ............................................................................. 14
and in terms of collector area (m2) ............................................ 13
Energy labelling and solar thermal ................................................ 16 Reaching the 2020 targets with solar thermal!............ 18
Download the Brochure here:
Disclaimer:
Please note that all figures presented in this brochure reflect ESTIF knowledge at the time of publication. This publication is
For some countries, the data provided are only ESTIF estimations. printed on recycled
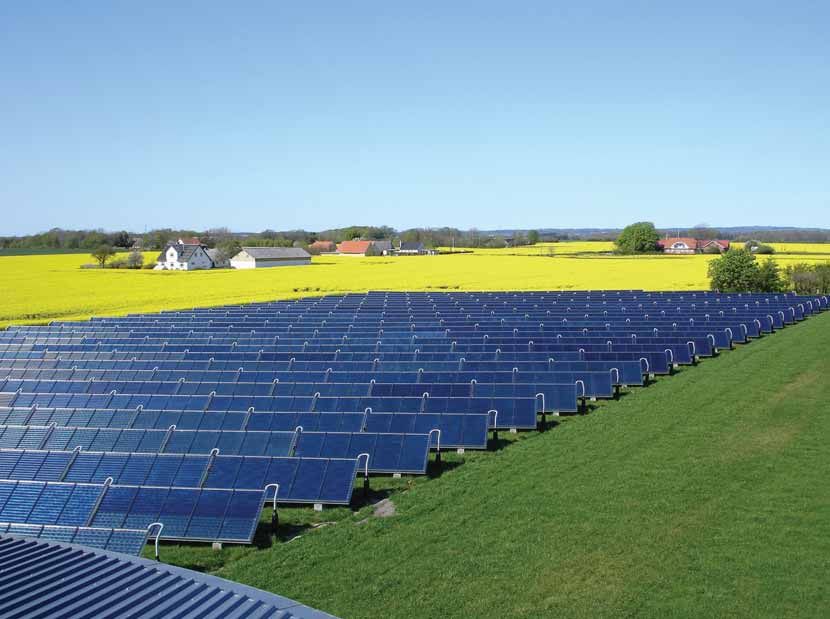
Picture courtesy of: ARCON SOLAR A/S paper
2
Solar Thermal Markets in Europe
                                                                                                                                                      Trends and Market Statistics 2012

A word from the President
                                          On the road to achieving the 2020               On a note of optimism, I would like mention the “Greek miracle”. Against all odds,
                                          EU energy savings objectives, with              the Greek market has remained stable over the past two years, in spite of the hard
                                                                                          hitting recession. What does that tell us? A national industry producing a price
                                          an increased share of renewable
                                                                                          competitive product does not necessarily require public support for a sustained
                                          energy sources, 2012 will probably              growth. In these times of uncertainties, solar heat is affordable and gives consumers
                                          not feature among the best years.               independence from energy bills.
                                         The image of renewable technologies in the           When looking closely at other growing countries, such as Belgium, Hungary, and
                                         media has been blurred by recurring              Poland, it is interesting to note that, in each of these emerging markets, financial
                                         discussions and polemics over the costs of       incentive schemes sustain the uptake of solar thermal. This confirms that financial
                                         financial incentives and their alleged impact    support is vital in the early stages of market development. I would like to seize this
                                         on energy prices. Public opinion and indus-      opportunity to reaffirm our position on the question of financial support for solar
                                         try leaders are now questioning the EU           heat, renewable heat and/or energy efficiency.The debate on their design, amounts,
                                         and national climate priorities. Since the       administration and impact should not make us forget that energy policy has always
                                         “Carbon Capture” has definitely proved to        relied heavily on public support, and that gas, oil, nuclear, coal benefit from direct
                                         be uncompetitive; the spotlight has moved        or indirect public financial investment, tax reductions and R&D funding. The
to the shale gas “fracking” issue, and to divert attention from the environmental         support for solar heat, energy savings and renewable energy should be about a
risks, policies favourable to renewable energy sources are blamed for the delay in        real level playing field in the market. The “energy transition” is a political choice
exploiting gas reserves.                                                                  implemented via public policies as energy policies always are.
   Moreover, the economic growth, in general, and in the building sector, in                  In the “Solar Thermal Markets 2012” you will find a new presentation of
particular, has not resumed in Europe. We need to view the 6.4% decrease in the           national market figures highlighting the cumulated installed capacity and clearly
EU solar thermal market in this broader context: PV has declined by 23%, heat             showing that solar thermal is a significant component of the EU energy mix; a focus
pumps by 2% and fossil fuels have not been spared as sales of gas and oil boilers         on Croatia, an interesting market joining the EU in 2013; information on the energy
have also declined by over 4%. Of course, these figures are of no comfort to us,          labelling for solar thermal and the recently pubilshed Strategic Research Priorities
and stagnation in the renewable and efficient heating market is not good news for         for solar thermal.
solar thermal. However, gearing up to growth is extremely challenging in a declining
market, where consumers and investors are obviously expecting definite signs of           Good reading and sunny regards,
recovery and clearer recommendations from public authorities.                             Robin Welling

Some of ESTIF’s achievement for the European Solar Thermal Industry
                          Members of the thermal community, whether panel/systems or component manufacturers,
                               certification bodies, test labs or service providers, ESTIF is fighting for you!

    ESTIF has strengthened its collaboration with the              ESTIF has supported the work of the                      ESTIF is, in anticipation of the upcoming energy
 IEA solar heating and cooling programme to organise           European solar thermal panel (ESTTP) within                labelling legislation, pro-actively preparing to guide
  a joint reference solar thermal conference in Europe,       the Renewable Heating and Cooling Technology                   the industry through a smooth implementation
      starting in 2013: The SHC 2013 International          Platform, resulting in the publication of the Strategic         of the requirements; also ensuring both visibility
       Conference on solar heating and cooling for            Research Priorities for solar thermal technology:           and promotion for solar thermal as a highly efficient
                   buildings and industry.                   the reference document at EU and national level                       and carbon free heating technology.
                                                                for technological innovations in our industry.

  ESTIF, together with the Solar Keymark Network,                                                                              ESTIF, together with other industries from
 is monitoring and influencing crucial developments             ESTIF remains, until the final adoption of the energy      the renewable and heating sector, highlighted the
     in the field of standardisation, certification and          labelling regulations, in close contact with the EU      importance of renewable heating in several policy
       technical regulations. For example, with the             institutions to ensure the most favourable outcome         and legislative initiatives, e.g. the Energy Efficiency
completion of the process leading to the CE marking                                for our industry.                     directive, the debate on the post 2020 EU policies,
    for solar collectors or the forthcoming revision                                                                        resulting in several amendments and improved
  of several solar thermal standards to comply with                                                                       drafting for our industry. Moreover, following these
              the energy labelling regulations.                    ESTIF organised or participated in several               joint efforts, the Commission has announced a
                                                                  events, conferences, workshops involving EU            dedicated heating and cooling initiative for late 2013.
                                                                   institutions, national public authorities and
                                                                   other industries to promote solar thermal
                                                                   as a key technology in the EU energy mix.

                                                                                                                               ...a far from exhaustive list!

                                                                                      European Solar Thermal Industry Federation (ESTIF)
                                                                             Renewable Energy House, Rue d’Arlon, 63-67, B-1040 Brussels
                                                                                       Tel: +32(0) 2 546 19 38 Fax: +32 (0) 2 546 19 39
                                                                                                             info@estif.org www.estif.org

                                                                                                                                                                                      3
www.solarthermalworld.org

                       Spreading the message across Europe
European Solar Days    Visit the website www.solardays.eu
                       and get all the information you need!

                THE NEXT CAMPAIGN IS SCHEDULED FOR 1-18 May 2014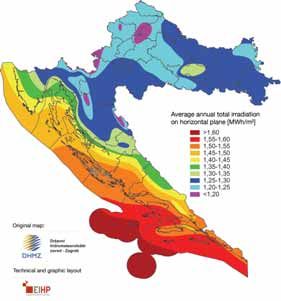
Solar Thermal Markets in Europe
Trends and Market Statistics 2012
Solar thermal markets in EU 27 and Switzerland
(glazed collectors)
EU TURNOVER: 2.4 bn EUR EMPLOYMENT: 32 000 JOBS
In 2012, the European market experienced a reduction Solar Thermal Market in EU27 and Switzerland
MWth Total and Newly Installed Capacity (glazed collectors) m2 (x1000)
in the overall newly installed capacity which amounted to 30 000 5 000
2.4 GWth (approximately 3.4 mio m²): a decrease of 6.4% in 27 000 4 500
comparison with the previous year. The total installed capacity 24 000 4 000
registered a net increase of 2 GWth, now reaching 28.3 GWth 21 000 3 500
(40.5 mio m²). This represents an increase of 7.7% compared 18 000 3 000
with the 2011 total installed capacity. 15 000 2 500
12 000 2 000
The European Union market continues to suffer from the constraints imposed by 9 000 1 500
the financial and economic crises affecting most of the continent, resulting in a 6 000 1 000
sluggish construction sector and reduction of public support schemes for solar 500
3 000
thermal.The annual market has been contracting since the peak year of 2008.The
0 0
2.41 GWth sold in 2012 are well above the 2007 sales (2 GWth / 2.88 mio m²) but 2003 2004 2005 2006 2007 2008 2009 2010 2011 2012
are a far cry from the 3.36 GWth (4.8 mio m²) reached in 2008. Newly installed (MWth) Total installed n-1 (MWth) Annual Capacity (m2)
Over the past ten years, there was a continuous steep uptrend in the growth
rate up to 2008; followed by a decline, steeper in the first two years (2009, 2010) Residential applications still represent the bulk of the solar thermal market. Never-
and then flattening out (2011, 2012). The variation in the newly installed capacity theless, large installations are increasing apace. Large size systems above 35 kWth
is illustrated with the blue line in the graph on the right. In spite of the decrease (50 m²) for commercial heating and cooling applications have shown a positive
recorded over the last four years, the annual market size has doubled, over the past development, but it is mainly for very large systems (above 350 kWth / 500 m²) that
decade at an average annual growth rate of 10%. Using the same comparison over the market has been moving rapidly. 2012 confirmed Denmark as the land of
the last five years (2007-2012), we can observe an absolute growth in the annual large solar district heating, with a total of 71.4 MWth (102 000 m²) installed, con-
sales of 20% and an average annual growth rate of 3.6%. tributing to a total installed capacity of 196 MWth (280 000 m²), solely in large solar
thermal plants, that account for 65% of the European total installed capacity in large
Solar Thermal Market in EU27 and Switzerland (glazed collectors)
systems. With regard to industrial process heat, several pilot projects have been
MWth m2 implemented, with other large ones in the pipeline.This is clearly a market segment
3 500 5 000 000 to watch closely in the coming years.
3 000
4 000 000
Traditional market segments are mostly affected by the downturn in several
2 500 of the largest European markets, including domestic hot water production for single
2 000
3 000 000 family dwellings; they are still feeling the effects of the slump in construction and
retrofitting caused by the 2008 financial crisis and consequent worsening
1 500 2 000 000 economic climate.
1 000
1 000 000
Despite a below expectation growth of the total installed capacity (the evolution
500 is shown by the grey bars in the graph referred to above, the lighter shade of grey
0 0 indicates the increment from the newly installed capacity in 2012), solar thermal
2002 2003 2004 2005 2006 2007 2008 2009 2010 2011 2012 plays an increasingly important role in the European energy strategy, namely through
Germany Next top 6 countries (AT, ES, FR, GR, IT, PL) Other 20 EU countries and Switzerland the National Renewable Energy Action Plans.The 28 GWth in operation generate
an estimated 20 TWhth of solar thermal energy while contributing to a saving of
2.5 Mt CO2. In terms of economic significance, the solar thermal sector reached a
combined turnover of 2.4 billion Euros in 2012, employing 32 000 people
(full time equivalent).
GERMANY NEWLY INSTALLED CAPACITY: 805 MWth ANNUAL EVOLUTION 2012/2011: -9.4%
Germany, the leader and main driver of the European market Solar Thermal Market in Germany
The European solar thermal colossus stumbled in 2012, after an 11% increase MWth Total and Newly Installed Capacity (glazed collectors) m2 (x1000)
in 2011. Germany represents almost 40% of the total installed capacity in Europe. 15 000 2 500
In terms of annual installed capacity, its share of the total market has decreased 13 500 2 250
slightly but still represents around one third of the total sales in EU Member States 12 000 2 000
and Switzerland. Hence, the performance of the German market has a huge influ- 10 500 1 750
ence on the whole European market. With a decrease of 9.4%, Germany has 9 000 1 500
contributed, together with other large markets, to this year’s negative results 7 500 1 250
in Europe. In 2012, Germany reached an annual installed capacity of 805 MWth
6 000 1 000
(1.15 mio m²), approximately 20% above the 2007 sales, before the financial crisis
4 500 750
and the peak year of 2008 (1 470 MWth / 2.1 mio m²).
3 000 500
Although it is not possible to single out only one main reason behind last year’s
decline, it is believed that the ongoing discussion about digressive Feed-in-Tariffs for 1 500 250
photovoltaics might leave the less informed consumers under the impression that 0 0
2003 2004 2005 2006 2007 2008 2009 2010 2011 2012
“solar is not worth an investment”.
Newly installed (MWth) Total installed n-1 (MWth) Annual Capacity (m2)
On the other hand, the discussion on new tax depreciation regulations for invest-
ments in energy efficiency technologies (e.g. solar) might have put off other investors.
In Germany, a strong macroeconomic performance and a buoyant building sector target for 2020 of 1.245 Mtoe equivalent, i.e. 20.2 GWth of installed capacity,
have not been mirrored in an increase in solar thermal sales. As system prices have Germany needs to install on average 1.4 GWth per annum (2 mio m²). And, in order
remained steady, installers were able to offer many installation options besides to reach the more ambitious target of 27.3 GWth set by the German solar thermal
solar thermal. industry (Solar Thermal Roadmap, BSW, 2012), the total installed per year should
The total installed capacity has reached 11.2 GWth (16 mio m²), representing an reach 2 GWth (2.85 mio m²). The total energy produced by solar thermal systems
increase of 7% on the German solar thermal park. In order to reach its NREAP in operation in Germany is now estimated at 6 TWhth (BMU, February 2013).
5
Solar Thermal Markets between 140 MWth and 350 MWth
The group of countries between 140 and 350 MWth (200 000
and 500 000m²) of annual newly installed capacity have
followed the same pattern as in 2011. Poland continued its kWth
Evolution of European largest markets
m2
impressive growth, Greece presents a resilient growth and 500 000
France remains stagnant. The other markets in this group, 350 000
450 000
Italy, Spain and Austria have experienced substantial declines. 300 000
400 000
250 000 350 000
For instance, Italy, previously by far the largest market of this group, suffered a
300 000
sizeable decrease over the last two years, with the 2012 market not reaching the 200 000
250 000
250 MWth threshold. On the other hand, the Polish market continued its steep growth
curve, with a 19% increase in comparison with the previous period.This means that 150 000 200 000
Poland is now close to becoming the second largest market in Europe, with 211.4 100 000
150 000
MWth (302 000 m²). In Spain, the market continues to contract (158 MWth), being 100 000
pulled down by the ongoing recession and now overtaken in market size by France 50 000 50 000
where the market remained at a similar level to that of 2011 (175 MWth). 0 0
Taking this group of countries as a whole, the newly installed capacity amounted 2002 2003 2004 2005 2006 2007 2008 2009 2010 2011 2012
to 1.1 GWth, a reduction of almost 5% in comparison with 2011. With reference Italy Spain Austria France Greece Poland
to the total installed capacity, the combined capacity represents 12.2 GWth, which
shows an increase of 7.5% in comparison with the previous period. Greece and
Austria remain the major markets in this group in terms of installed capacity in
operation, both in total as well as per capita. In these mature markets, the rate of This presents a new challenge for these countries in terms of increasing their heat
growth of the total installed capacity in operation (0.7% in Greece and 2.7% in production from solar thermal, in order to meet their 2020 target for energy
Austria) is now much lower than in other countries, for instance Poland (33%). production from renewable energy sources.
ITALY NEWLY INSTALLED CAPACITY: 231 MWth ANNUAL EVOLUTION 2012/2011: -15.4%
Solar Thermal Market in Italy Against all odds, with 231 MWth (330 000 m2), Italy remains the second largest EU
MWth Total and Newly Installed Capacity (glazed collectors) m2 (x1000)
3 000 500
market in terms of newly installed capacity. The economic stagnation, the “Monti”
government rigorous budgetary measures and related uncertainties surrounding
2 700 450
the future of solar thermal incentives, have all contributed to very pessimistic fore-
2 400 400
casts. Under these circumstances, a market decrease of 15% is a respectable outcome:
2 100 350 especially after the announcement, in November 2012, of the new incentive
1 800 300 mechanism for renewable heating systems and energy-efficient measures which all
1 500 250 give rise to a certain optimism for 2013.The 55% tax deduction mechanism, in place
1 200 200 since 2007, will remain unchanged until at least the end of June 2013. It seems very
900 150 likely that it will be extended until 31 December 2013 and modified to avoid
600 100 overlaps with other incentive mechanisms. At the end of 2012, the total installed
300 50 capacity amounted to 2.4 GWth, an increase of 10% compared with the previous
0 0
year, giving an estimated heat production of 2 TWhth.
2003 2004 2005 2006 2007 2008 2009 2010 2011 2012
2
Newly installed (MWth) Total installed n-1 (MWth) Annual Capacity (m )
POLAND NEWLY INSTALLED CAPACITY: 211 MWth ANNUAL EVOLUTION 2012/2011: 19.1%
Thanks to a strong support policy, the Polish market continued its steep growth, Solar Thermal Market in Poland
MWth Total and Newly Installed Capacity (glazed collectors) m2 (x1000)
becoming the third largest market in terms of newly installed capacity, after 500
3 000
Germany and Italy. In 2012, 211.4 MWth (302 000 m²) were installed in the Polish
2 700 450
market. It represents an increase of 19%, a modest increase compared with the
2 400 400
70% increase of the previous year, but still a significant one. The total installed capac-
ity amounts to 848 MWth (1.2 mio m²): an increase of 33% in comparison with 2 100 350
2011.The impressive growth over recent years must continue if Poland is to reach 1 800 300
its ambitious 2020 target of 10 GWth (14 mio m²). The size of the challenge is il- 1 500 250
lustrated by the energy production from solar thermal: the estimated total in 2012 1 200 200
was 0.5 TWhth, approximately 10% of the target set for 2020. 900 150
This success is due to several support programmes, the most relevant being the 600 100
programme of National Environmental Fund (NFSiGW) that allocated approxi- 300 50
mately 100 million Euros, over three years, to solar thermal installations. Consider- 0 0
ing that it will end at the beginning of 2014, Poland must clarify soon whether this 2003 2004 2005 2006 2007 2008 2009 2010 2011 2012
programme will be extended or even improved. Newly installed (MWth) Total installed n-1 (MWth) Annual Capacity (m2)
6
Solar Thermal Markets in Europe
Trends and Market Statistics 2012
FRANCE NEWLY INSTALLED CAPACITY: 175 MWth ANNUAL EVOLUTION 2012/2011: -0.6%
The solar thermal collector market totalled 174.7 MWth (249 500m²) in 2012, Solar Thermal Market in France
MWth Total and Newly Installed Capacity (glazed collectors) m2 (x1000)
remaining very close to the 2011 level (decrease of 0.6%) in metropolitan France.
3 000 500
After several successive years of decline, a relative stabilization can now be observed
2 700 450
in this market. This stabilization is the result of a strong growth in installations of
2 400 400
collective solar domestic hot water systems. Sales of domestic hot water heaters
only amounted to 25 900 units against 30 000 in 2011, a decrease of 14%. However, 2 100 350
sales of compact boilers, integrated with domestic solar water heaters, rose by 1 800 300
nearly 9%. These systems, which now represent around 22% of the domestic hot 1 500 250
water market, are mostly installed in new houses. As regards combi systems, the 1 200 200
market continues to decline, with a decrease of 19% compared with 2011. These 900 150
systems have not found a place in the new or existing buildings sector in France, 600 100
whereas this sector is well developed in Germany. The average collector area for 300 50
individual systems is stable at 3 kWth (4.2 m²) for DHWH and 7.6 kWth (10.9 m²) 0 0
for combi systems. Sales of collectors for collective or commercial 2003 2004 2005 2006 2007 2008 2009 2010 2011 2012
buildings continued to progress and now represent 87 MWth (124,600 m²) or 50% Newly installed (MWth) Total installed n-1 (MWth) Annual Capacity (m )2
of the total market for solar thermal collectors. The year 2012 marks an important
milestone in the evolution of the solar thermal market, as the collective hot water
systems sector is now larger than the sector for individual hot water systems.
The total installed capacity for France (metropolitan) is now slightly above 1.4 GWth
(2 mio m²), with an estimated annual heat production of 853 GWhth.
GREECE NEWLY INSTALLED CAPACITY: 170 MWth ANNUAL EVOLUTION 2012/2011: 5.7%
Solar Thermal Market in Greece
Total and Newly Installed Capacity (glazed collectors)
The Greek solar thermal market continued to grow in 2012. Following a decrease
MWth m2 (x1000)
3 000 500
in 2009, the market has been growing steadily in spite of the country’s current
difficult economic and financial conditions. The newly installed capacity grew by
2 700 450
5.7%, amounting to 170.1 MWth (243 000 m²). The new-build housing market has
2 400 400
reduced substantially; hence the growth is due mostly to replacement of electric
2 100 350 and oil heating systems, as energy costs have driven consumers towards the more
1 800 300 economical (and providing stable energy costs) solar thermal solution. In terms of
1 500 250 total installed capacity, Greece now counts 2.9 GWth (4.1 mio m²), representing an
1 200 200 increase of 1%. Greece has the second largest total installed capacity, after the
900 150 German giant and is almost level with Austria. In fact, Greece is in a unique situation
600 100 in this regard. In the early 1990s, the annual installed capacity was already similar to
300 50 current levels. Bearing in mind that the average lifetime of a system considered for
0 0
statistical purposes is 20 years, it means that in the Greek market the total installed
2003 2004 2005 2006 2007 2008 2009 2010 2011 2012 capacity has stabilized over recent years. This is a situation currently particular to
Newly installed (MWth) Total installed n-1 (MWth) 2
Annual Capacity (m ) Greece but which will become applicable to other countries in the future.Therefore,
it should be better understood and the rate of replacement of old systems studied
in depth.
SPAIN NEWLY INSTALLED CAPACITY: 158 MWth ANNUAL EVOLUTION 2012/2011: -15.5%
The Spanish market has been contracting since the peak year of 2008.The market Solar Thermal Market in Spain
MWth Total and Newly Installed Capacity (glazed collectors) m2 (x1000)
has halved during these four consecutive years of decline, reaching a six year low
3 000 500
at 158 MWth (225 683 m²).This corresponds to a negative annual variation of 15.5%.
2 700 450
The Spanish solar thermal market, which for many years was the third largest in
2 400 400
Europe and one of the most promising, is now only ranked sixth in the European
solar thermal market. The sales relied, by an estimated 85%, on the solar thermal 2 100 350
obligation for the new build sector now frozen.The Spanish Government will soon 1 800 300
launch a support mechanism for renovation work which should only concern about 1 500 250
25 000 households, not necessarily including solar thermal. At regional level, only 1 200 200
Andalucia maintains support schemes for solar thermal. Other options for solar 900 150
heat would be industrial applications. A support scheme was approved, but then 600 100
put on hold as a result of the austerity measures. Moreover, subsidies for Spanish 300 50
industries are facing difficult times, namely with regard to access to credit, which 0
0
limits strongly the opportunities for new investments. By the end of 2012, the in- 2003 2004 2005 2006 2007 2008 2009 2010 2011 2012
stalled capacity in Spain totalled 1.8 GWth, an increase of 9% over a one year period. Newly installed (MWth) Total installed n-1 (MWth) Annual Capacity (m2)
This installed capacity represents an estimated 1.8 TWhth of heat generation, only
17% of the 2020 target for solar thermal set by the Spanish government.
7
AUSTRIA NEWLY INSTALLED CAPACITY: 144 MWth ANNUAL EVOLUTION 2012/2011: -15.2%
Solar Thermal Market in Austria The Austrian market is facing tough times, with sales contracting for the third
MWth Total and Newly Installed Capacity (glazed collectors) m2 (x1000)
consecutive year.
3 000 500
In 2012, the decline corresponded to 15% in comparison with the previous year:
2 700 450
the newly installed capacity amounted to 144.5 MWth (206 390 m²). One of the
2 400 400
main reasons given to explain this contraction is the attraction of solar photovolta-
2 100 350 ics investment for consumers, competing directly with solar heating installations in
1 800 300 this traditional market. Austria remains one of the most important markets in
1 500 250 Europe, still being the largest market per capita in continental Europe and the third
1 200 200 in total installed capacity: 2.9 GWth or 4.1 mio m² by the end of 2012 (3% increase
900 150 with reference to the previous year). This installed capacity provided an estimated
600 100 heat supply of 1.8 TWhth. Austria has now reached 56% of the 2020 target
300 50 foreseen in the National Renewable Energy Action Plan. This is a high percentage
0
compared with other countries; however, taking into account the maturity of the
0
2003 2004 2005 2006 2007 2008 2009 2010 2011 2012 Austrian market and the decline in sales over recent years, national and regional
Newly installed (MWth) Total installed n-1 (MWth) 2
Annual Capacity (m ) authorities will have to up their game to reach their national target.
Solar Thermal Markets between 35 and 140 MWth
Solar thermal markets below 150 MWth (200 000m2)
Demark and Belgium, both with several years of growth, kWth m2
are becoming beacons of hope in an otherwise contracting 140 000 200 000
European market. 180 000
120 000
160 000
The Danish growth is due to a dramatic increase in a particular market segment: 100 000 140 000
solar district heating.This segment alone is enough to put Denmark in the top ten 120 000
80 000
of the European solar thermal markets. The Belgian growth, on the other hand, is
100 000
based on traditional segments, sustained by a lasting support policy, particularly in 60 000
80 000
Flanders.The other markets between 35 and 140 MWth (50 000 and 200 000m²)
60 000
of newly installed capacity felt the negative impact of different support policies: in 40 000
Switzerland creating expectation about photovoltaics, putting on hold investments 20 000
40 000
in solar thermal; while Portugal and the United Kingdom are examples of how 20 000
poorly implemented support schemes can have a detrimental effect on the market. 0 0
2002 2003 2004 2005 2006 2007 2008 2009 2010 2011 2012
Two other countries, not quite above 35 MWth, but worth mentioning are Hungary
and Czech Republic, also as examples of the negative effect of stop-and-go meas- Portugal Switzerland United Kingdom Denmark Belgium
ures. The Hungarian market more than doubled in 2012 based on the interesting
support scheme put in place last year for individual systems. Nevertheless, this Overall, for the group of countries between 35 and 140 MWth of newly installed
support is likely to be discontinued in 2013, with a strong reduction expected in capacity in 2012 (Belgium, Denmark, Portugal, Switzerland and United Kingdom),
the market. The Czech market reached its peak year in 2010 due to the positive the market has contracted by 3% in 2012. In terms of total installed capacity, these
effects of a strong support scheme. Since then it has been contracting, being close countries now add up to a combined total of 2.6 GWth in operation, which repre-
to the 2009 sales level. Hopefully, this might change over the next few years with sented an increase of almost 12% in comparison with the previous period.
the new programme being prepared.
SWITZERLAND NEWLY INSTALLED CAPACITY: 99 MWth ANNUAL EVOLUTION 2012/2011: 3.0%
The Swiss market is facing stagnation for the third year in a row. In 2012 the newly Solar Thermal Market in Switzerland
MWth Total and Newly Installed Capacity (glazed collectors) m2 (x1000)
installed capacity totalled 99.4 MWth (142 000 m²), i.e. a growth of 3.1%. The main 1000 200
contributor to this stagnation is considered to be the general anticipation about
the support for PV installations, reflected in the large waiting list for installing new 800 160
photovoltaic systems with federal support (FiT). While flat plate collectors still
represent 88% of the market, the sales of evacuated tube collectors have doubled 600 120
in 2012, in part related to the increasing aesthetical potential explored by architects.
400 80
This market has shown a strong growth in the total installed capacity, reaching
0.8 GWth (1.1 mio m²), an increase of 15.3% over the previous year. 200 40
0 0
2003 2004 2005 2006 2007 2008 2009 2010 2011 2012
2
Newly installed (MWth) Total installed n-1 (MWth) Annual Capacity (m )
8
Solar Thermal Markets in Europe
Trends and Market Statistics 2012
DENMARK NEWLY INSTALLED CAPACITY: 79 MWth ANNUAL EVOLUTION 2012/2011: 81.1%
Solar Thermal Market in Denmark
The Danish market grew by 81% in 2012.This growth was already anticipated, as it MWth Total and Newly Installed Capacity (glazed collectors) m2 (x1000)
results from large solar district heating projects that had been approved but not yet 1000 200
installed.The newly installed capacity amounted to 79 MWth (113 000 m²), 90% of
which referred to very large installations (70 MWth / 102 000 m²).There are other 800 160
large projects being prepared and it is expected that in 2013 growth will continue.
600 120
The total installed capacity in Denmark amounted to 478 MWth (682 345m²) by
the end of 2012, an increase of 17% over the previous period. Out of this, ap- 400 80
proximately 193MWth correspond to large solar thermal systems (above 350 kWth),
which represent also 65% of the European total installed capacity in large systems. 200 40
0 0
2003 2004 2005 2006 2007 2008 2009 2010 2011 2012
Newly installed (MWth) Total installed n-1 (MWth) Annual Capacity (m2)
PORTUGAL NEWLY INSTALLED CAPACITY: 63 MWth ANNUAL EVOLUTION 2012/2011: -28.8%
Solar Thermal Market in Portugal Portugal experienced a strong decrease over the past two years, following the end
MWth Total and Newly Installed Capacity (glazed collectors) m2 (x1000)
1000 200 of the large support scheme “Medida Solar Térmico” as its effect was felt in 2009
and 2010. In fact, the market is now almost down to the same level as that of 2008.
800 160 In the meantime, many jobs were created and later disappeared, illustrating the
negative effects of stop-and-go measures. In 2012, the market contracted to
600 120 63 MWth (90 612 m²), which represented a variation of – 29%. By the end of 2012,
the total installed capacity was 600 MWth (856 867m²), an increase of almost 10%
400 80
on the previous year.
200 40
0 0
2003 2004 2005 2006 2007 2008 2009 2010 2011 2012
2
Newly installed (MWth) Total installed n-1 (MWth) Annual Capacity (m )
UNITED KINGDOM NEWLY INSTALLED CAPACITY: 41 MWth ANNUAL EVOLUTION 2012/2011: -35.4%
The uncertainty regarding the Renewable Heat Incentive (RHI) scheme for domes- Solar Thermal Market in the UK
MWth Total and Newly Installed Capacity (glazed collectors) m2 (x1000)
tic applications continued in 2012, with an obvious negative impact on the British 1000 200
solar thermal market. In 2012 this market contracted to 41.5 MWth (59 275 m²),
which represents a variation of -35%. Even if the RHI for commercial applications 800 160
is in place, this support scheme has mostly benefitted biomass applications, with a
residual number of applications for either solar thermal or heat pump systems. 600 120
Hopefully, the recently announced increase in the Renewable Heat Premium
400 80
Payments for solar heating to £600 (from £300) will improve the situation. The
total installed capacity in the United Kingdom, by the end of 2012, was 0.5 GWth 200 40
(709 673 m²), corresponding to an increase of 8% over the previous period.
0 0
2003 2004 2005 2006 2007 2008 2009 2010 2011 2012
Newly installed (MWth) Total installed n-1 (MWth) Annual Capacity (m2)
BELGIUM NEWLY INSTALLED CAPACITY: 43 MWth ANNUAL EVOLUTION 2012/2011: 36.3%
Solar Thermal Market in Belgium With a third consecutive positive year, Belgium is becoming one of the good
MWth Total and Newly Installed Capacity (glazed collectors) m2 (x1000)
1000 200 examples of growth in the European market. In 2012, the market grew by 36%
compared with 2011, resulting in 43.4 MWth (62 000 m²) of newly installed solar
800 160 collectors. In spite of the crisis and stagnation in the construction sector, the solar
thermal market and energy efficiency renovations are sustained by several incentive
600 120 schemes put in place by the three regions. The strongest support is provided by
Flanders, which naturally represents 70% of the Belgian market. In this region most
400 80
systems are installed on single-family homes, whereas the market in Wallonia is
200 40 dominated by systems in multi dwellings. Overall the total installed capacity in Belgium
is still small, reaching 269 MWth (384 533 m² by the end of 2012).
0 0
2003 2004 2005 2006 2007 2008 2009 2010 2011 2012
2
Newly installed (MWth) Total installed n-1 (MWth) Annual Capacity (m )
9
Solar Thermal Markets at a Glance
Data for 2012
Key > 250 kWth
50-250 kWth
25-50 kWth
EU27+ Country name
-6.4% Annual evolution 2011/2012
15-25 kWth Sweden
28 346 MWth Cumulative installed capacity in operation (MWth) -45.9%
55.6 kWth kWth per 1000 capita 242 MWth
< 15 kWth
25.5 kWth
Denmark
81.1%
478 MWth
85.6 kWth
Ireland UK
-54.4% -35.4%
190 MWth 497 MWth
41.4 kWth 7.9 kWth
Netherlands
28.7%
356 MWth
21.3 kWth Polan
Germany 19.1
-9.4% 848
11 234 MWth 22.0
Belgium
36.3% 137.3 kWth
269 MWth
24.3 kWth
Luxembourg*
28 MWth Czech Republic
53.1 kWth -24%
301 MWth
28.6 kWth
Austria
-15.2%
2 876 MWth
France Switzerland 340.6 kWth Hun
-0.6% 3% 150
1 452 MWth 802 MWth Slovenia 154
22.9 kWth 100.8 kWth 37.5% 15.5
131 MWth
63.6 kWth
Italy
-15.4%
2 356 MWth
38.7 kWth
Portugal Spain
-28.8% -15.5%
600 MWth 1 811 MWth
56.9 kWth 39.2 kWth
Malta*
40 MWth
96.9 kWthFinland*
26 MWth
4.8 kWth
Shares of the European Solar Thermal Market (Newly Installed Capacity)
Others
DE 34%
Estonia* UK IT 10%
BE
PT PL 9%
5 MWth
3.4 kWth DK DE FR 7%
CH GR 7%
ES 7%
AT AT 6%
Latvia*
CH 4%
3 MWth ES DK 3%
1.4 kWth
PT 3%
GR BE 2%
IT
UK 2%
FR
PL OTHERS 8%
Lithuania*
4 MWth
1.4 kWth
kWth Solar Thermal Capacity in Operation (per 1000 Capita) m2
700
900
600 800
500 700
nd 600
400
% 500
MWth 300 400
kWth
200 300
200
100 100
0 0
CY
AT
GR
DE
CH
MT
DK
SI
PT
EU27+
LU
IE
ES
IT
CZ
SE
BE
Slovakia
-67.4%
103 MWth
19.0 kWth
kWth Development of Main Markets - Newly Installed Capacity per 1000 Capita m2
30 40
25 35
30
20
gary 25
% 15 20
MWth
5 kWth Romania* 10 15
10
77 MWth 5
5
3.6 kWth
0 0
2002 2003 2004 2005 2006 2007 2008 2009 2010 2011 2012
Bulgaria Austria Germany Greece Spain Italy Poland France EU27+
-25.9%
85 MWth
11.7 kWth
Note:
The data are usually provided by national solar thermal associations or other national sources.
Countries marked with an * are ESTIF estimations and are therefore not sufficiently accurate
to set a percentage variation in the market.
Greece
5.7%
2 883 MWth
255.4 kWth
Cyprus
-15.9%
495 MWth
574.8 kWthPaving the way towards sustainable heating and cooling in Europe
T European Solar Thermal Technology
The The ESTTP is now following up on these Strategic Research Priorities, promoting
P
Panel (ESTTP) recently published a new them to the most relevant stakeholders in preparation of the Solar Heating and
Cooling Technology Roadmap.This Roadmap defines the main actions required by
d
document describing the potential
industry, research and public authorities to achieve the technological solutions that
o
of solar thermal technologies and the can address some of the main societal challenges, such as providing clean, sustain-
m
most important R&D priorities that can able and affordable thermal comfort.
fa
facilitate the large deployment of solar
tthermal in multiple market segments. All RHC-Platform members can join the European Solar Thermal Technology
Panel and contribute to the development of the Solar Heating and Cooling
W the contribution from experts in the research,
With Technology Roadmap. More information at www.rhc-platform.org.
iindustry and public sectors across Europe, the ESTTP
prepared this publication to provide solutions on how
p
solar thermal can contribut
contribute to the EU’s goal of achieving a 80 to 95 % reduction
200% 100
in greenhouse gas emissions by 2050. 195%
Collector production cost development Index
180%
Total installed collector capacity in GWth
A multi-approach strategy, including the following requirements, is being developed: 160% 156% 80
• a considerable increase in the number of annually installed solar thermal systems; 140%
125%
• an increased solar fraction of systems per building; 120% 60
• a systematic development of market segments with low solar thermal 100% 100%
Learning curve factor: 23%
penetration, and 80% (cost reduction by doubling the 76% 40
• a strong support for solar thermal applications in the R&D and pilot phase 60% total installed collector capacity)
57%
by increasing both the R&D effort and the number of pilot plants. 40% 20
20%
According to this document, those requirements can be met with technological
0%
achievements that: 1995 2000 2005 2010 2015 2020 0
• significantly reduce the costs of solar thermal energy for different applications Total installed capacity EU27 Relative collector production costs, 2010 = 100%
and for high solar fractions (right axis, in GWth, prediction = bright) (left axis, prediction = dashed)
• ensure a high system performance and reliability of solar thermal systems,
• allow solar thermal to play a more important role in medium temperature
Figure 1: Collector production costs and market evolution from 1995 until 2020
applications; Source: Strategic Research Priorities for Solar Thermal Technology,
• boost the combination of solar thermal systems with other technologies European Technology Platform on Renewable Heating and Cooling
into hybrid systems, and
• improve the production technology for solar thermal components and systems.
Strategic Research and Innovation Agenda
This Strategic Research and Innovation Agenda (SRIA) has This document also explains how to prioritisee
been prepared by the RHC-Platform providing stakeholders the allocation of resources for R&D under ‘Horizon 2020’,, Strategic Research and
Innovation Agenda for
Renewable Heating & Cooling
the successor to the seventh framework programme forr
with a structured and comprehensive view of the strategic
European Technology Platform on
Renewable Heating and Cooling
research and development.The total volume of resourcess
research priorities to enable an increasing share of renewable required to implement the RHC-SRIA until 2020 is
heating and cooling. estimated at around 4 billion Euros, approximately 60%
of which is expected to come from the European
The SRIA identifies the R&D activities and investments needed to make RHC industry. It is anticipated that 3 out of 5 Euros will be spent
technologies cost-competitive in all market segments (residential, non-residential, by the private sector, if the European Commission as well
and industrial) in the short term (by 2020) or in the medium term (by 2030). as Member States spend 1 Euro each in addition. Renewable
Heating & Coo
European Technology Platform
Join us and shape the future of RHC in Europe!
Membership is free! Join the RHC-Platform today and become part of the
community!
100% = 7.6 bn.€ 100% = 1,180 Mtoe
100% RHC 1% Download the publications here:
RHC 14%
Other H&C 6%
www.rhc-platform.org
80%
Other H&C 33%
60% Euratom 69%
40% Electricity 21%
20% RES electricity 14%
Other energy R&D Transport 32%
(non-nuclear) 10%
0%
Funding for energy research Final energy consumption
under FP7 (2007-2013) in EU in 2010
Figure 2: Funding for energy research under FP7 and final energy consumption by sector
Source: Strategic Research and Innovation Agenda for Renewable Heating & Cooling,
European Technology Platform on Renewable Heating and Cooling
12Solar Thermal Markets in Europe
Trends and Market Statistics 2012
Market size in terms of Solar Thermal Capacity (KWth)
and in terms of Collector Area (m2)
Market (=Newly Installed) In Operation2
2010 2011 2012 Annual End of 2012 Annual
Evolution of Evolution
the Market of the Total
Installed
Capacity
Total Total Flat Vacuum Total Total Total Total Total
Glazed Glazed Plate Collectors Glazed Glazed Glazed Glazed Glazed
m2 m2 m2 m2 m2 kW(th) % m2 kW(th) %
Austria 279 898 243 285 200 800 5 590 206 390 144 473 -15.2% 4 108 338 2 875 837 2.7%
Belgium 42 500 45 500 50 500 11 500 62 000 43 400 36.3% 384 533 269 173 18.9%
Bulgaria 8 400 10 800 7 400 600 8 000 5 600 -25.9% 122 100 85 470 6.1%
Cyprus 30 713 28 437 22 373 1 544 23 917 16 742 -15.9% 707 776 495 443 -0.8%
Czech Republic 91 717 65 800 37 000 13 000 50 000 35 000 -24.0% 427 327 299 129 12.8%
Denmark 64 651 62 401 112 500 500 113 000 79 100 81.1% 682 345 477 642 16.9%
Estonia* 500 1 800 900 900 1 800 1 260 - 6 520 4 564 -
Finland* 3 700 4 000 3 000 1 000 4 000 2 800 - 36 723 25 706 -
France 256 000 251 000 240 750 8 750 249 500 174 650 -0.6% 2 074 400 1 452 080 13.7%
Germany 1 150 000 1 270 000 1 036 000 114 000 1 150 000 805 000 -9.4% 16 049 000 11 234 300 7.0%
Greece 214 000 230 000 241 500 1 500 243 000 170 100 5.7% 4 119 200 2 883 440 0.8%
Hungary 21 000 20 000 35 000 15 000 50 000 35 000 150% 219 814 153 870 29.4%
Ireland 52 966 59 349 18 803 8 284 27 087 18 961 -54.4% 270 769 189 538 11.1%
Italy 490 000 390 000 287 900 42 100 330 000 231 000 -15.4% 3 365 730 2 356 011 10.4%
Latvia* 200 1 800 150 150 300 210 - 4 040 2 828 -
Lithuania* 200 1 800 600 1 200 1 800 1 260 - 6 000 4 200 -
Luxemburg* 4 500 4 500 3 250 900 4 150 2 905 - 39 800 27 860 -
Malta* 5 000 5 980 5 500 480 5 980 4 186 - 57 820 40 474 -
Netherlands 40 834 33 000 42 470 0 42 470 29 729 28.7% 509 065 356 346 7.3%
Poland 145 906 253 500 216 000 86 000 302 000 211 400 19.1% 1 211 390 847 973 33.2%
Portugal 182 271 127 198 90 121 491 90 612 63 428 -28.8% 856 867 599 807 9.7%
Romania 15 500 15 500 8 500 7 000 15 500 10 850 0% 110 700 77 490 5.2%
Slovakia 15 000 23 000 6 500 1 000 7 500 5 250 -67.4% 147 000 102 900 3.3%
Slovenia 11 000 12 000 13 500 3 000 16 500 11 550 37.5% 186 800 130 760 6.6%
Spain 336 800 266 979 213 060 12 623 225 683 157 978 -15.5% 2 587 162 1 811 013 9.2%
Sweden 20 699 20 807 8 251 3 006 11 257 7 880 -45.9% 345 731 242 012 2.6%
Switzerland 144 772 137 863 125 000 17 000 142 000 99 400 3.0% 1 145 431 801 802 12.1%
United Kingdom 105 200 91 778 47 893 11 382 59 275 41 493 -35.4% 709 673 496 771 8.0%
EU27 + Switzerland 3 733 927 3 678 077 - - 3 443 721 2 410 605 -6.4% 40 494 094 28 345 866 7.7%
ESTIF would like to thank the solar thermal associations and other national sources for providing the data for these statistics, in particular:
AEE INTEC, Association pour Techniques Thermiques de Belgique (ATTB/Belsolar), Association of Producers of Ecological Energy (APEE), Cyprus Institute of Energy,
Czech Ministry of Industry and Trade, Danish Solar Heating Association (DSF), Syndicat des professionnels de l’énergie solaire (ENERPLAN)/UNICLIMA, Bundesverband
Solarwirtschaft (BSW), Greek Solar Industry Association (EBHE), Solar Thermal Association of Hungarian Building Engineers (MÉGNAP), Sustainable Energy Authority
of Ireland (SEIA), Associazione Italiana Solare Termico (Assolterm), Holland Solar, EC BREC Institute for Renewable Energy (IEO), Associação Portuguesa da Indústria
Solar (APISOLAR), University of Ljubljana, Asociación Solar de la Industria Térmica (ASIT), Svensk solenergi; CHALMERS University of Technology, SWISSOLAR, Solar
Trade Association (STA).
Figures for countries marked with an * are ESTIF estimations and, therefore, these are not sufficiently accurate to be used for percent change calculations in these markets.
1) The relation between collector area and capacity is 1m² = 0.7kWth (kilowatt-thermal)
2) Capacity “in operation” refers to the solar thermal capacity built in the past and deemed to be still in use. ESTIF assumes a 20 year product life for all systems installed
since 1990. Most products today would last considerably longer, but they often cease to be used earlier, e.g. because the building was demolished, or there has been
a change of building use.
3) The figures presented are the latest available information at the end of May 2013. In some cases there may be later updates, which mean that figures for one given
year may be revised subsequently.
4) The figures shown here relate to Metropolitan France (mainland). As a reference, in 2010 the overseas departments amounted to 49 MWth (70,000 m²).
13Country Focus:
Croatia
Croatia: the 28th member of the European Union from 1 July 2013
Croatia has a population of 4.4 million, with a low density
(78.5 inhabitants per km²), and a GDP per capita of 10 300
Euros. The country is quite diverse, from plains, lakes and
rolling hills in the north and northeast with continental climate
conditions to rocky coastlines on the Adriatic Sea, including
over a thousand islands and islets, with Mediterranean climate.
This country has a long solar thermal tradition, from the times of former Yugoslavia
when, in the1970s and 1980s, this technology was already quite well developed
compared with the rest of Europe.
Croatia offers a great potential for solar heating and cooling. Energy costs and
climate conditions make solar thermal an interesting option. It could be the answer
to the energy challenge faced by the high number of inhabited islands (47), with a
combined population of 110 000, and where during Spring and Summer the demand
for domestic hot water rises due to the number of secondary homes and the
tourism infrastructure: an important opportunity for solar thermal applications!
Solar Thermal Market in Croatia Total and Newly Installed Capacity
kWth m2
100 000 15 000 Figure 3: Annual sum of global irradiation on a horizontal plane (Source EIHP)
90 000 13 500
80 000 12 000 The annual installed capacity reached a peak of 10 200 kWth (14 500 m²) in 2011.
70 000 10 500
In 2012 preliminary data indicates similar annual installed capacity between 9.1 and
60 000 9 000
10.1 MWth (13 000 and 14 500 m2).
The total installed capacity by the end of 2012 is approximately 84 MWth
50 000 7 500
(120 000 m²), with an increase of the order of 12 % compared to the end of the
40 000 6 000
previous year.
30 000 4 500
The most widely installed systems include flat plate collectors with selective
20 000 3 000 absorber, close loop systems with pump, heat exchanger, integrated in heat storage
10 000 1 500 and antifreeze protection.There has been a noticeable increase in the use of vacuum
0 0 tube collectors, mainly in systems requiring higher temperatures and all-year round
2003 2004 2005 2006 2007 2008 2009 2010 2011 2012
availability. This type of collector should represent around 12% of the market.
Newly installed (MWth) Total installed n-1 (MWth) Annual Capacity (m2)
Despite the seasonal DHW demand, termosyphon systems are not as common
as could be expected.
The lack of support measures is one of the main hurdles in the faster development of the solar thermal market in Croatia, as public support has been rather limited so
far (more information on support schemes on the next page). However, some flanking measures have been put in place, such as a broad awareness raising campaign
launched in 2009 and the situation regarding the availability of qualified installers has improved considerably over recent years. The arrival on the market of interna-
tional companies and the impact of support schemes in some counties has resulted in an increase in the number of qualified installers. Also, on the educational front,
solar thermal is a feature of the curriculum for undergraduate, graduate and post-graduate courses.
CROATIA
Population: 4 398 150 Number of islands (inhabited): 1 185 (47)
Density: 78.5/km2 GDP per capita: 10 300 Euros
Area: 56 594 km2 Global annual irradiation: from 1.15 to 1.65 MWh/m2
14Solar Thermal Markets in Europe
Trends and Market Statistics 2012
Support schemes
There are two support schemes operating in parallel, applicable to solar thermal, heat pumps and off-grid solar photovoltaics. One of the schemes is focused on the
residential sector, offering direct subsidies to the acquisition of small RES systems. Another scheme is targeted at commercial applications, more specifically on the tourism
sector, comprising interest-free loans. FZOEU, the Croatian Environmental Protection and Energy Efficiency Fund, administers both schemes which, in their current form,
were launched in December 2012. The support does not apply to the whole country, but is only in operation in those counties that have applied for it (currently avail-
able in eight counties).
Residential Commercial
The scheme grants households up to 40% of the solar water heater investment, The target group for the commercial support scheme is the tourism sector. It is
capped at approximately 1 580 Euros. The support scheme was initiated at available to both private and public entities (maximum of only two projects per
Regional level, in Northwest Croatia by the Regional Energy Agency (REGEA). entity). It consists of interest-free loans amounting to 40% of the total investment
The success of the scheme contributed to its replication at national level. Regions in the system. The support can go up to approximately 185 000 Euros, with a
and municipalities are important partners, as they manage the entire application repayment period limited to a maximum of seven years.
process and control its implementation and co-fund the scheme (at least 10%).
The demand was very high in 2013, exceeding the programme budget(1).
More information about these support schemes at solarthermalworld.org. Country report and factsheet available on the Trans-solar project website. Text developed
with the support of EIHP - Energetski Institut Hrvoje Pozar.
(1) Croatia: Demand for Residential Subsidy Scheme Exceeds Budget, 2/04/2013, solarthermalworld.org
The Solar Keymark
CEN Keymark Scheme
The Quality Label for Solar Thermal
Benefits:
• Simple test procedure
• One test valid across Europe Number of Solar Keymark licences
• Licensed products 1 800
• Access to subsidies 1 600
• Reliable quality and performance 1 400
1 200
The Solar Keymark is a voluntary third-party certification mark for solar 1 000
thermal products, showing that a product conforms to relevant European 800
standards and fulfils additional requirements. It is used in Europe and 600
increasingly recognized worldwide. 400
200
It was developed by the European Solar Thermal Industry Federation
(ESTIF) and CEN (European Committee for Standardisation) in close 0
Jan 2003
Jan 2004
Jan 2005
Jan 2006
Jan 2007
Jan 2008
Jan 2009
Jan 2010
Jan 2011
Jan 2012
Jan 2013
co-operation with leading European test labs and with the support of the
European Commission. It is the European quality label for solar thermal
products, aiming to reduce trade barriers and promote the use of high
quality solar thermal products in the European market and beyond.
15Energy Labelling and...
The entry into force 4th quarter
of the regulations begins
with the publication in the
2013
Official Journal of the
European Union
ESTIF continues to provide input to the Commission and
other Institutions (Council, Parliament) until publication,
in order to secure the best possible regulations for the solar
thermal industry.
Publication
Latest very important item is the ESTIF input regarding
the methodology to measure the performance of solar
water heaters, which must be amended.
Industry and public authorities
have 2 years to prepare the
implementation
ESTIF supports the industry in the preparation of
the labelling during the so-called “transition period”.
ESTIF, together with the Solar Keymark Network,
will prepare the revised harmonised standards as required
2 years by the Commission as part of the energy labelling.
ESTIF will also issue guidelines and organise training
on the implementation of the labelling.
Package label up to A+++ 4th quarter
and product label up to A
(water heating and A++
2015
(space heating) become
ESTIF promotes the labelling of solar heat and supports the
mandatory.
industry for the implementation, once the labelling is mandatory.
ESTIF, together with the Solar Keymark Network, is designing
tools and materials to support and facilitate the administration
Labelling of the “package label” for solar thermal experts.
ESTIF promotes the package label as a reference for renewable
and energy efficiency incentive schemes.
16Solar Thermal Markets in Europe
Trends and Market Statistics 2012
Solar Thermal
WHEN? WHAT?
Considering the status of the legislative process, we foresee a Two types of solar systems will be subject to the mandatory
publication of the regulations in the official journal in September energy labelling:
2013; mandatory labelling would then begin in September 2015.
Packages including solar will constitute the only water heating Package Label, A+++ possibly from 2015 onwards: Custom-built
technology able to reach A+++. Regarding factory-made solar solar systems - collector(s), storage tank, pump in the loop - only
water heaters, the label will go up to A and then A+ will be and exclusively if sold with heater(s), boiler(s) or heat pump(s)
introduced two years later, i.e. in September 2017. – will be labelled as packages (solar + heater) for water heating
and/or for combi systems (space and water heating).
Product Label, A in 2015, A+ in 2017: Factory-made systems in-
corporating an electric immersion heater and/or other immersed
WHO? non-solar heater and placed on the market as one unit will be
labelled as product for water heating only.
The product and package labelling obligations apply to the whole
supply chain, from those “placing on the market”, to those “selling”
and “putting into service” heating devices below 70 kw rated heat
output. The principle being that the product/package must bear a
label at the latest stage when offered for purchase to the end
consumer. HOW?
Only for the “package label”, the stage and responsibility for the Manufacturers of heaters, storage tanks and solar devices will test
labelling will vary according to the way the “package” is bundled. the performance of their products using methods based on
current standards in order to provide product information (fiche
Manufacturers/suppliers of factory-made systems will need to required for the labelling). However, all existing standards will be
label their water heaters with the product label. revised and harmonised in the coming years as part of the energy
labelling implementation process. For the labelling, the principle of
Manufacturers of storage tanks below 500 litres will also need to self-certification applies, implying that no control from a third party
label the tanks they put on the market as products. is required.
Manufacturers of heaters AND solar devices – collector(s) storage The calculation for the “package label” will be done using a calcu-
tanks - will have to label the “packages” they place on the market. lation fiche and information extracted from the product fiches
for the different products.
Manufactures of solar devices - collector(s), storage tanks and
possibly pumps - will need to provide product information and In any case, the installer offering the package has the final respon-
fiches. sibility for the “package labelling” either provided by the supplier
or calculated by him.
Installers/resellers/distributors who bundle “packages” to be
offered for sale to consumers must ensure that these packages For more information contact directly ESTIF:
bear an energy label either provided by the supplier and/or issue xavier.noyon@estif.org
the label themselves on the basis of the products’ fiches.
Packages of water heater
g
water heatin
indicating the
andsolar device
e of water heater
for a packag
Figure 1: Fiche of the package offered
and solar device
ncy
energy efficie
Fiche for
calculation
Energy
label
EN
59
EN
17You can also read


