METRO OFFICE Second Half 2019 - Research & Forecast Report - Colliers International
←
→
Page content transcription
If your browser does not render page correctly, please read the page content below
Research &
Forecast Report

                   Accelerating success.

METRO
OFFICE
Second Half 2019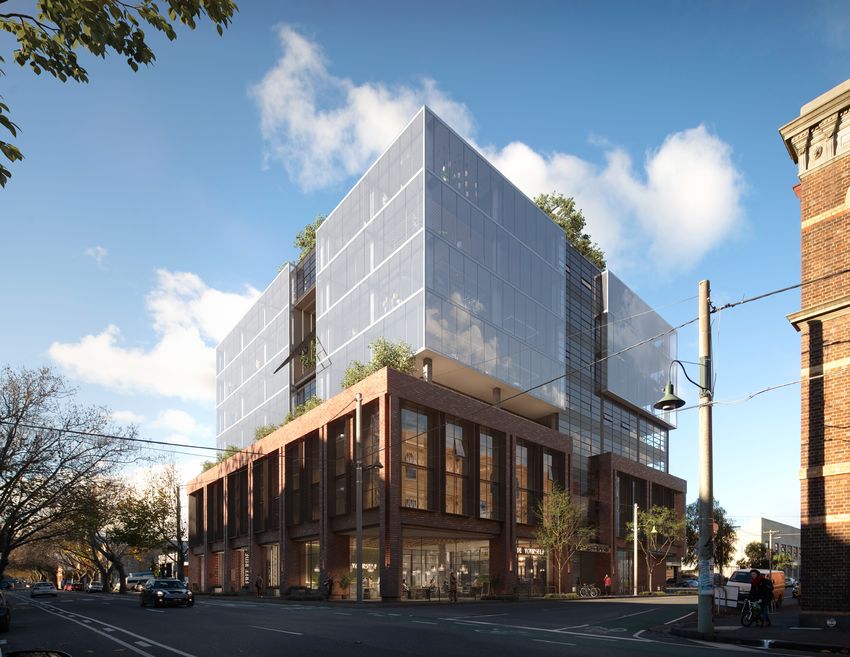
Accelerating success.

                                             MAXIMISE THE
                                             POTENTIAL OF
                                             DATA

  IN-DEPTH DATA                                   At the forefront of the
                                                  real estate industry, we
Granular datasets covering historical
                                                  understand the demand
 and forecast data with over 2,000
   datapoints updated quarterly.                  for reliable and accurate
                                                  data is more prevalent
                                                  than ever.
                                                  Our enterprising
                                                  technology, Colliers Edge,
                                                  offers comprehensive
    DETAILED                                      property data that enables
  TRANSACTIONS                                    you to delve deeper into
                                                  the Australian property
       Individual reporting of
                                                  market, using data to
         major transactions.
                                                  become more informed
                                                  and deliver enduring value.
                                                  Colliers Edge is a data
                                                  subscription service
                                                  developed by our in-
        INSIGHTS                                  house research experts,
  Our experienced research team                   who collaborate with
 will help you understand quarterly               our National network
changes, as well as broader themes                of operators to drive
  behind each sector and market.                  exceptional results.

             Joanne Henderson
             Director | Research
             +61 410 391 093
             joanne.henderson@colliers.com
             colliers.com.au/colliersedge
CONTENTS

     Snapshot | Metro Office                     4

     National Overview                           5

     Sydney                                      6

     Melbourne                                  10

     Brisbane                                   14

     Adelaide                                   16

     Perth                                      18

     Newcastle                                 20

     Gold Coast                                22

     Our Expertise                             24

                               Accelerating success.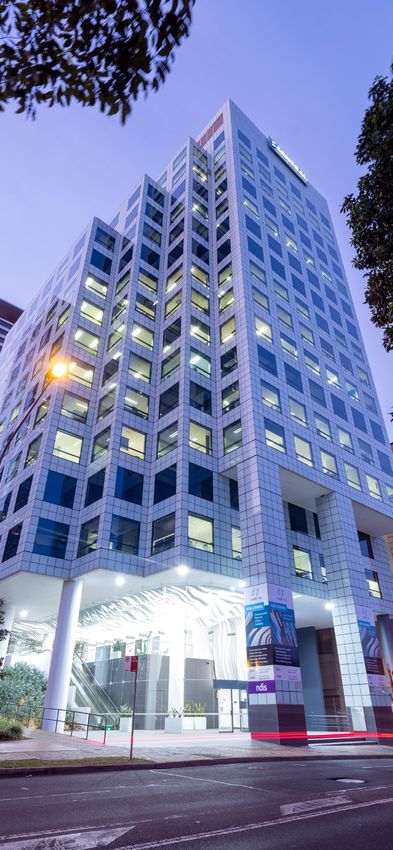
METRO OFFICE | Research & Forecast Report | H2 2019

METRO OFFICE
SNAPSHOT
                                                 NET SUPPLY         NET FACE RENTS                         NET EFFECTIVE
                         VACANCY RATE                                                    INCENTIVES                                    YIELD
                                                   (SQM)                ($/SQM)                            RENTS ($/SQM)
                                               Year to    Year to
                       Current      Jan-20                          Current   Sep-20   Current   Sep-20   Current    Sep-20     Current     Sep-20
                                              Jun-2019   Jun-2020

    NSW

    North Sydney         7.9%         6.7%     61,855     -5,900     $830     $864      21%       21%      $625       $652       5.13%      4.96%

    St Leonards          6.9%         7.4%      746       4,800      $655      $681     19%       19%      $504       $526       5.88%       5.71%

    Chatswood            5.7%         5.6%       0          0        $620     $645      19%       19%      $475       $497       6.00%       5.91%

    Macquarie Park       4.9%         5.2%    -44,345     31,000     $403      $419     21%       20%      $300        $313      5.50%       5.31%

    Norwest               N/A         N/A       N/A        N/A       $340     $347      22%       21%      $248       $257       6.05%      5.96%

    Parramatta           2.7%         2.0%      -72       54,184     $555      $577     15%       14%      $471       $494       5.13%      4.96%

    SOP                   N/A         N/A       N/A        N/A       $435     $444      23%       22%      $317       $328       5.63%      5.46%

    Rhodes                N/A         N/A       N/A        N/A       $435     $448      23%       23%      $318       $328       5.88%      5.76%

    South Sydney          N/A         N/A       N/A        N/A       $430     $439      15%       15%      $350       $360       5.75%      5.46%

    CBD Fringe            N/A         N/A       N/A        N/A       $715     $744      16%       16%      $584       $609       5.13%      4.76%

    Newcastle            3.0%         2.5%     10,500       0        $400      $410     14%       12%      $345       $360       6.75%

    VIC

    St Kilda Road        5.9%         5.7%     3,601      16,000     $435     $455      20%       21%      $348       $359       5.25%       5.11%

    Southbank           12.4%         11.9%    3,767        0        $585      $618     24%       25%      $448       $466       2.13%      4.96%

    City Fringe          6.3%         8.7%     13,900     60,200     $503     $528      13%       16%      $437       $443       5.13%       5.16%

    Inner East           6.0%         5.7%     9,400        0        $425     $439      16%       17%      $357       $364       5.50%      5.42%

    Outer East           8.9%         9.3%     5,189      42,000     $340     $352      28%       29%      $245       $250       6.38%      6.21%

    South East           6.4%         6.6%     5,200      3,500      $305      $316     20%       19%      $246       $256       7.50%       7.41%

    North & West         4.2%         3.8%     15,919     4,000      $338     $349      24%       25%      $258       $264       6.00%       5.91%

    QLD

    Inner South         13.0%        14.3%      980         0        $493     $503      34%       33%      $290       $302       5.88%      5.87%

    Urban Renewal        12.1%       11.2%     23,353     3,500      $509     $520      36%       36%      $290       $300       5.75%      5.65%

    Milton              17.5%        17.0%     2,300        0        $452     $462      36%       36%      $256       $262       6.88%      6.80%

    Spring Hill         15.9%        15.6%     1,356        0        $428     $436      37%       36%      $237       $245       7.13%      7.00%

    Toowong             13.3%        12.6%       0          0        $395     $403      36%       36%      $216        $221      7.25%       7.13%

    SA

    Fringe               13.1%       12.9%     1,440      2,285      $318       -       18%        -       $245          -       6.50%         -

    Inner Metro          3.2%         3.5%      953       2,000      $290       -       20%        -       $212          -       6.75%         -

    WA

    West Perth           16.9         16.6     2,887      1,595      $368       -      37.50%      -       $230                  6.90%         -
* Current refers to September 2019 figures

4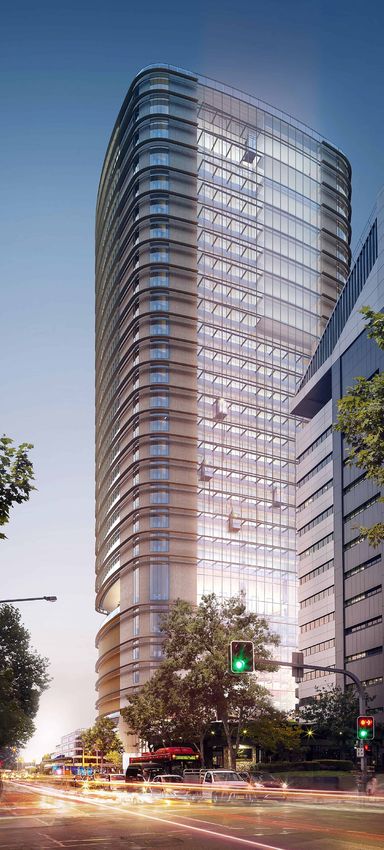
METRO OFFICE | Research & Forecast Report | H2 2019

NATIONAL
                                                                         We expect that the serviced office model will continue to be the
                                                                         dominant user group in metro office markets, with these users

OVERVIEW
                                                                         adapting their space to a more ‘hybrid’ model as true co-working
                                                                         style offices are more difficult to manage through peaks and troughs
                                                                         in demand for desks. Flexibility, however, is a trend that tenants are
                                                                         increasingly wanting to see offered in new buildings in city fringe
                                                                         markets in particular, and we expect that already strong demand
By Anneke Thompson
National Director | Research                                             from traditional users will be supplemented by this sector over the
anneke.thompson@colliers.com                                             next 12 to 18 months.
By Sami Schiavi
Senior Executive | Flexible Workspace Specialist, Office Leasing
sami.achiavi@colliers.com

Has co-working and flexible workspace truly arrived
in metro office markets?
The emergence of co-working groups and flexible workspace
operators not only in Australia but around the world has been a
major talking point in the commercial property industry. While the
impact on CBD markets is being felt – Colliers estimates that on
average co-working, flex space and serviced offices occupies 2.3 per
cent of all space in CBDs – the dynamic in our major metro markets
is quite different. The more traditional serviced office providers are
still the dominant market player in metro markets, with the business
model suiting the start-up occupier or SME who wants to remain
close to home, but have certainty of an office in a metro office
location.

Thus far, the experience of Colliers’ agents on the ground is that
co-working and flex space groups are having a minor impact on
overall take up of space. However, based on enquiry patterns, this
dynamic could change over the next 12 to 18 months. In a market
such as North Sydney for example, the bulk of enquiry is still from
more traditional corporate users such as IT, finance & insurance and
engineering & construction groups.

In Parramatta, the lack of opportunity is preventing co-working and
flexible workspace groups from establishing any real presence in
the market. In a more novel approach to space use, one landlord in
the precinct has converted a floor of carparking to a circa 700sqm
owner-managed co-working facility. Our enquiry data tells us that
only about 2 per cent of enquiry to Colliers’ is for true co-working
type users in the Parramatta market.

In Melbourne, approximately 5 per cent of deals done over the
past 6 months has been to flex space groups, although there are a
number of larger deals currently in play. Given the depth of demand
in Melbourne is still strong and from varied industry types, landlords
and developers of new space in Melbourne’s fringe market in
particular are preferring to take a ‘wait and see’ approach to flex
space. The Brisbane fringe market has a larger presence of co-
working and serviced office space, at approximately 3.5 per cent,
for reasons such as the affordability factor and the large size of the
market relative to the Brisbane CBD.                                     67 Albert Avenue, Chatswood, NSW
                                                                         Sold on behalf of Corval

5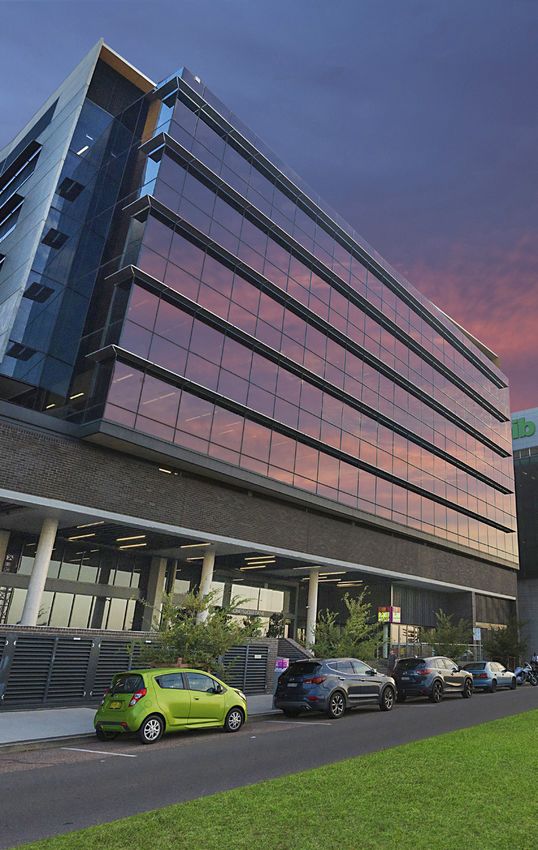
METRO OFFICE | Research & Forecast Report | H2 2019
SYDNEY
OVERVIEW
Market Indicators - September 2019 Cash rate cuts, a lowering of the Australian dollar and a lack
of opportunity in the CBD is creating interest in Sydney Metro
AVERAGE NET FACE RENTS ($/m2) office assets and increasing in appeal to investors. Overall yield
Prime Secondary compression in the 6 months’ to Q3 2019 was 24 basis points for A
Grade and 37 basis points for B Grade.
L H L H
$504 $580 $466 $550
Parramatta is firmly on the investment radar given continued low
vacancy, significant infrastructure activity and 9.7 per cent year on
AVERAGE YIELDS year rental growth making this market one of those most attractive
Prime Secondary investment propositions in the country.
L H L H
5.41% 5.80% 5.73% 6.25% Demand in North Sydney has increased markedly in the second half
of the year, after the first half was impacted by occupiers hesitance
AVERAGE CAPITAL VALUE* ($/m2) to make decisions.
Prime Secondary
L H L H Private investor capital continues to dominate metro market activity,
$8,439 $10,860 $7,555 $9,716 particularly from Hong Kong. Given the level of investor interest
in Sydney metro markets, as well as solid underlying occupancy
fundamentals, expect yield compression of 5 to 10 bps over the next
SEP-2019 YEAR TO SEP 2020 (F) 12 months.
NET SUPPLY
Above average face rental growth continues in all markets, bar South
Sydney. While Parramatta leads the way, A Grade rents in North
119,350m2
18,184m2 Shore markets have grown by an average of 5.7 per cent.
TOTAL MARKET
VACANCY RATE
5.5% 4.9%
Sydney Metro Office - A Grade Net Face Rents Sydney Metro Office A Grade Yield Range
$900
$800
$700
$600
$/sqm
$500
$400
$300
$200
Sep-04
Mar-05
Sep-05
Mar-06
Sep-06
Mar-07
Sep-07
Mar-08
Sep-08
Mar-09
Sep-09
Mar-10
Sep-10
Mar-11
Sep-11
Mar-12
Sep-12
Mar-13
Sep-13
Mar-14
Sep-14
Mar-15
Sep-15
Mar-16
Sep-16
Mar-17
Sep-17
Mar-18
Sep-18
Mar-19
Sep-19
North Sydney St Leonards Chatswood Macquarie Park Norwest
Parramatta SOP Rhodes South Sydney CBD Fringe
Source: Colliers International Source: Colliers International
6
METRO OFFICE | Research & Forecast Report | H2 2019

By Anneke Thompson                                                         Some recent leasing activity has seen Ooh Media commit to
National Director | Research                                               6,000sqm at 73 Miller Street. This building is currently being
anneke.thompson@colliers.com
                                                                           refurbished, and is due for completion in May 2020, which will

Investment Market                                                          add an additional 12,000sqm to the market. The total vacancy rate
                                                                           in North Sydney is currently 7.9 per cent, up from 6.8 per cent in
Investment volumes of $2.09 billion have transacted in Sydney Metro        January 2019. The increase was primarily due to the backfill created
markets over the calendar year to Q3 2019. At the same time last           by the completion of 100 Mount Street. We forecast vacancy to
year, transaction volumes were $1.9 billion. Sydney metro is one of        reduce to sub 7 per cent by January 2019, on the back of stronger
the few markets where volumes are up on the year prior, as vendors         leasing conditions in the second half of 2019.
take advantage of significant buyer interest. Of particular note is the
                                                                           Both A and B Grade net face rents have grown significantly, at 5.7
rise in buyer activity from Hong Kong. Whether this is a result of the
                                                                           and 5.3 per cent respectively over the 12 months to Q3 2019. Net
well known tension in that market locally is unknown, however, six
                                                                           face rents for newly built stock, however, has grown even faster, at
different buyer groups have come out of Hong Kong. This includes
                                                                           7.7 per cent, reflecting tenant preferences for efficient floorspace in
ESR buying out PropertyLink and effectively the properties located
                                                                           buildings with the latest technology and amenity.
in Sydney metro markets, and we should note that ESR, while
based in Hong Kong, is ultimately backed by US private equity firm         Chatswood
Warburg Pincus. In 2018, only two sales out of a total of 45 sales         The Chatswood market has very limited whole floor options, and for
recorded were to Hong Kong investors. Investment in the Sydney             this reason we have recorded face rental uplift of just over 5 per
metro market is not only being driven by the search for yield, but also    cent. Vacancy in the A Grade market of Chatswood declined from
the long term rezoning potential that some metro sites afford their        6.6 per cent in July 2018, to 3.6 per cent now, representing just
buyers.                                                                    over 5,600sqm of physical vacancy. More options will be available to
Yields in the metro office market firmed in most markets. Average          occupiers when 9,000sqm becomes available at Zenith (821 Pacific
A grade yields in Norwest are now 6.05 per cent, down from 7.00            Highway) in 2020.
per cent this time a year ago, reflecting a very solid 95 basis points     St Leonards
of yield compression. Parramatta, Sydney Olympic Park and South
                                                                           Recent renewal activity and leasing activity at 118 – 120 Pacific
Sydney all firmed by 38 basis points over the year. In the B Grade
                                                                           Highway means that the market is very tight, with availability
market, Parramatta yields dropped to 5.63 per cent on average, down
                                                                           currently only at 29-57 Christie Street and 1 floor at 601 Pacific
from 6.25 per cent in Q3 2019.
                                                                           Highway. NSW Health have taken approximately 9,500sqm at 100
While we haven’t recorded average yield compression in markets             Christie Street, and this space will become available in early 2021. In
such as North Sydney, capital values continue to grow on the back of       a similar vein to Chatswood, A grade net face rents have increased
solid rental growth. In North Sydney, prime grade existing buildings       by 5.6 per cent year on year, with a slight increase in the lower
grew in value by an average of 5.7 per cent year on year, while for        range of our incentive band.
new prime grade buildings, values grew by 7.7 per cent. Parramatta,        Macquarie Park
however, recorded some of the strongest capital value growth in
                                                                           Vacancy in Macquarie Park remains very tight, at 4.9 per cent as at
the country, at 17.7 per cent for prime grade year on year, and an
                                                                           July 2019. Rents in all grades of space have increased over the 12
extraordinary 21.6 per cent for secondary grade buildings.
                                                                           months to Q3 2019, with rental growth of 4.1, 3.9 and 6.6 per cent for
Given the exceptionally low bond yield outlook, and continued              New A, A and B grade space respectively.
strength in occupancy markets, we expect that yields in most
                                                                           Major leasing deals since the beginning of 2019 include Deloitte
markets will continue to trend downwards. Our forecasts indicate
                                                                           taking up 4,000sqm at 11 Talavera Road joining Merck and MultiLit
yield compression of an average of 21 basis points across the Sydney
                                                                           occupying 1,800 and 800 sqm respectively, and Becton Dickinson
Metro office market. Those sites that are a medium to long term
                                                                           signing 3,500sqm at 66 Waterloo Road. Following the spinoff from
residential conversion opportunity will likely be the most sought after,
                                                                           Novartis, eye care device manufacturer Alcon has also moved into
as the Sydney residential supply pipeline is slowing dramatically
                                                                           1,500sqm at 5 Talavera Road early in 2019. The pre-commitment
over the next few years, at the same time as population growth is
                                                                           market has also been active with Schneider and Luxottica pre-
expected to continue.
                                                                           leasing 7,000 and 4,000sqm respectively at the upcoming

North Shore                                                                development at 95 Waterloo Road.

North Sydney                                                               There is generally strong leasing activity in the 1,000 to 4,000sqm
                                                                           range, although tenants are looking to use space more efficiently.
Demand in North Sydney has increased markedly in the second
                                                                           For this reason, we are seeing relocations to newer space and a
half of the year, after the first half was impacted by occupiers being
                                                                           reduction in NLA occupied as occupiers reduce their overall footprint.
hesitant to make decisions. Both the federal and state elections
earlier in 2019 were likely the primary cause of this slowdown in
activity. Now, however, demand has picked up particularly in the
whole floor 1,000 to 1,300 sqm market, and due to recent leasing
activity, tenants now have very limited options available to them.

7
METRO OFFICE | Research & Forecast Report | H2 2019

Western Sydney                                                           Backfill supply, however, is expected to increase due to some tenants
                                                                         vacating their existing premises for these new developments.
Parramatta                                                               Specifically, backfill options will include 11,600sqm at 60 Station
Parramatta continues to transform itself into a first-tier commercial    Street following the departure of QBE, as well as circa 15,000sqm
hub and economic powerhouse of New South Wales, underpinned              when the Office of State Revenue (132 Marsden and 87 Marsden
by a massive program of infrastructure developments. Infrastructure      Streets), and the Department of Planning and Environment (10
spending in the Western Sydney region is booming with the                Valentine) relocate. 150 and 101 George Street 39,500sqm will also
Bankwest Stadium now completed while the Parramatta Square               lose the Commonwealth Bank to The Australian Technology Park in
project is progressing to its final stages. Other mega projects in       Redfern. GPT’s 26,000sqm commercial tower at 32 Smith Street
the pipeline include a $1 billion upgrade to the Westmead Hospital,      Parramatta (50 per cent pre-leased to QBE) is well underway,
the development of a new Powerhouse Museum and the first high            and completion is expected by mid-2020. They are currently in
rise Parramatta High School. Supporting these developments is            discussions with tenants to occupy the remainder of the building.
the Parramatta Light Rail, M4 upgrades and the M4 tunnel between
Homebush and Haberfield, bypassing 22 sets of traffic lights, which
will form part of the WestConnex to be completed in 2023.

Occupier demand has also responded positively to the improvement
in infrastructure and accessibility of Parramatta. The Parramatta
office market recorded one of the sharpest increases in rents in the
country at nearly 10 per cent over the past year as well as the lowest
A-Grade vacancy rate nationally at 0.6 per cent as at July 2019.
B-Grade properties also recorded a historically low vacancy rate
of 3.2 per cent, which is 3.9 per cent below the long-term average
of 7.1 per cent. With the Parramatta office market being one of the
fastest-growing metro CBDs in the country, the market is attracting
significant attention from investors from overseas, particularly Asia,
Europe and North America.

According to forecasts by Colliers International, the overall vacancy
rate is expected to trend down toward 2.0 per cent by the end of
2019. Beyond 2020, supply is expected to rise on the back of the
completion of several major developments. However, much of this
supply will stem from backfill space while new developments are
mostly pre-committed. Nevertheless, we anticipate the net absorption
will commensurate with the increase in new additions, with demand
coming from tenant migration from surrounding suburban locations
as well as an emergence of flexible and co-working operators in
the market. The State Government continues its decentralisation
policy with 130,000sqm of occupied space relocating from the
Sydney CBD to date and 50,000sqm over the next 12 months. The
Parramatta CBD is expected to remain the greatest benefactor to this
decentralisation process.

New development to increase backfill supply
The lack of new office supply in Parramatta is projected to persist
until the end of 2020 when several new schemes are expected to
be completed. The current office stock of Parramatta currently sits
at 719,547sqm and is expected to exceed 1.0 million sqm by the end
of 2022. Nevertheless, speculative supply will be limited as most of
the new developments have already achieved high levels of pre-
commitments. Upcoming developments will include:

•    4 Parramatta Square (62,552sqm – fully leased to Property
     NSW)
•    3 Parramatta Square (43,000sqm – fully pre-committed
     by NAB) 6 Hassall Street (28,000sqm – 50 per cent pre-
     committed to UWS and UNSW)
                                                                         32 Smith Street, Parramatta
                                                                         Valued on behalf of GPT Group

8
METRO OFFICE | Research & Forecast Report | H2 2019

Leasing Market                                                                City Fringe
Parramatta remains a two-tiered leasing market due to the shortage            The City Fringe continues to be supported by demand from
of quality and contiguous prime office space. Incentives have                 knowledge-based industries and improvement in infrastructure and
remained relatively low compared to other metropolitan markets due            amenities. The State Government has plans to transform the area
to the low vacancy. New leases have been predominantly made up                surrounding Central Station into a new Technology and Innovation
of sub-300sqm or 900sqm+. Most of the activity has derived from               Precinct. The precinct is characterised by a high concentration of
new tenants moving into the market, whereas local tenants have                universities, start-ups and high-tech companies. However, new
tended to renew. Average A Grade net face rents are now ranging               supply has remained relatively constrained due to the lack of large-
from $520-$590/sqm, and for B Grade properties the net face rents             scale development sites and competition from alternative uses
range from $435-$510/sqm. Incentives are generally ranging from               such as residential and hotels. The current A-Grade rents in the
15-20 per cent for both A Grade and B Grade properties where                  City Fringe currently sit at circa $665 - $765/sqm with incentives
longer lease terms have been negotiated. We anticipate incentives to          ranging between 14-17 per cent. B-Grade assets are achieving net
remain steady to the end of 2019 as incentives for quality contiguous         face rents of around $510 and $630/sqm with incentives running at
A Grade stock remain at circa 15 per cent. Rentals for prime new              between 14-18 per cent. In the investment market, A-Grade assets
A grade accommodation are expected to range from $580-$630/                   are expected to trade at about 5.00 and 5.25 per cent, while B-Grade
sqm. Outgoings remain at circa $90/sqm to $120/sqm though new                 properties could archive 5.38 and 5.75 per cent.
buildings are designed to achieve higher environmental ratings
which should provide savings. New tenants in the market include
Wipro (900sqm), Perenso (155sqm), Viridian (391sqm), Education
Centre of Australia & Swinburne University (3579sqm) and Downer
(3,168sqm).

1 Denison Place, North Sydney
Colliers International’s Tenant Advisory team has secured space for Nine Entertainment Co. in 1 Denison Place, North Sydney and Colliers Project Leaders
team are appointed for the project management of the fitout

9
METRO OFFICE | Research & Forecast Report | H2 2019
MELBOURNE
OVERVIEW
Market Indicators - September 2019 Following strong interest in Richmond, Cremorne and South Yarra
over the past few years, developers are searching for the next
AVERAGE NET FACE RENTS ($/m2) emerging market. South Melbourne and Collingwood are being
Prime Secondary targeted by these groups due to their close proximity to the CBD,
connectivity and retail amenity.
L H L H
$361 $403 $277 $328
The South East metro market was the only metro market to record
a decline in vacancy. This precinct is tightly held from both a leasing
AVERAGE YIELDS and investment perspective, and has limited new supply in the
Prime Secondary pipeline.
L H L H
5.65% 6.60% 6.35% 7.10% Once completed the Arden/Macaulay precinct could provide up to
35,000 new white collar jobs, cementing it as a new city fringe office
hub. Given this precinct is only two kilometres from the CBD and will
AVERAGE CAPITAL VALUE* ($/m2) be serviced by the new North Melbourne station, we expect strong
Prime Secondary
interest from occupiers once development plans are realised.
L H L H
$5,644 $7,436 $4,112 $5,393 St Kilda Road is experiencing a change in sentiment, where developers
are shifting opportunities to office rather than proposed residential.
SEP-2019 YEAR TO SEP 2020 (F) The strength of the office market in Melbourne overall has resulted in
office use being the more viable option.
NET SUPPLY
109,700m2 As financiers seem to be tightening lending available to developers,
we are observing that investors are preferring fully leased assets
49,608m2
with limited risk. These properties are being well received by the
market and transacting for tighter yields.
TOTAL MARKET
VACANCY RATE
7.5%
6.8%
City Fringe enquiries 2012 to 2019 Melbourne Metro Average Yields
11.00%
250
216 10.00%
193 200
200 179
Average Yield
169 9.00%
158
Number of enquiries
151
150 8.00%
7.00%
100
64 6.00%
50 5.00%
Mar-04
Sep-04
Mar-05
Sep-05
Mar-06
Sep-06
Mar-07
Sep-07
Mar-08
Sep-08
Mar-09
Sep-09
Mar-10
Sep-10
Mar-11
Sep-11
Mar-12
Sep-12
Mar-13
Sep-13
Mar-14
Sep-14
Mar-15
Sep-15
Mar-16
Sep-16
Mar-17
Sep-17
Mar-18
Sep-18
Mar-19
Sep-19
1 2
0
2010 2011 2012 2013 2014 2015 2016 2017 2018 2019
City Fringe Inner East Outer East South East North&West A Grade Total Metro
Count of Enquiry Date / Opt In Date
Souce: Colliers International Souce: Colliers International
10METRO OFFICE | Research & Forecast Report | H2 2019
By Sarah Walker City Fringe
Manager | Research
sarah.walker@colliers.com Over the next few years, there is the scope for an influx of new
developments in the City Fringe, predominantly in the Richmond
Investment Market and South Yarra precinct, after a period of reducing supply due to
withdrawals. Developers have been encouraged by the increasing
When compared to 2018, the number of investment sales in the City
level of enquiry for tenants over the last couple of years, as well as
Fringe is significantly below last year. There was a total of 19 sales
upcoming supply constraints in the CBD, and the emergence of a
over $5 million when compared with only 6 sales year to date. The
viable option to the CBD precinct. The tech sector, and its associated
recent sale of 49-51 Stead Street, South Melbourne for $10.2 million
industries, is one sector that is experiencing significant growth in
shows buyer confidence is prevalent in the South Melbourne office
employment levels. As Richmond and South Yarra are now viewed
market. The building was recently refurbished and is fully leased to
as established office markets, developers are searching for the next
Ewert Leaf with six remaining years, sold on a tight 5.45 per cent
emerging market in which to access sites.
yield.
The previously industrial pocket of South Melbourne is attracting
The Inner East, a traditionally tightly held market with few sales,
interest from a wide range of tenants with the drivers being local
has had only three sales for the second half of this year. There has
retail amenity along Clarendon Street, proximity to the CBD, and
been a trend in private investors looking to capitalise on potential
surrounding parklands. The new metro tunnel brings Anzac station to
rental reversion in the market. The largest sale was at 830-832 High
the end of Albert Road, which will service St Kilda Road, South Yarra
Street, Kew purchased for circa $22 million by private investor on
(west end) and South Melbourne, providing better connectivity for the
a tight 3.75 per cent yield with 92 per cent of the building leased.
area. South Melbourne currently has a number of developments in
As financiers are tightening the amount they are lending, we are
the pipeline, including:
observing that investors are preferring fully leased assets with less
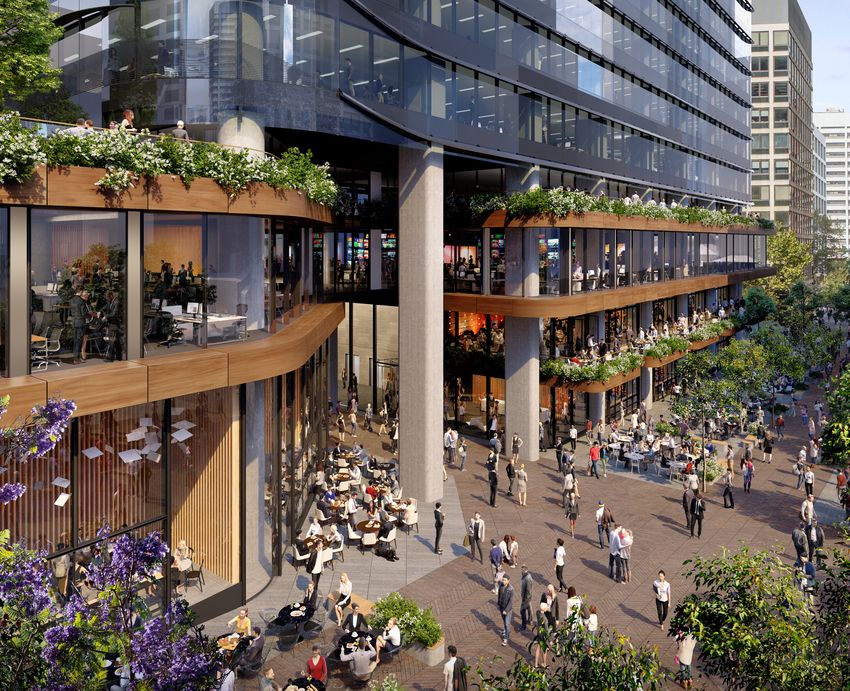
risk. • 68 Clarke Street designed by Elenberg Fraser. This project
comprises 11,000sqm of office space, with over 30 per cent
The Outer East attracts syndicates and institutional investors and as
pre-committed to Luxury Escapes and other groups
a result office buildings trade more frequently than other markets
that have a higher proportion of private ownership. 4 Wesley Court, Coworking group ‘Creative Cubes’ who already occupy sites in
Burwood East transacted for $50 million to an offshore investor Richmond and Hawthorn have expanded their footprint to 111 Cecil
with a yield of 6.5 per cent with the building fully leased to DXC Street comprising of 4,000sqm. They are also looking at other city
Technology. The former 7 Eleven Head Office located at 357 fringe locations, such as Collingwood, Fitzroy and North Melbourne.
Ferntree Gully Road, Mount Waverley was recently purchased by a The vacancy in the City Fringe market increased over the last
local private investor with vacant possession for $8.1 million. six months from 4.47 per cent to 6.28 per cent. While this is a
In the South East, also a very small and tightly held market, there significant increase, the upwards jump can be explained by a small
was only one sale in 2018 and only one sale this year. Dulux House number of large vacancies new to the market, notably at 658 Church
at 1956 Princes Highway in Clayton transacted $24.88 million, Street, where Country Road vacated 8,000sqm in Building 3 and
relfecting an initial passing yield of 6.78 per cent. The four-storey the completion of Building 9 at Botanicca, which added 7,000sqm to
office building was purchased by an offshore Hong Kong investor, supply as unoccupied space.
with a lease to Dulux in place until October 2022. Average face rentals in the City Fringe increased for all grades in the
There has only been one investment sale in the North West for the last six months. Rents for new developments averaging $573/sqm, A
second half of this year. 90 Maribyrnong Street, Footscray transacted Grade averaging $503/sqm and B grade $408/sqm. We forecast face
for $33.1 million to an institution at a yield of 6.75 per cent. The rents to increase by 5.00 per cent for A grade in the next 12 months,
building was fully leased to seven tenants with a WALE of 6.5 years. as good tenant enquiry converts to transactions. Incentives increased
for all grades, predominantly for new developments, increasing to
In St Kilda Road, The Mars family dominated the market with their
an average of 26 per cent from 21 per cent six months earlier in
purchase of 424 St Kilda Road “Illoura House” for $70 million in
March. This average has increased due to more recent deals being
July this year. The Mars family also purchased 420 St Kilda for $98
negotiated with higher market incentives which are designed to make
million on a 4.75 per cent passing initial yield. Yields for both A
the city fringe competitive with the CBD and compete with other
and B Grade buildings have sharpened, 25 basis points to 5.25 per
surrounding sites.
cent and 38 basis points to 5.50 per cent over the last six months
respectively. Overall, demand remains firm. A number of CBD occupiers are
currently looking at opportunities in the city fringe. These occupiers
now see the city fringe as a viable option, due to the critical mass
and new projects being built. There is also still continued enquiry
from occupiers in the outer suburban markets, who want to be closer
to the CBD and to also increase access to employees.
11METRO OFFICE | Research & Forecast Report | H2 2019
Inner East South East
Vacancy in the Inner East market increased to 5.95 per cent this The South East metro market was the only metro market to record a
September, from 3.58 per cent in March 2019. The lack of new decline in vacancy, emphasising the tightly held nature of this market
development opportunities in this market is resulting in tenants from both a leasing and investment perspective. There is only one
needing to renew existing leases. Holcim Australia at 290 Burwood upcoming development, Morris Moor, which is located in Moorabbin
Road renewed on a new 5-year lease at their existing premises and and will comprise 20,000sqm of office in total. The development will
Swinburne University also re-signed at their existing tenancy at 2 be complimented with the new brewpub, Stomping Ground which
Luton Lane, Hawthorn. has helped attract office tenants. EFM Logistics moving from Glen
Waverley have leased 2,850sqm for a net rent of $285/sqm. Prestige
Face rentals have increased for new developments and existing A
Home Care (700sqm), Empower Healthcare (280sqm) and Hunter
Grade office over the last 6 months, averaging $480/sqm and $425/
Amenities (358sqm) are all to join EFM Logistics at Morris Moor at
sqm respectively while B Grade remains steady at $360/sqm. This
net face rents of $285/sqm. The average face rents in the precinct
is driven by a lack of new development opportunities as tenants are
increased for all grades to $335/sqm for new developments, $305/
required to pay a premium to secure better quality accomodation.
sqm for A Grade space and $270/sqm for B grade.
As the residential market is slowly saturating, it is starting to become
In this tight market, the next development opportunity is at 350
more feasible to develop sites into office in some instances. 2-4
Warrigal Road, Oakleigh South, a 2,000sqm development by
Roche Street, Hawthorn -previously with a permit to develop a
Pellicano. This building is due for completion in late 2019.
7-level apartment building - will instead be developed as office. We
expect that new upcoming office developments in the Inner East
market will perform strongly given the current limited supply of
quality accommodation. Notable developments that will provide office
suites include:
• 141 Camberwell Road, Hawthorn East which will comprise
8,000sqm of office. (Complete)
• 260 Burwood Road, Hawthorn - a 12,000sqm development with
Xero already pre-committing to approximately 85 per cent of the
development. Completion is expected in the second half of 2021.
Building 3 at Botannica in Richmond is nearing completion (H1 2020)
and will comprise a total of 19,000sqm. Despite this development
being located in the City Fringe we expect that it is likely to absorb
Inner East tenants due to its convenient location. This may see
opportunity open up in the Inner East as tenants move to this
development, especially due to lack of new development in the Inner
East in early 2020.
Outer East
There has been a flurry of leasing activity at Tally-Ho Business Park
in Burwood East, as a new wave of tenants are sweeping into the
popular centrally located precinct. New entrants include the Outdoor
Education Group, who will occupy a whole 1,000sqm building at 9
Lakeside Drive and Freight Concepts, who have leased 650sqm at
16 Lakeside Drive. The CFA, a long standing existing occupier leased
an additional 650sqm of project space at 5 Lakeside Drive. All leases
were negotiated at a face rental of circa $280/sqm. Pronto Software
has leased a 3,200sqm office at 353 Burwood Highway in Burwood
East, a move which has created around 3,000sqm of backfill at 20
Lakeside Drive and 378 Burwood Highway. Ambulance Victoria has
also taken an additional 1,500sqm at 12 Wesley Court, Burwood East.
The overall vacancy in the Outer East precinct has remained
unchanged over the 6-month period, from 8.46 per cent to 8.93
per cent. A shift towards quality fitted space is an important factor
for tenants in this market, hence face rents increased for new
developments to average $343/sqm and A Grade space increased
to $340/sqm, B grade has remained steady at $250/sqm for the last
Building 1 and 2, 658 Church St, Richmond
year. Managed on behalf of Terraplex Pty Ltd
12METRO OFFICE | Research & Forecast Report | H2 2019
North & West office being the more viable option. The new Anzac metro station is
also to the advantage of St Kilda Road with enhanced connectivity
Vacancy in the North & West decreased to 4.15 per cent from
to the city and up to North Melbourne. 412 St Kilda Road will
4.48 per cent over the last six months, despite the increase in
likely come to market as a 16,000sqm office tower in the second
vacancy from the Good Guys backfill at Essendon Fields, evident
half of 2020 and is currently for sale being marketed by Colliers
of this precinct’s strong office absorption levels. The Good Guys
International. This reflects the change in circumstance for St Kilda
at Essendon Fields merged with JB Hifi (previously at Chadstone),
Road, which historically has experienced stock withdrawn for
consolidating and moving to Southbank. Net face rents for A Grade
residential development absence of new office developments.
assets increased 4 per cent in 12 months, averaging $338/sqm. The
B Grade market increased 5 per cent in the same period to average On average, face rents have increased to $435/sqm for A Grade and
$225/sqm. Incentives for both A and B grade have remained steady remained steady at $368/sqm for B grade space. Vacancy in the St
averaging 24 per cent and 25 per cent respectively. Kilda Road strip has reduced to 5.88 per cent in July 2019, from 6.57
per cent in January – currently the lowest vacancy in over 14 years.
In the western end of the market, 3 sites are currently available for
larger pre-commitment. At Williams Landing, 95 Overton Road and 1 In Southbank, vacancy recorded by the PCA, increased to 12.4
Kendall Street are permitted and can accommodate up to 10,000sqm per cent in July (from 10.7 per cent in January). The increase
and 20,000sqm respectively. In Werribee, Citinova and Pelligra are in vacancy can be explained by the large vacancy at 12 Riverside
looking to develop a 12,000sqm office on top of a car park at 37 Quay comprising circa 22,000sqm after Exxon vacated and it will
Cherry St. The car park has been committed to by Wyndham City continue to sit vacant until a decision is made to fill the tenancy or
Council. develop the building. A 2,633sqm sub-lease space at ‘Philip Morris’
St Kilda Road and Southbank 30 Convention Centre Drive was leased by Database Consultants
Australia (DCA). Average face rents for both A and B grade spaces in
Sentiment has changed in St Kilda Road, where developers are
Southbank increased to $585/sqm and $435/sqm respectively.
shifting their opportunities to office, after years of conversion to
residential stock. The strength of the office market, has resulted in
20-30 Mollison Street, Abbotsford
Leasing on behalf of a Private Client
13METRO OFFICE | Research & Forecast Report | H2 2019
BRISBANE
OVERVIEW
Market Indicators - September 2019 The Brisbane Metro office market is the most improved market
throughout Australia, with the vacancy tightening nearly 2 percentage
AVERAGE NET FACE RENTS ($/m2) points, from 15.7 per cent in January to 13.8 per cent in July this
A Secondary year. Net demand reached an eight-year high of circa 32,630sqm in
the first half of 2019.
L H L H
$430 $481 $329 $373
New development supply under construction or to commence
construction this year is forecast at 68,500sqm (representing 5.5 per
AVERAGE YIELDS cent of the current stock). It will expand beyond the Urban Renewal
A Secondary precinct, with the largest projects under construction located in
L H L H Spring Hill (152 Wharf Street) and Inner South (the Mobo building).
6.20% 6.95% 7.03% 7.79%
A grade average gross face rents has increased by 5.6 per cent over
the past 12 months, to $553/sqm in September this year. This increase
AVERAGE CAPITAL VALUE* ($/m2)
in conjunction with the slight fall in average incentives underpin the
A Secondary
annual growth in average gross effective rents of 6.2 per cent, to $356/
L H L H
sqm in September this year.
$6,302 $7,898 $4,289 $5,281
The investment market remains very tightly held on the back of
limited alternative investment options. The estimated volume of sales
SEP-2019 YEAR TO SEP 2020 (F)
(above $5 million) has declined to circa $435 million for the year to
NET SUPPLY date, sitting below the long-term average (circa $820 million).
27,989m2 The yield compression trend continues for a sixth consecutive
3,500m2 year, with the A grade average yield estimated at 6.58 per cent
in September this year compared to 6.93 per cent a year ago.
Colliers International anticipates that the yield will report a minor
TOTAL MARKET compression over the remainder of the year supported by a further
VACANCY RATE
cash rate cut.
13.8% 12.6%
Average A Grade Gross Face Rent - Brisbane Metro Sales by Purchaser Type
CBD and Urban Renewal
$800 $1,800
$750 $1,600
$700 $1,400
AUD$ per sqm
$650
AUD$ (million)
$1,200
$600
$1,000
$550
$800
$500
$600
$450
$400
$400
$350 $200
$0
2016 2017 2018 YTD 2019
Brisbane CBD Urban Renewal Metro Market Average Institution Private Other
Source: Colliers Edge Source: Colliers Edge
14METRO OFFICE | Research & Forecast Report | H2 2019
By Karina Salas Record demand in the Milton Office Precinct
Manager | Research
karina.salas@colliers.com Solid tenant demand across the A grade asset class in the precincts
of Milton, Urban Renewal and Spring Hill support the decline in
The resurge of domestic syndicates and private vacancy over the past six months. The market reported a net
investors increase in tenant demand of circa 32,600 sqm becoming the largest
For a second consecutive year, investment opportunities in the Metro net absorption seen in eight years.
market remain very tightly held, underpinning the downward trend on The Milton precinct has been in high demand over the first half of the
sales volumes and average transaction price. Colliers International year, reporting a record net absorption of 19,848sqm and driving the
estimates that the average sale price has declined from circa $60 vacancy rate down to 17.5 per cent, from the historical highest level
million in 2018 to an estimated average of circa $29 million over the of 27.9 per cent in July 2018.
year to date.
The influx and relocation of tenants in the Milton precinct reflects the
So far in 2019, we have seen an increase in activity in suburban value proposition on offer and the lack of A grade contiguous space
office transactions with a broad spectrum of active players chasing with large floor plates. We have seen a wide range of tenants either
yields including high-net-worth private investors, syndicators and relocating or expanding in the precinct including Sandvik Mining,
listed and unlisted vehicles managed by larger asset managers. Australian Radio Network, Rock Technologies, AIA Insurance and
For the year to date, we have estimated circa $176 million of asset Corporate House leasing in excess of 6,000sqm. The deal to CPB
sales in markets including Hamilton, Cannon Hill, Murarrie, Eight Mile Contractors in 339 Coronation Dr for approximately 8,000sqm is an
Plains, Beenleigh, amongst others. Syndicates and private investor example of a tenant chasing large contiguous space within 5km of
acquisitions have more than doubled over the year to date, reaching the CBD.
circa $129 million compared to $66 million of sales recorded in 2018.
Flex space operators expanding to Metro locations
One of the most notable transactions over the year to date was the
Flex space operators have seen significant potential in the Brisbane
sale of the Australian Taxation Office (ATO) building at 28 Macgregor
office market, expanding throughout all the different office precincts
Street in Upper Mount Gravatt for $63.6 million acquired by Charter
within the Metro area and occupying circa 24,280sqm. The Urban
Hall Long WALE REIT at a passing yield of 7.7 per cent from a La
Renewal precinct is the preferred Metro location for flex space
Salle-managed vehicle. The building is predominantly leased to the
operators occupying circa 18,500qm or equivalent to over 3.5 per
ATO with a WALE of 7.1 years and fixed annual rental reviews of 2.5
cent of the precinct stock. This preference is supported by the
per cent. This acquisition along with other investments have been
location, quality and affordability of rents compared to the A grade
partially funded via public and institutional equity raising.
market in the CBD.
Due to the low interest rate environment and the inverted shape of
Colliers International estimates that the average A grade gross
the Australian bond yield curve for short-term maturities (at the
face rent in the Urban Renewal precinct is about $135/sqm more
time of writing), Colliers International anticipates that investment
affordable compared to the A grade rent in the CBD. This supports
opportunities will remain tightly held over the remaining of 2019
the estimated Urban Renewal expansion of flex space operators
and potentially well into 2020 with on market offerings being
to circa 24,780sqm by mid-2022. Regus is one of the operators
competitively bid for.
expanding within the precinct over the next few years and occupying
Since 2016 there have been several repositioning of short WALE and 4,800sqm at the Jubilee Place office development by late 2021.
low occupancy office assets, with investors such as Quintessential
Equity and the Marquette Properties Moelis JV executing successful
strategies at 8 Gardner Close in Milton and 164 Grey Street in
South Brisbane, respectively. We have seen a significant weight
of capital seeking value-add projects in metropolitan markets with
several existing and new market players seeking to acquire assets
and ride the resurgent leasing cycle. Refurbishment projects under
construction or in the pipeline are estimated at circa 48,000sqm,
representing nearly 9 per cent of the secondary grade stock.
Yield Outlook
Underpinned by significantly reduced debt costs and a resurgent
leasing market, yield compression is forecast to continue into 2020
as we enter a ‘lower for longer’ debt cycle. A-grade investments
have transacted at an average yield of 6.58 per cent while B
grade assets offer an average spread of circa 85bp over A grade
investments. B to A grade yield spread remains below historical
levels (of over 110bp), which provides further evidence of the lack of
19 Corporate Drive, Cannon Hill
attractive investment opportunities. Leasing on behalf of Aviator Capital
15METRO OFFICE | Research & Forecast Report | H2 2019
ADELAIDE
OVERVIEW
Market Indicators - September 2019 Investment volumes remain strong with over $91.4 million of property
transacting in 2019 which is above the $87.3 million sales volume in
AVERAGE NET FACE RENTS ($/m2) 2018.
Prime Secondary
L H L H Metro markets have driven sales volumes in 2019, with 70 per
$269 $339 $216 $266 cent of office investments originating from this market. The Fringe
markets have seen an even higher level of activity, with $27.2 million
of assets changing hands within the year.
AVERAGE YIELDS
Prime Secondary
New supply in the Fringe and Metro markets is predicted to increase,
L H L H
with 2,641 sqm under construction and a further 32,200 sqm in the
6.00% 7.25% 6.75% 7.75%
approvals process. A further 4,390 sqm in the Adelaide Fringe is
currently under refurbishment.
AVERAGE CAPITAL VALUE* ($/m2)
Prime Secondary Vacancy in the metro markets has increased to 4.5 per cent, an
L H L H increase from the record low of 3.6 per cent however well below the
$4,317 $4,686 $3,200 $3,432 five-year average of 6.3 per cent.
Land tax is a looming risk to Adelaide property markets, with regards
SEP-2019 YEAR TO SEP 2020 (F)
to the state governments proposed changes to allow for aggregation
NET SUPPLY across property portfolios – elaborated further below.
1,440m2 2,285m2
TOTAL MARKET
VACANCY RATE
13.1%
11.2%
Metro & Fringe Office Sales Adelaide Fringe & Metro Vacancy
$160 14.0%
$140 12.0%
$120 10.0%
$100 8.0%
$ Millions
$80 6.0%
$60 4.0%
$40 2.0%
$20 0.0%
H1 H2 H1 H2 H1 H2 H1 H2 H1 H2 H1 H2 H1 H2
$0
2013 2013 2014 2014 2015 2015 2016 2016 2017 2017 2018 2018 2019 2019
2007 2008 2010 2011 2012 2013 2014 2015 2016 2017 2018 2019
Metro Fringe Metro office Fringe office
Source: Colliers International, PCA OMR Jan 2019 Source: Colliers International, PCA OMR Jan 2019
16METRO OFFICE | Research & Forecast Report | H2 2019
By Kate Gray • Fairmont Homes are underway with a full refurbishment of
Director | Research 17-19 Fullarton Road, Kent Town and expect to occupy in early
kate.gray@colliers.com
2020.
Investment activty remains strong There is currently limited stock available in prime grade in both the
Investment activity in the Fringe and Metro markets has remained Fringe and Metro markets. This restriction has contributed to the
strong with $91.4 million of assets (sales over $5 million) changing stronger supply pipeline, and for larger tenants needing to consider a
hands this year, reaching nearly double the 10-year average of just new building or the CBD as an option.
under $58 million. A major influencer in this boosted volume is due Fringe A Grade gross face rents have grown by 5.1 per cent over the
to the abolishment of stamp duty on commercial transactions which last 12 months and range from $390/sqm to $450/sqm. Inner metro
came into effect in July 2018, making property as a more attractive office rents across all markets have remained stable over the past
investment class. six months, with A Grade rents ranging from $350 to $430/sqm.
There is a large weight of capital in the market, with Adelaide Incentives across all markets have remained stable in the 15-20 per
remaining a higher yield market than the eastern states. However, cent range.
both the Fringe and Metro markets have limited investment grade
stock and therefore the predominate purchasers are owner occupiers Market Outlook
or private investors. The supply pipeline is expected to strengthen over the next 12
months with several pre-commitments underpinning several new
Despite the increased activity in the investment market, yields have
developments. It is also expected that there is more refurbishment
held stable across both Fringe and Metro markets.
activity likely to attract tenants in secondary grade buildings,
The most significant risk in the current investment market is the particularly those with high vacancy. Rental growth, however, is likely
changes to land tax proposed in the latest state budget. Under these to remain limited for existing stock due to the high level of vacancy.
proposed changes, properties which are currently held in different The only area which there is likely to be rental growth is a result
entities - with the same owner - will be aggregated for land tax of new developments which require an economic rent to make it
purposes. The proposal is to cut the top rate to from 3.7 per cent feasible.
to 2.4 per cent with the top bracket reducing to $1.098 million. The
Investment in these markets are expected to remain strong with
new rate is the average of other states. This is also coupled with
returns remaining solid. With the current cuts in interest rates, there
the state revaluation process which is currently underway. Several
is scope for yield compression. This is particularly the case for long
council regions have been completed with reports of increases up to
wale high quality assets. The only downside risk in the investment
100 per cent. This revaluation will have an impact on other statutory
markets is the continuing uncertainty regarding the aggregation of
charges such as land tax, emergency services levy, water charges
land tax.
and possibly council rates. The combination of the revaluation and
the proposed aggregation of portfolios for land tax purposes has
created uncertainty.
Leasing Market
Vacancy across both the Fringe and Metro markets have increased
in the first half of 2019. The Fringe saw vacancy increase to 13.1 per
cent, up from 12.6 per cent in July 2019. This influx is due to several
tenants moving from the Fringe market into other precincts. Over
the second and third quarters we have experienced an increasing
trend of tenants moving from suburban locations to the Fringe, such
as Superloop, Kudos Services, and Metricon as several of the larger
tenants which have leased space in this market this year.
There are several large pre-commitments which are at various
stages of development:
• Thomas Foods – 162 Fullarton Road, Rose Park (2,285sqm) is
under construction and due to complete in early 2020.
• Novita – 341-345 Port Road, Hindmarsh (2,000sqm) is a pre-
commitment yet to commence and is due to complete in early
2022.
• Bridgestone –196 Greenhill Road, Eastwood (2,500sqm) is a
new pre-commitment with an expected completion in 2020.
• Mitsubishi – Adelaide Airport (5,000sqm) due to complete in
67 Greenhill Road, Wayville
late 2020. Sold on behalf of Harmony Property Investments
17METRO OFFICE | Research & Forecast Report | H2 2019
PERTH
OVERVIEW
Market Indicators - September 2019 Tenant flight and downsizing continues to have an adverse impact
on West Perth vacancy; a reversal of improvements over the second
AVERAGE NET FACE RENTS ($/m2) half of 2018. Pending major tenant relocation could see more backfill
Prime Secondary space emerge.
L H L H
$345 $390 $270 $325 West Perth vacancy increased 8,955sqm over the six months to July
2019. This led to the vacancy rate increasing from 14.8 percent to
16.9 percent.
AVERAGE YIELDS
Prime Secondary
L H L H Fringe suburban vacancy also remains a challenge, with net tenant
demand remaining subdued despite stabilising economic activity.
6.75% 7.05% 7.00% 7.75%
AVERAGE CAPITAL VALUE* ($/m2) Flight to quality persists, with modest positive net absorption in
Prime Secondary A-grade stock. B-grade stock recorded negative absorption of
9,794sqm in the six months to July 2019.
L H L H
$5,000 $5,652 $3,661 $4,407
The lower yield environment continues to assist capital values
despite the subdued leasing market. Lower interest rates and bond
SEP-2019 YEAR TO SEP 2020 (F) yield environment is supporting institutional capital raisings, hence
demand likely to remain favourable and yields to continue being
NET SUPPLY relatively tight.
2,887m2 1,595m2
TOTAL MARKET
VACANCY RATE
16.9% 16.1%
West Perth Vacancy Rate Average West Perth Net Face Rents
20% $700
18% 16.9%
$600
Average Net Face Rents ($/m2)
16%
14% $500
12% $400
10%
8% $300
6% $200
4%
$100
2%
0% $0
Jan-11
Jul-11
Jan-12
Jul-12
Jan-13
Jul-13
Jan-14
Jul-14
Jan-15
Jul-15
Jan-16
Jul-16
Jan-17
Jul-17
Jan-18
Jul-18
Jan-19
Jul-19
Mar-10
Sep-10
Mar-11
Sep-11
Mar-12
Sep-12
Mar-13
Sep-13
Mar-14
Sep-14
Mar-15
Sep-15
Mar-16
Sep-16
Mar-17
Sep-17
Mar-18
Sep-18
Mar-19
Sep-19
Direct - Vacancy Factor Sub-lease Vacancy Factor A Grade B Grade
Source: Property Council of Australia, Colliers International Souce: Colliers International
18METRO OFFICE | Research & Forecast Report | H2 2019
By Quyen Quach New supply
Associate Director | Research
quyen.quach@colliers.com New supply is currently limited to just 1,595sqm in a mixed-use
building at 18 Ventnor Street, West Perth, which has been under
Soft net tenant demand causes West Perth vacancy construction since 2014.
to rise
During the next year, major supply outside of West Perth will include
Key indicators suggested West Perth’s office market remained a new office for ABN Group at 303 Vincent Street in Leederville
mostly stable over financial year 2018-19. Rents and incentives were and 6,930sqm of office space in a new NextDC facility on Lord
relatively stable, however competition from the CBD and other CBD Street, Perth. These will follow and be in-addition to the 24,003sqm
fringe locations resulted in West Perth’s vacancy increasing to 16.9 of space coming on in 2020 from Sirona Capitals Kings Square
percent in the six months to July 2019 compared with 14.8 percent redevelopment in Fremantle and the long-awaited delivery of space
in January 2019. The increase in vacancy was driven by 7,288sqm of in 500 Hay Street, Subiaco. In total, approximately 43,148sqm of new
negative net absorption since January 2019. supply will be added by the end of 2021.
The rise in aggregate vacancy was largely driven by the increase in Rents stabilising
vacant B grade space of 9,794sqm. This was the combined result
Despite the subdued leasing environment, rents have generally been
of 7,295sqm of negative net absorption and a return to stock of
stable over the six months to September 2019. However, A-grade
2,499sqm of vacant refurbished space. Subsequently the B-Grade
rents have fallen slightly in the past year as a result of increased
vacancy jumped to 19.1 percent from 13.7 percent in January 2019. At
competition from Prime-grade CBD space. The recent increase in
the same time the flight to quality delivered a marginal contraction in
vacancy in West Perth could cause further downward pressure on
the A-grade vacancy, which declined to 11.2 percent.
West Perth and suburban rents. Competition from CBD A-grade
The bottoming out of the investment spending curve is assisting the space will likely be strong as this class of space also recorded a
recovery of white-collar employment in the Perth CBD and West notable increase in vacancy in the six months to July 2019. The
Perth. However, the West Perth market is still having to deal with combined Premium and A-grade vacancy in the CBD is now slightly
tenants being lured towards more central, prominent and better- higher than the combined vacancy in secondary (B, C and D) grade
quality buildings in this environment of subdued net tenant demand. buildings.
Additionally, recent new CBD supply and resultant backfill space has Low yields will further underpin leased asset
not helped West Perth and suburban landlords reduce their vacancy. demand
Neither has the trend towards increased ratio of desks per square The interest in investment-grade assets has persisted despite WA’s
metre of occupied space; as tenants seek higher space use efficiency subdued economic conditions, and competition for available assets is
and lower occupancy costs. significant as investors look for counter-cyclical opportunities. At the
However, investment in the pipeline is continuing to recover and WA’s same time, purchasers seeking ‘Core’ investments are continuing to
employment and population growth have been improving over the chase West Perth assets with strong lease covenants and cashflow.
past 2 years. Importantly, net migration has returned to growth and This has driven A-grade yields 30 basis points lower, to an average
these are expected to gradually generate additional economic activity of 6.85 percent compared to a year ago.
and office space demand.
Fringe and outer suburban office market conditions
also subdue
Colliers International recently performed an update survey on several
suburban office markets and found they were still struggling with
elevated vacancy levels. In the CBD fringe Northbridge/Stirling
Street precinct, vacancy was 19.3 percent in September 2019; a
slight improvement on the 20.4 percent recorded in September 2018
but still historically high.
In the Great Eastern Hwy precinct, which includes Victoria Park,
Burswood, Rivervale and Belmont, the vacancy rate was 19.5 percent
in September 2019, up from 16.5 percent recorded some four and
half years ago in February of 2015.
For the first time, Colliers surveyed vacancy in the Applecross and
Booragoon precinct. It is one of the smaller office precincts with just
48,713sqm of office assets with NLA over 1,000sqm, but increasing
development activity in the area will likely result in increased stock in
the future. As of September 2019, Colliers estimates the vacancy to
be 14.2 percent or 6,938sqm. The Pinnacle, 30–34 Charles Street, South Perth
Leasing and Managing on behalf of Zone Q
19METRO OFFICE | Research & Forecast Report | H2 2019
NEWCASTLE
OVERVIEW
Market Indicators - September 2019 Tenant enquiry increasing post Election as business confidence
improves.
AVERAGE NET FACE RENTS ($/m2)
Prime Secondary
Continued A Grade gross face rental growth as vacancy rates remain
L H L H
at record low levels.
$385 $420 $235 $275
New development pipeline increasing A Grade market, with the recent
AVERAGE YIELDS
completion of Gateway Stage 2 and construction commencing on 6
Prime Secondary
Stewart Avenue.
L H L H
6.50% 7.00% 7.00% 7.45%
Mooted development has the potential to increase A grade stock level
by 41% pending tenant pre-commitment.
AVERAGE CAPITAL VALUE* ($/m2)
Prime Secondary
L H L H Market fundamentals and weight of capital result combine to re-rate
the Newcastle investment market, demonstrated by the recent sale of
$6,170 $7,150 $3,300 $3,800
18 Honeysuckle Drive.
SEP-2019 YEAR TO SEP 2020 (F)
NET SUPPLY
10,500m2 Nil
TOTAL MARKET
VACANCY RATE
3.0%
1.7%
A Grade Yield Spreads Gross Face Rents and Incentives
12.00% 550 16.00%
500 14.00%
10.00%
12.00%
450
8.00% 10.00%
400
8.00%
$/sqm
6.00%
350
6.00%
4.00% 300
4.00%
2.00% 250 2.00%
200 0.00%
0.00%
Dec-09
Jun-10
Jun-12
Jun-14
Jun-16
Jun-18
Jun-15
Jun-19
Jun-13
Jun-17
Dec-10
Dec-12
Dec-14
Dec-16
Dec-18
Dec-15
Dec-13
Jun-11
Dec-17
Dec-11
Jun-09
Dec-09
Sep-09
Jun-10
Jun-12
Jun-16
Jun-14
Jun-18
Jun-15
Jun-19
Jun-13
Mar-10
Jun-17
Mar-12
Mar-14
Mar-16
Mar-18
Mar-15
Mar-19
Dec-10
Mar-13
Sep-10
Mar-17
Sep-12
Dec-12
Sep-14
Dec-14
Dec-16
Dec-18
Sep-15
Dec-15
Sep-16
Sep-18
Sep-13
Dec-13
Dec-17
Jun-11
Sep-17
Mar-11
Dec-11
Sep-11
A Grade Spread A Grade Yield 10Y Bond A Grade Incentive A Grade Gross Face Rent B Grade Gross Face Rent
Source: Colliers International Source: Colliers International
20You can also read