2021 Sales Ratio Criteria - Issued October 2020 Property Tax Data & Analysis Unit - Minnesota Department of Revenue
←
→
Page content transcription
If your browser does not render page correctly, please read the page content below
2021 Sales Ratio Criteria
 Issued October 2020
 Property Tax Data & Analysis Unit

2021 Sales Ratio Study Criteria 1
Table of Contents
Table of Contents ............................................................................................................................................. 2

Changes for the 2021 Study.............................................................................................................................. 4

Items of Note ................................................................................................................................................... 4

Overview of the Sales Ratio Study .................................................................................................................... 5

 State Board of Equalization ................................................................................................................................... 5
 Tax Court ................................................................................................................................................................ 6
 Adjusted Net Tax Capacities .................................................................................................................................. 8
 Railroad and Utility Equalization............................................................................................................................ 8
 Economic Market Values ....................................................................................................................................... 8
Sales Ratio Methodology ................................................................................................................................. 8

 Sales Reporting ...................................................................................................................................................... 9
 eCRV Submission Timeline ................................................................................................................................ 9
 Primary Parcel ID for Multi-Parcel Sales ............................................................................................................ 9
 Combining multiple eCRVs into one good sale: ................................................................................................ 9
 Determining Sales Ratio Property Types ......................................................................................................... 10
 Reporting Special Assessments ....................................................................................................................... 13
 Reporting Water Value Influence .................................................................................................................... 13
 Rejecting Sales from the Study ........................................................................................................................ 14
 Sales Listings .................................................................................................................................................... 16
 PRISM Reporting .................................................................................................................................................. 17
 Sale Price Adjustments ........................................................................................................................................ 18
 Financing Adjustments .................................................................................................................................... 18
 EMV Adjustments ................................................................................................................................................ 19
 Net Improvements .......................................................................................................................................... 20
 Exempt Value ................................................................................................................................................... 22
 Stratification ........................................................................................................................................................ 22
 Property Types................................................................................................................................................. 22
 Property Type Aggregations ............................................................................................................................ 25

2021 Sales Ratio Study Criteria 2
Regions ............................................................................................................................................................ 27
 Determining Extremes ......................................................................................................................................... 29
 Market Condition Trends ..................................................................................................................................... 31
 Trend Appeals .................................................................................................................................................. 33
 Market Condition Adjustments ........................................................................................................................... 34
 Market Condition Adjustment Examples ........................................................................................................ 35
 Ratios ................................................................................................................................................................... 36
 Preliminary Ratios............................................................................................................................................ 36
 Final Ratios ...................................................................................................................................................... 37
 Assessment Statistics ........................................................................................................................................... 37
 Price Related Differential ................................................................................................................................ 37
 Price Related Bias ............................................................................................................................................ 38
 Small Sample Study .............................................................................................................................................. 40
Reports .......................................................................................................................................................... 41

2021 Study Timeline....................................................................................................................................... 43

Reject Reason Definitions .............................................................................................................................. 44

Joint City Regions ........................................................................................................................................... 53

Agricultural/Rural Vacant Region Map ........................................................................................................... 57

2020 Sales Ratio Study Criteria 3
Changes for the 2021 Study
 • Final Extremes are no longer calculated. All ratios will be included in the statistics calculations.
 Extremes will continue to be calculated for Market Condition Trends only.

 • A flow chart has been added to show how Commercial and Industrial sales are used to determine
 Tax Court ratios.

 • Commercial / Industrial Aggregation (PT94) definition has been added to the Property Types
 Aggregations table.

Items of Note
 • The 2021 criteria should be used to code eCRV sales from October 1, 2020 – September 30, 2021, but
 the study methodology (e.g., calculating trends, ratios and extremes) applies to sales from January 1,
 2020 – September 30, 2021. The criteria for coding eCRVs from January 1, 2020 – Sept 30, 2020 can be
 found in the 2020 criteria.

 • Mean Ratio, and Aggregate Mean Ratio have been removed from the Ratio Print reports. These
 measures were also removed in the 2020 Study reports.

2020 Sales Ratio Study Criteria 4
Overview of the Sales Ratio Study
In order to evaluate the accuracy and uniformity of assessments within the state and to ensure compliance with
property tax laws, the Minnesota Department of Revenue conducts an annual sales ratio study. The Sales Ratio
Study is required by Minnesota Statute 270.12. The study measures the relationship between appraised values
and actual sale prices, indicating both of the level of assessment (how close appraisals are to market value on an
overall basis) and the uniformity of assessment (how close individual ratios are to the median ratio and each
other). As a mathematical expression, a sales ratio is the assessor’s estimated market value (EMV) of a property
divided by its sales price, as seen here:

 Assessor's Estimated Market Value
 Sales Ratio =
 Sales Price
The Sales Ratio Study is the culmination of the ongoing process of collecting and verifying sales information. The
State of Minnesota requires the reporting of sales information on an electronic Certificate of Real Estate Value
(eCRV) in Minnesota Statute 272.115. Assessors must verify and review sales information reported through
eCRV before it can be used in the study. Sales must meet certain criteria to be included in the study, and these
criteria are outlined in this document. These sales are then summarized and analyzed to make generalizations
about the market and the assessment for the Sales Ratio Study. The Department of Revenue’s Property Tax Data
& Analysis Unit, and Property Tax Compliance Officers (PTCOs) perform and review the Sales Ratio Study,
working closing with county assessors and staff.

The Sales Ratio Study is primarily used for the following purposes:

 • State Board of Equalization
 • Tax Court
 • Adjusted Net Tax Capacities
 • Railroad and Utility Equalization
 • Economic Market Values

More information on how sales are studied for each of these purposes can be found in the following sections.

Beyond its primary uses, information from the study can be used for many other purposes. The study provides
assessors with important information for refining the upcoming assessment, evaluating the existing assessment,
and identifying inequities in an assessment. Legislators use information from the study when developing tax
policy. Property owners may also use the studies if they have concerns about unfair or inequitable treatment by
their assessor.

State Board of Equalization
The Minnesota State Board of Equalization uses a 12-month forward-adjusted study to review overall levels of
assessment. The study period for the 2021 State Board of Equalization study is October 1, 2020 through
September 30, 2021. This study adjusts sale prices by a determined market trend to estimate what the ratio

2020 Sales Ratio Study Criteria 5
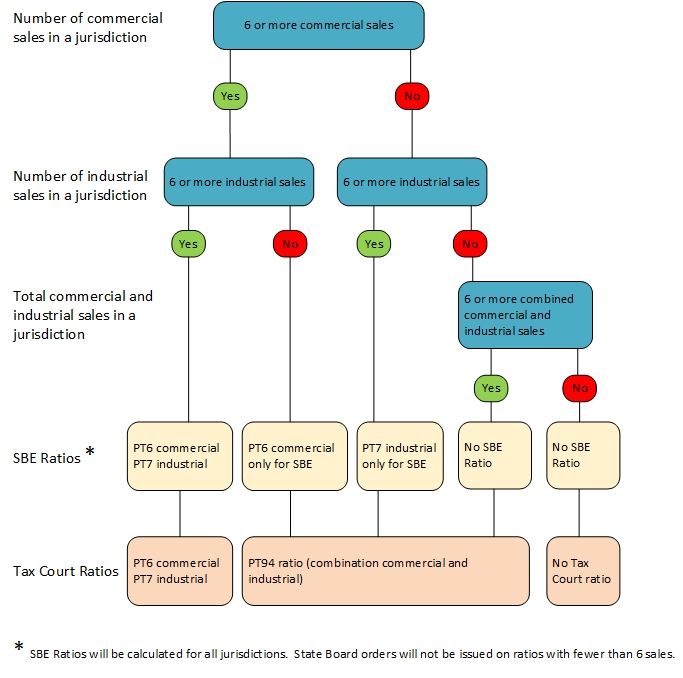
would be if the sale took place January 2, 2022. The State Board of Equalization study determines the median
sales ratio for each jurisdiction by property type.

The Commissioner of Revenue constitutes the State Board of Equalization, and in that capacity is empowered to
reduce disparities in assessment levels between counties and among the property types within counties. When
the State Board of Equalization determines that there has been an unfair or inequitable assessment, the
Commissioner is authorized under Minnesota Statute 270C.94 to order a reassessment of any jurisdiction in
order to make a correction.

Tax Court
The Minnesota Tax Court uses both a 9-month and a 12-month study when reviewing property valuation cases
under Minnesota Statute 278.05. The study period for the 2021 9-month Tax Court study is January 1, 2021
through September 30, 2021. The study period for the 2021 12-month Tax Court study is October 1, 2020
through September 30, 2021. For both of these studies, sales prices are adjusted by a determined market trend
to estimate what the ratio would be if the sale took place on January 2, 2021. The Tax Court study determines
the median sales ratio for each jurisdiction by property type.

The Tax Court uses the Tax Court studies to measure unequal levels of assessment within property types. The
Tax Court prefers to use the 9-month study, for which all sales are backward-adjusted, because all sales occur
after the assessment date.

When determining Tax Court ratios, separate commercial and industrial ratios will be determined if each of
these property types have at least 6 sales. However, if both of those property types do not have at least 6 sales,
a combined ratio (PT 94) will be determined based on the combination of those property types.

2020 Sales Ratio Study Criteria 6
2020 Sales Ratio Study Criteria 7
Adjusted Net Tax Capacities
The Department of Revenue uses a 21-month backward-adjusted study to calculate adjusted net tax capacities
(ANTCs), as established by Minnesota Statute 273.1325. The study period for the 2021 21-month ANTC study is
January 1, 2020 through September 30, 2021. This study adjusts all sales that occur in 2020 backward to January
2, 2020 and all sales that occur from January 1, 2021 through September 30, 2021 backward to January 2, 2021
using a determined market trend to estimate what the ratio would be if the sale took place at the time of
assessment. A weighted median sales ratio for each jurisdiction is calculated to be used for school and local
government aid calculations as well as a variety of levy apportionments.

Railroad and Utility Equalization
The Department of Revenue uses a 12-month forward-adjusted study to equalize railroad and utility values
under Minnesota Statute 270.86. The study period for the 2021 State Board of Equalization study is October 1,
2020 through September 30, 2021. This study adjusts sale prices by a determined market trend to estimate what
the ratio would be if the sale took place at the time of assessment (January 2, 2022). The Railroad & Utility
Equalization study uses a median sales ratio of all commercial and industrial sales by county.

Economic Market Values
The Department of Revenue uses a 12-month study to calculate a jurisdiction/s economic market value (EcMV).
The study period for the 2021 EcMV study is October 1, 2020 through September 30, 2021. This study adjusts
sale prices by a determined market trend to estimate what the ratio would be if the sale took place on January
2, 2021. Median sales ratios by property type for each jurisdiction are used to calculate a weighted market value
for the jurisdiction. Bonding companies use the EcMV to measure fiscal capacities for bond rating calculations.

Sales Ratio Methodology
This section describes the methodology employed by the Department of Revenue to perform the Sales Ratio
Study, from collecting sale information to issuing final ratios. This methodology applies to all uses of the Sales
Ratio Study outlined in Overview of the Sales Ratio Study. Any differences in the methodology between uses will
be noted. The 2021 Sales Ratio Study will analyze sales that occurred between January 1, 2020 and September
30, 2021.

The methodology can be broken down into several steps. The Department of Revenue collects sale information
through eCRV and assessment information through PRISM. The sale price of a property reported in eCRV and
the EMV of a property reported in PRISM are used to calculate a sales ratio for each sale. Sale prices may be
adjusted based on the terms of the sale, and EMVs may be adjusted based on the presence of net improvement
and/or exempt value. Sales are then stratified into representative groups based on their property type, county,
city/township, and water influence status. Outlier sales within these representative groups are identified as
extreme. A market condition trend is then determined for each representative group. If there is evidence of a

2020 Sales Ratio Study Criteria 8
market condition trend for a representative group, the trend will be applied to the sale prices of all sales in that
group in order to determine what the prices would have been if the sale had occurred in January 2022. These
adjusted sale prices are then compared to EMVs to determine each sales ratio, which are then aggregated and
analyzed by county, city/township, property type, and water influence status. Each of these steps are further
detailed in the following sections.

Sales Reporting
Sales information is the basis of the Sales Ratio Study. In Minnesota, all real estate transactions over $1,000
must be reported on an electronic Certificate of Real Estate Value (eCRV) according to Minnesota Statute
272.115. On January 1, 2021, this consideration amount will increase to $3,000.

Counties and the Department of Revenue use the sale information reported on an eCRV to verify the sale,
determine the sale’s eligibility for the study, and perform the Sales Ratio Study.

The following sections will define how sales information should be reported and how it will be used in the study.

eCRV Submission Timeline
The 2021 Sales Ratio Study will include sales that occurred from January 1, 2020 through September 30, 2021.
For sales that occur in this period, only those sales with an eCRV that is accepted by the county by November 1,
2021 will be included in the 2021 Study. Note that sales that do not meet this deadline for the 2021 Study will
still be used in the 21-month studies of the 2022 Sales Ratio Study, assuming they meet all other criteria.

Sales included in the 2021 Study must be submitted to the Department of Revenue by 5 p.m., November 10,
2021. This deadline is necessary to allow county assessors and PTCOs sufficient time to review the reports issued
by the Department of Revenue, for counties to appeal applied market condition trends, and for the
Department’s appeals panel to meet and review appeals. See Trend Appeals for more information on the
appeals process.

More information on eCRV can be found on the Department’s website.

Primary Parcel ID for Multi-Parcel Sales
If there are multiple parcels included in a sale, the county must identify which parcel is the primary parcel. The
primary parcel ID for the sale will appear on the county sales listing. It is important that all non-primary parcels
are also reported on eCRV so that the Department of Revenue can accurately determine the total EMV for the
sale. See Sales Listings for more information.

Combining multiple eCRVs into one good sale:
When a property sells with two or more eCRVs they may be combined into one “good” sale. To determine if the
eCRVs should be combined, consider the following:

2020 Sales Ratio Study Criteria 9
• If one of the deed types is subject to a possible finance adjustment (i.e. CD) and the other is not (i.e.
 WD), then the two eCRVs should not be combined.
 • The purchase price needs to have been negotiated as a group, and not as individual owners (county
 will need to verify this).
 • A note needs to be made on each eCRV that clearly explains that the county has combined this eCRV#
 with another eCRV# to make one good sale.
 • The sale/s that are combined with the another eCRV will need to be rejected (Reject reason 4).

The single combined eCRV must reflect all of the information from the individual eCRVs. Combine totals for:
parcel numbers, sales price, deeded acres, tillable acres, structures, conservation data, etc. Do not include legal
descriptions and buyer/seller names.

An optional text box is available when a county accepts a sale for the state study. This is where you can state
what eCRV numbers and values were combined with this sale. We do not want this information only in workflow
notes so others may see it.

Determining Sales Ratio Property Types
Property types are determined for each sale based on the information reported on the eCRV. Each sale can only
be assigned one sales ratio property type. Accurate reporting of the following fields is critical for ensuring that
sales get assigned the correct sales ratio property type:

 • Property Type Group—County tab, under Property Types

 The Property Type Group describes generally the type of property included in the sale. For guidance on
 classifying commercial or industrial sales, see Reporting Commercial and Industrial Sales.
 • Primary Type for Study Indicator—County tab, under Property Types

 This indicator determines which Property Type Group reported for a sale will be used to determine the
 sales ratio property type. Generally, the Property Type Group with the most value should be the primary
 type, but there are many exceptions to this rule. Contact your PTCO with any questions.
 • Land/Building Indicator—Property tab, under Property Description Questions

 This indicator describes whether Land and Buildings, Land only, or Buildings only were included in the
 sale, to determine if the sale should classified as a bare land sales ratio property type.
 • Deeded Acres—Property tab or County tab, under County Data

 The deeded acres field describes whether an agricultural/rural vacant sale is more or less than 34.5
 acres. This field is necessary only for agricultural and rural vacant sales.
 • Agricultural Classification Acreage—County tab, under Property Types

 For sales with both agricultural and rural vacant property types, the acreage amounts from the
 classification table will used to determine whether a sale is considered 2a, 2b, or mixed. This table is
 necessary only for agricultural and rural vacant sales. For guidance on classifying 2a and 2b land, see
 Reporting Agricultural and Rural Vacant Sales.

2020 Sales Ratio Study Criteria 10
For a list and description of the sales ratio property types, see Property Types. The Sales Ratio Property Types
document on our website describes how information from eCRV is translated into sales ratio property types.

If the Department of Revenue cannot determine the sales ratio property type from the information reported on
the eCRV, the sale will be flagged on the county’s sales listing for further review. See Sales Listings for more
information.

Reporting Commercial and Industrial Sales

It can sometimes be difficult to classify a property as either commercial or industrial. In an effort to ensure that
sales are classified consistently across the state and to provide clarity to counties, the Department of Revenue
recommends the following property uses be classified as Industrial for the Sales Ratio Study:

 • Self/mini-storage
 • Warehouses, including general, distribution, office, R&D/engineering, refrigerated, computer/data,
 and transit
 • Manufacturing, including food processing, agribusiness related, high tech, general light, and general
 heavy
 • Energy (not utility), including fuel production, fuel storage, refinery, wind energy conversion systems,
 and solar energy conversion systems
 • Grain elevators
 • Mineral deposits
 • Gravel pits
 • Waste/recycling

Any use not listed above should be considered commercial for the Sales Ratio Study. Deviations from these
recommendations are allowed with an explanation in eCRV. Consult with your PTCO on any questionable
properties.

A change in use from commercial to industrial or industrial to commercial should not be rejected as a use
change, as both uses reside with the same class (3a). Within eCRV, under the County Tab > Property Types, the
‘Property Type Group’ should be based on the Buyer’s planned use of the property. As always if there are
extenuating circumstances with a sale, contact your PTCO.

Sales of Property with both Commercial and Industrial use

Sales of properties with both commercial and industrial use, shall be placed in the property type (commercial or
industrial) in which the majority of the value is assigned. Properties where a single building includes both a
commercial and industrial use shall be classed according to the predominant use of the building, either all
commercial or all industrial. Properties containing multiple buildings may be classed by individual building as
above. For example, a property having a mini-storage and a convenience store on the same parcel, would
require a split class, commercial/industrial.

2020 Sales Ratio Study Criteria 11
Reporting Agricultural and Rural Vacant Sales

In addition to reporting deeded acres, the Sales Ratio Study requires reporting the number of acres in 2a and 2b
land identified as tilled, pasture, meadow, woods, waste, exempt wetland, exempt native prairie land,
ditch/road, first acre site value, non-HGA additional site value, and other. In many parts of the state, sales will
include a mixture of 2a and 2b lands. The acreage detail allows the Department of Revenue to assign the correct
sales ratio property type to each sale. See Property Types for more information. Accurate reporting of the
acreage detail is also critical for determining each county’s Green Acres value.

Definitions for each of the 2a/2b classifications are consistent across eCRV and PRISM. Definitions for each
classification type can be found below.

 • Tilled: Real estate devoted to, or cultivated productively for, the annual growing of agricultural
 products for sale, or that is tillable even if currently fallow.
 • Pasture: Non-tillable real estate on which grass or other vegetation eaten as food by grazing animals
 grows, which is set aside for use by domestic grazing animals as part of a farm or ranch. (This usually
 requires fencing to restrict animal movement. Pasture land may include stands of trees if used for
 grazing by domestic animals.
 • Meadow: Non-tillable real estate serving as a habitat of rolling or flat terrain where grasses
 predominate, typically containing a significant variety of annual, biennial and perennial plants.
 Meadow is grass land from which hay could be cut, distinguished from tilled land where alfalfa has
 been sown.
 • Woods: Non-tillable real estate having stands of trees, including integral open space, and including
 felled areas that are awaiting restocking. Woodlands may support an understory of shrubs, herbs, or
 grasses. Some stands of trees could be considered “pasture” if used for grazing by domestic animals.
 • Waste: Non-tillable real estate that cannot be used economically for agricultural use or production.
 Such land types include blowouts, river wash, marshes, swamps, sloughs (including wetlands covered
 all or part of the year with water, but not so deeply or permanently as to be classified as water surface
 per se), badlands, steep hillside, large deep gullies (including streambeds and banks, bluffs, and rock
 land).
 • Ditches and Roads: Road, road right-of-way, and ditch acres that are included in deeded acres.
 • Other: Any 2a or 2b land not included in the defined categories.
 • 1st Acre Site: First acre of a building site (1st acre of HGA).
 • Non-HGA Site: Building site in excess of 1st Acre Site.

eCRV also allows counties to report acreage information related to exempt wetland and exempt native prairie
land, if applicable. See the definitions below:

 • Exempt Wetland: As defined by Minnesota Statute 272.02, Subd. 11, "wetlands" means:
 o Land described in section 103G.005, subdivision 15a (as public wetlands);

2020 Sales Ratio Study Criteria 12
o Land which is mostly under water, produces little if any income, and has no use except for
 wildlife or water conservation purposes, provided it is preserved in its natural condition and
 drainage of it would be legal, feasible, and economically practical for the production of livestock,
 dairy animals, poultry, fruit, vegetables, forage and grains, except wild rice; or
 o Land in a wetland preservation area under sections 103F.612 to 103F.616.

 "Wetlands" under clauses (i) and (ii) include adjacent land which is not suitable for agricultural purposes
 due to the presence of the wetlands, but do not include woody swamps containing shrubs or trees, wet
 meadows, meandered water, streams, rivers, and floodplains or river bottoms.
 • Exempt Native Prairie: Land defined by Minnesota Statute 272.02, Subd. 12, and determined by the
 Commissioner of the Department of Natural Resources as native prairie. Pasture land used for
 livestock grazing purposes is not considered native prairie.

Reporting Special Assessments
In most cases, the inclusion of special assessments in the study can complicate the determination of the sale
price without significantly improving accuracy. Special assessments for a sale should only be reported in eCRV if
the buyer paid off delinquent special assessments and delinquent taxes owed on the property. These are costs
that the buyer assumes in order to complete the transaction and are necessary for understanding the terms of
the sale. Current and future special assessments that the buyer pays are generally considered the cost of owning
the property rather than the cost of buying the property and do not need to be reported. This field can be found
on the Sales Agreement tab of eCRV.

There may be special circumstances in which non-delinquent special assessments should be reported. Discuss
any non-delinquent special assessments that should be included in the study of the sale with your PTCO. A
manual adjustment to the sale price can be made for any buyer paid special assessments that had a known
effect on the sale price. See Sale Price Adjustments for information on how special assessments are used in the
study.

Reporting Water Value Influence
If the sale was influenced by the presence of water, water value influence must be reported on eCRV. Water
value influence is necessary to determine whether a sale should be considered on-water or off-water for the
purposes of the Sales Ratio Study (see Regions for more information on how water influence affects the study).
This field can be found on the County tab, under Property Attributes. The available water influence options are
defined below, including how they are used in the Sales Ratio Study. These definitions are consistent with PRISM
water codes.

 • Lake: Sale of a property physically located on, or having immediate access to, a lake with a valid DNR
 Water Code. This includes properties with egress accessibility, properties located across the road with
 a dock, and properties with shared immediate access and views. These sales will be considered on-
 water for the Sales Ratio Study.

2020 Sales Ratio Study Criteria 13
• River: Sale of a property physically located on, or having immediate access to, a river with a valid DNR
 Water Code. This includes properties with egress accessibility, properties located across the road with
 a dock, and properties with shared immediate access and views. These sales will be considered on-
 water for the Sales Ratio Study.
 • Pond, Creek, or Stream: Sale of a property physically located on, or having immediate access to, a
 pond, creek, stream, or other small body of water. These bodies of water should not have DNR issued
 IDs. Anything with a valid DNR issued ID should be reported as a lake or river. These sales will be
 considered on-water for the Sales Ratio Study.
 • Other: Sale of a property that does not qualify for the other indicator types but has some sort of water
 influence. This includes but is not limited to properties across the road from a body of water with no
 egress accessibility or dock and properties with shared immediate access to a body of water but with
 no views. These sales will be considered on-water for the Sales Ratio Study.
 • Swamp or Slough: Sale of a property physically located on, or having immediate access to, a swamp or
 slough. These sales will be considered off-water for the Sales Ratio Study.
 • None: Sale of a property that is not on any type of water and does not have any water influence on
 value. These sales will be considered off-water for the Sales Ratio Study.

In some cases, a pond, creek, or stream may have no influence on the value of a property and a swamp or
slough may have an influence on the value of the property. In these cases, the county should consult with their
PTCO on assigning these sales a different water influence so they may be more appropriately studied as either
on-water or off-water.

Counties may elect to remove the consideration of water influence in their county for the purposes of the Sales
Ratio Study. Consult with your PTCO if you think there is little water influence in your county, and notify Data &
Analysis if you would like the consideration of water influence removed for your county. If your county elects to
remove the consideration of water influence in your county for the purposes of the Sales Ratio Study, water
influence information will be ignored for the purposes of the Sales Ratio Study only. Water influence on a sale
should still be accurately reported on eCRV, and water codes for each property should still be accurately
reported in PRISM. This information may be used for other purposes beyond the Sales Ratio Study.

Rejecting Sales from the Study
All open market, arm’s-length sales should be included in the Sales Ratio Study. An “open market sale” is one in
which the buyer and seller are acting prudently and the price is not affected by undue stimulus. Neither the
buyer nor the seller are under great pressure to complete a transaction in a short time. An “arm’s-length sale” is
between two parties, both of whom are seeking to maximize their gain from the transfer. Open market, arm’s-
length sales that are included in the Sales Ratio Study are referred to as “good” sales.

Sales must be verified to determine if it was an open market, arm’s-length transaction. Counties must perform
sales verifications. The Department of Revenue does not verify sales.

2020 Sales Ratio Study Criteria 14
If a sale is determined to not be an open market, arm’s-length sale, it may be rejected from the study. The reject
field in eCRV can be found on the County tab, under County Data. Counties recommend a reject reason, and
PTCOs confirm or deny this recommendation. The table below lists the reject reasons available in eCRV, along
with the old sales file code associated with that reason. Detailed explanations and criteria for each reject reason
can be found in Reject Reason Definitions.

Sale Reject Reason Codes

 18 – a. Default (on contract for deed),
 02 - Relative Sale
 b. Rewrite of Terms
 03 – a. Exempt Party, b. Government Agency Sale 19 - Relocation
 04 - Partial Interest Sale 20 - Leaseback
 05 – Statutory Classification Change 21 - Bank Sale (including HUD sales)
 06 – a. Income Guarantees, b. Non-cash, c. Unusual
 22 - Below Minimum Down Payment
 Financing
 07 – a. Physical Change, b. Renovation 23 - Sale Under Minimum
 08 – a. Correction Deed, b. Quit Claim Deed 24 - Multi County Sale
 25 – a. Agricultural Preserve,
 09 – a. Estate Sale, b. Gift, c. Trade
 b. Assessment Agreement
 10 - Prior Interest Sale 26 - Not Typical Market
 12 - PTCO Instructed Reject 27 - Court Ordered Value
 14 – a. Contract Payoff, b. Mortgage Assumption 29 - Allocated Sale Price
 15 – a. Forced Sale, b. Foreclosure, c. Legal Action,
 30 - Assessor Restricted Value
 d. Short Sale
 16 – a. Split/Combined Sales, b. Value Not Available 31 - Assemblage
 17 - Excessive Non-Real Property

These reject reasons are not strict rules for rejection. A sale that may meet reject criteria can still be considered
an open market, arm’s-length transaction. Consult with your PTCO on any questionable rejections. The
circumstances of each sale should be considered individually. A rejected sale will not be used in any studies in
any year, including State Boards, Tax Court, and Adjusted Net Tax Capacities.

County Study or State Study

In eCRV, a user has the option to reject a sale in two different ways on the County tab, under County Data: the
state study and the county study. There are many circumstances in which a sale should not be included in the
Department’s Sales Ratio Study but the county may want to consider the sale good for their internal studies, or
vice versa. Rejections for the county study are ignored by the Department. If a sale should not be included in the
Department’s Sales Ratio Study, please ensure that the correct recommendation is made for the state study.

2020 Sales Ratio Study Criteria 15
Split Sales

Agricultural and rural vacant split sales should be included in the Sales Ratio Study. For example, if a farmer sells
40 acres from a 160-acre farm, this would be considered a good split sale. Agricultural and rural vacant split
sales consisting of fewer than 34.5 acres should NOT be included in the study. Split sales that are not agricultural
or rural vacant should also be rejected from the study.

When a good split sale occurs, the county assessor must ensure that the value is split promptly and a new parcel
ID is assigned so that these sales can be properly analyzed for the study.

Resales

If a property sells more than once within the study period, only the most recent good sale is included in the
study. Older sales will be automatically removed from the study by the Department of Revenue based on
matching parcel IDs. The county should not reject resales in eCRV if they were otherwise good, open market,
and arm’s-length transactions.

Net Improvements

There are certain situations where, due to net improvements on the property, a sale price cannot be reasonably
compared to the necessary EMVs. In the following situations, the sale should be rejected from the study:

 • If net improvements occurred after the assessment date but before the sale, the sale should be
 rejected. In these cases, the assessed net improvement amount may be affected by the sale price so
 the study cannot accurately measure a county’s assessing level.
 • If the sale occurred between October 2020 and December 2020 and net improvements occurred after
 the sale but before the 2021 assessment, the sale should be rejected. If these sales were accepted, the
 2022 EMV would have to be adjusted by 2020 net improvement value which might have been
 impacted by market forces in the 12+ months since the improvement.
 • Only positive Net Improvements should be entered.

For more information, see the Net Improvement EMV Adjustments flow chart, which describes whether a sale
with net improvements should be accepted or rejected, and how the accepted sales will be adjusted.

Sales that occurred between January 2020 and September 2020 were already accepted or rejected in the 2020
Study. Those accepts and rejects still apply for the 2021 study.

Sales Listings
The Department of Revenue compiles the information reported through eCRV into sales listings for each county
for all good sales in the study period. These sales listings are issued to each county regularly to represent the
data that the Department will use to perform the study. It is each county’s responsibility to ensure that the
appropriate sales are being included in the study and that the information for each sale is correct. Data &
Analysis performs audits on all sale data to help identify and flag sales that may require additional review. These

2020 Sales Ratio Study Criteria 16
flags will also be displayed on the sales listing. See the Sales Listing Companion document for more details about
the information provided on the sales listings. Counties should notify their PTCO of errors on the listing as early
as possible so that they can be corrected in eCRV.

A listing of rejected sales will also be created for each county for the study period.

PRISM Reporting
Counties are required to send the Department of Revenue four parcel-level PRISM files each year. Parcel
information from PRISM is matched with sale information from eCRV based on parcel ID.

Land, building, and net improvement EMVs from the following PRISM files will be used in the 2021 Sales Ratio
Study:

 • PRISM Submission 2: 2020 Adjusted Assessment. The EMVs on this file will be used to calculate market
 condition trends. See Market Condition Trends for more information.

 • PRISM Submission 2: 2021 Adjusted Assessment. The EMVs on this file will be used to calculate
 preliminary ratios. See Preliminary Ratios for more information.

 • PRISM Submission 1: 2022 Preliminary Assessment. The EMVs on this file will be used to calculate final
 ratios. See Final Ratios for more information.

Exempt values reported on these PRISM files will also be used in the 2021 Study. Exempt values are only
required to be reported to the Department of Revenue every six years on PRISM Submission 2. The last exempt
reporting year was 2018 and the next is 2023. However, counties have the option to report exempt values on
PRISM Submission 2 in any year.

If a county reports exempt values on any given Submission 2, those values will be used to adjust EMVs. See EMV
Adjustments for more information on what is adjusted and when. If a county chooses to report exempt values in
a non-required reporting year, there is no requirement that the values be updated from the last required
reporting year. Choosing to report exempt values in non-required years may help counties reduce time spent
editing sales information for the study and will improve the accuracy of the Sales Ratio Study.

The county should pay particular attention to the EMVs on their sales listing. EMVs reported in PRISM can be
overridden for Sales Ratio Study purposes in eCRV. Notify your PTCO if an EMV needs to be changed in eCRV.
Exempt values will not be added to EMVs overridden in eCRV. If there is exempt value that should be included in
the EMV for the purposes of comparing the assessed value to the sale price, the value should be entered into
eCRV under an “Exempt” Property Type Group on the County tab, under Property Types.

For more information on PRISM, see the PRISM webpage. Please notify Data & Analysis if you would like to see
other PRISM information on the sales listings.

2020 Sales Ratio Study Criteria 17
Sale Price Adjustments
In order to determine a market sales price, the Department of Revenue may adjust a sale’s gross sale price by
several factors included in the terms and financing of the sale. These adjustments allow the sale price to be
compared to the assessor’s EMV.

The net sale price is the gross sale price after adjusting for the terms and financing of the sale. See the equation
for net sale price below.

 Net sale price = Gross sale price − personal property − seller paid points +
 delinquent special assessments and delinquent taxes paid by buyer +
 financing adjustments

Gross sale price, personal property, seller paid points, and delinquent special assessments and delinquent taxes
paid by buyer are reported directly on the Sales Agreement tab of eCRV. See Reporting Special Assessments for
details on which special assessments should be reported on eCRV. Financing adjustments are determined by the
Department of Revenue based on financing arrangements reported on the Sales Agreement tab of eCRV. See
the following Financing Adjustments section for more information on when and how these financing
adjustments are made.

The net sale price is used in all ratio calculations, including those ratios used to determine market condition
trends. Once the market condition trend is determined, it is applied to the net sale price. See Market Condition
Trends and Ratios for more information on these calculations.

Financing Adjustments
Minnesota Statute 270.12 requires that financing adjustments are made when performing the Sales Ratio Study.
The Department of Revenue calculates a financing adjustment for sales with non-market financing in order to
estimate what the sale price would have been with market financing. Any sale with an assumed mortgage or a
contract for deed will be considered for a financing adjustment.

Financing adjustments are based on basic present value equations. The Department determines the present
value of payments using the market rate rather than the contract rate over the length of the contract. This can
be replicated in Excel using the following formula:

=PV(rate/p, nper, pmt)

 • Rate is the market rate. Market rates are published on the Department of Revenue’s Interest Rate
 Bulletin.
 • P is the annual number of payments. If the contract calls for annual payments, this number will be 1. If
 semiannual, 2. If quarterly, 4. If monthly, 12.

2020 Sales Ratio Study Criteria 18
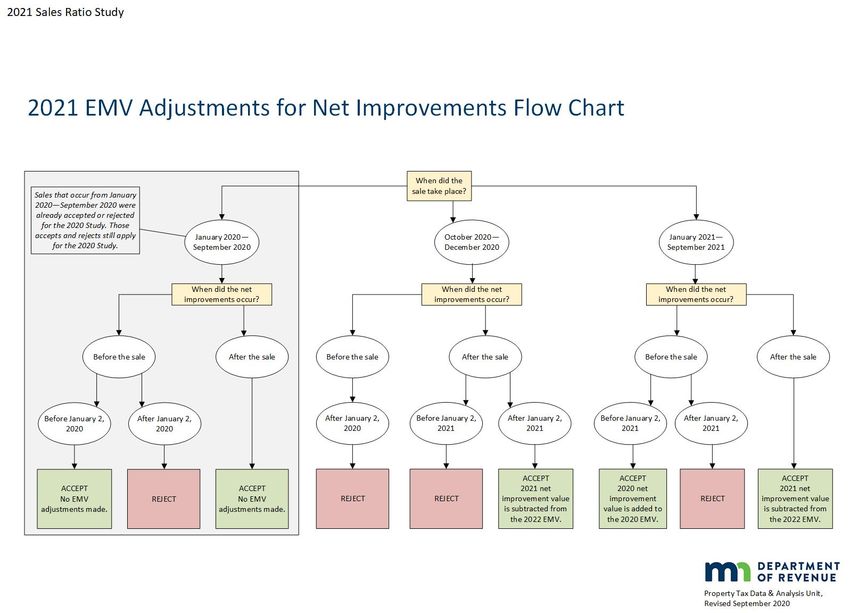
• Nper is the total number of payments that will be made over the length of the contract.
 • Pmt is the payment amount.

If there are multiple financing arrangements, the present value must be calculated for each arrangement.

If there is a balloon payment, the present value of the balloon payment is determined using the following
formula, where “# of Years” is the number of years between the original contract date and the date of the
balloon payment:

 =
 (1 + )#

Once the present value is determined for each financing arrangement and the balloon payment (if applicable),
the present values are summed for a total present value. The sum of the contract amounts for each
arrangement is subtracted from the total present value to get the financing adjustment amount for the sale.

There are several conditions where a financing adjustment will not be automatically made on an assumed
mortgage or contract for deed sale.

 • The contract rate is within half a percentage point of the market rate. Market rates are published on
 the Department of Revenue’s Interest Rate Bulletin.
 • The determined financing adjustment is less than 1% of the net sale price.
 • There are more than two financing arrangements.
 • The payments are for “Principal Only” or “Interest Only” and no balloon payment is reported.
 • The payment type or payment for is reported as “Other.”

While an automatic adjustment will not be made, sales that meet at least one of the last three conditions will be
flagged on the sales listing. Counties should review these sales to determine a suitable financing adjustment, if
any.

The Department’s automatic financing adjustments may not appropriate for specific sales, as determined during
the sales verification process. In these cases, the adjustment can be manually overridden by the PTCO. Work
with your PTCO to determine a more appropriate financing adjustment for these sales.

Interest Rate Bulletin

The Department of Revenue publishes market rates for the purposes of the Sales Ratio Study on the Interest
Rate Bulletin. There are three separate rates for residential/seasonal residential recreational, agricultural/rural
vacant, and commercial/industrial/apartment sales. This bulletin is updated quarterly.

EMV Adjustments
The Department of Revenue may adjust the assessor’s EMV for the purposes of the Sales Ratio Study in order to
accurately compare the EMV to the net sale price. If there were net improvements on a property before or after

2020 Sales Ratio Study Criteria 19
the sale, that property’s EMV may be adjusted by the net improvement amount for particular years. If there are
certain types of exempt property included in the sale, that exempt value may be added to the EMV. Each of
these EMV adjustments are detailed below.

Net Improvements
If there were net improvements on a property that sells within the 2021 study period, certain EMVs may need to
be adjusted by the net improvement amount in order to compare the EMV to the sale price. Net improvements
that occur before January 2, 2020 and after January 2, 2022 do not affect EMV adjustments. The EMV
Adjustments for Net Improvements Flow Chart describes when and how EMVs are adjusted for net
improvements. A high resolution version of this flow chart is available on our website. Note that net
improvements that occur during an assessment year are reported in the following assessment year, i.e. net
improvements that occur in 2020 will be reported to the Department of Revenue in 2021 and will be called 2020
net improvements.

There are certain situations where these adjustments to the EMV cannot be made and the sale should be
rejected. See Rejecting Sales from the Study for more information on when sales should be rejected for net
improvements.

Net Improvement Adjustment Example

 Net Net
 Sale Date Sale Price Improvement Improvement 2020 EMV 2022 EMV
 Date Amount
 June 2021 $200,000 June 2020 $50,000 $125,000 $180,000

In this example, if the 2020 EMV is not adjusted, the inverted ratio used for market condition trends (see Market
Condition Trends) would be 160% ($200,000/$125,000) because the 2020 EMV does not reflect the net
improvements. This would not be comparing apples-to-apples, since the sale price includes the net
improvement value but the 2020 EMV does not. Therefore, this sale needs its 2020 EMV adjusted by the 2020
net improvement amount reported in 2021.

Now, the adjusted inverted ratio for trend calculations would be $200,000/($125,000 + $50,000), or 114%. The
final ratio will not require any adjustments for net improvement value because the 2022 EMV includes that
value already, as does the sale price. The final ratio would be $180,000/$200,000, or 90%.

2020 Sales Ratio Study Criteria 20
2021 Sales Ratio Study Criteria 21
Exempt Value
The EMVs reported through PRISM only describe the taxable property on a parcel. Therefore, in order to
determine the total assessed value that should be compared to the sale price for a sales ratio, exempt value
reported through PRISM may need to be added to the EMV reported through PRISM.

The value of the following types of exempt property will be used to adjust EMVs:

 • Senior citizen facilities (PRISM code 0720)
 • Elderly living facilities (PRISM code 0780)
 • Ag containment facilities (PRISM code 1010)
 • Manure pits (PRISM code 1020)
 • Monosloped roofs (PRISM code 1040)
 • Wetlands (PRISM code 1100)
 • Native prairie (PRISM code 1200)

Exempt values were required on 2020 PRISM Submission 2. The value of the above exempt types reported on
2020 PRISM Submission 2 will be added to the 2020 EMV. If a county chooses to report exempt values on their
2021 PRISM Submission 2, the value of the above exempt types reported on that file will be added to the 2021
EMV reported on the 2021 PRISM Submission 2 and to the 2022 EMV reported on the 2022 PRISM Submission 1.

Choosing to report exempt values in non-required years may help counties cut down on time spent editing sales
information for the study and improve the accuracy of the Sales Ratio Study.

Exempt values will not be added to EMVs overridden in eCRV by the PTCO. If there is exempt value that should
be included in the EMV for the purposes of comparing the assessed value to the sale price, the value should be
entered into eCRV under an “Exempt” Property Type Group on the County tab, under Property Types.

Stratification
Sales within the 2021 study period are stratified into representative groups for market condition trend
calculations and for ratio calculations. Stratification is based on each sale’s property type, city, county, and
water status.

Property Types
The Department of Revenue determines each sale’s property type for the Sales Ratio Study based on
information reported on eCRV. See Determining Sales Ratio Property Types for information on which eCRV fields
are used to determine each sale’s sales ratio property type. The Sales Ratio Property Types table below lists the
various property types that sales are sorted into. Each sale is only assigned one property type. The 2021 Sales
Ratio Property Types document on our website describes how information from eCRV is translated into these
property types. Each of these property types are then combined with like property types to form property type

2021 Sales Ratio Study Criteria 22
aggregations. These aggregations are the basis for determining market condition trends and ratios. See Property
Type Aggregations for more information.

When determining if an agricultural and/or rural vacant sale should be considered 2a, 2b, or mixed 2a/2b for the
purposes of assigning sales ratio property types, the Department will first consult the Agricultural Classification
Acreage reported on the County tab, under Property Types on eCRV. If more than 75% of the acreage included in
a sale is classified as 2a, the sale will be considered 2a. If more than 75% of the acreage included in a sale is
classified as 2b, the sale will be considered 2b. A sale which is not at least 75% 2a acreage nor 75% 2b acreage
will be considered mixed 2a/2b. If Agricultural Classification Acreage is not provided on eCRV, the primary
Property Type Group as identified on the County tab, under Property Types on eCRV, will determine if a sale is
considered 2a or 2b. However, if Agricultural Classification Acreage is not provided on eCRV, that sale will be
flagged on the sales listing. This detail is necessary in order to compute each county’s Green Acres value.

When determining if an agricultural and/or rural vacant sale should be considered more or less than 34.5 acres,
the Department will first consult the Deeded Acres field on eCRV, found on the Property tab or on the County
tab, under County Data. If Deeded Acres is not provided on eCRV, the total Agricultural Classification Acreage
will be used. If neither is provided, a property type cannot be determined and the sale will be flag on the
county’s sales listing.

2020 Sales Ratio Study Criteria 23
Sales Ratio Property Types
 Sales Ratio Property Type Code Sales Ratio Property Type Description
 01 Residential (less than 4 units)
 02 Apartments
 03 Non-commercial seasonal residential recreational
 06 Commercial
 07 Industrial
 08 Public utility
 09 Railroads
 10 Mineral
 14 Seasonal recreational commercial and resorts
 20 Personal property
 21 Residential bare land
 22 Apartment bare land
 23 Seasonal recreational bare land
 26 Commercial bare land
 27 Industrial bare land
 30 Exempt
 31 Agriculture 2a - land with buildings more than 34.5 acres
 32 Agriculture 2a - bare land more than 34.5 acres
 33 Rural Vacant 2b - land with buildings more than 34.5 acres
 34 Rural Vacant 2b - bare land more than 34.5 acres
 35 Managed Forest 2c - bare land more than 34.5 acres
 36 Agriculture 2a - land with buildings less than 34.5 acres
 37 Agriculture 2a - bare land less than 34.5 acres
 38 Rural Vacant 2b - land with buildings less than 34.5 acres
 39 Rural Vacant 2b - bare land less than 34.5 acres
 40 Managed Forest 2c - bare land less than 34.5 acres
 47 Mixed 2a, 2b - land with buildings more than 34.5 acres
 48 Mixed 2a, 2b - bare land more than 34.5 acres
 49 Mixed 2a, 2b - land with buildings less than 34.5 acres
 50 Mixed 2a, 2b - bare land less than 34.5 acres
 51 Manufactured home parks
 52 Short Term Rentals

2020 Sales Ratio Study Criteria 24
Property Type Aggregations
Various sales ratio property types are combined into like groups to form property type aggregations. The Sales
Ratio Property Type Aggregation table below describes which property types are combined to form these
aggregations. A high resolution version of this table is available on our website.

Market condition trends are determined based on the following property types/aggregations:

 • 02 – Apartments
 • 06 – Commercial
 • 07 – Industrial
 • 91 – Residential/Seasonal Residential Recreational
 • 93 – Agricultural/Rural Vacant Bare Land

All of the sales in each of these property types will then be separated by region. See Regions for more
information.

Note that some property types fall within more than one aggregation and some property types do not fall in an
aggregation at all. The aggregations noted with an asterisk (*) in the table below include property types that also
fall in the 93 aggregation. In those aggregations, sales that are also in the 93 aggregation will be adjusted by the
93 trend while all other sales in the aggregation will not be adjusted by a trend. The 96 aggregation is used as a
catch-all aggregation for property types which are not used to calculate market condition trends and ratios.
Although sales in the 96 aggregation will not be used in the Sales Ratio Study, they may be good sales studied in
other ways.

If it is determined that the improvement value had minimal impact on the price paid for the land (general rule of
thumb is 5% or less of the total EMV), these sales should be considered as land only sales (PT 93).

2021 Sales Ratio Study Criteria 25
You can also read