Why are more sovereigns issuing in Euros? - Choosing between USD and EUR-denominated bonds - Pubdocs ...
←
→
Page content transcription
If your browser does not render page correctly, please read the page content below
Why are more sovereigns issuing in Euros?
Choosing between USD and EUR-denominated bonds

                         Antonio Velandia
                          Rodrigo Cabral

The World Bank Group
The World Bank Treasury
Financial Advisory and Banking Department
December 2017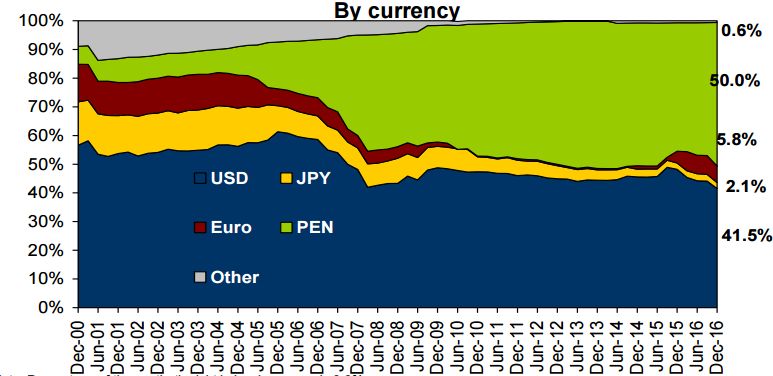
Abstract
This note presents and discusses the arguments          not significantly overlap with that of obligations
offered by several sovereigns that have joined a        in USD. This argument was reinforced by the
trend starting in 2013 whereby issuers, both            relatively tight conditions in the USD market that
sovereigns and corporates and in particular in          made placement more difficult for many issuers
Latin America, have gradually replaced a portion        in the last few years. Tactical arguments refer to
of the funding raised in USD for EUR. The trend         the need to open a market to a private sector also
seems to respond to the divergent monetary              wanting to raise funding in EUR, or, to the need
policies followed by the Federal Reserve and the        to access new investors as a preliminary step to
European Central Bank and the expectation that          attract them to domestic market securities.
this divergence will keep nominal coupons for           Several countries also admit that the optical effect
bonds denominated in EUR well below those of            of lower coupons was a relevant consideration.
USD bonds. The perception that funding in EUR
                                                        This note highlights the importance that
is cheaper is complemented, in many cases, by
                                                        sovereigns avoid making decisions by comparing
the expectation of further strengthening of the
                                                        the nominal coupons in both currencies, which is
USD.
                                                        tantamount to comparing apples with oranges.
The selected country cases reported in this note        More important, a formal debt management
state both strategic and tactical arguments for         strategy, including a target for the currency
increasing their issuance in EUR. The strategic         composition for the FX portfolio, should guide
reasons relate to internal currency benchmarks,         the debt managers. Without such a target
which indicate that there was room for replacing        currency composition, the debt manager cannot
some of the borrowings in USD for borrowing in          tell whether the issuance in a particular currency
EUR. In some cases, the currency substitution is        - USD or EUR in this case - is reducing or
supported by the argument that further                  increasing the exposure of the debt portfolio to
diversification in the investor base was needed as      foreign currency risk and helping or not to
the investor base for EUR-denominated debt does         achieve his debt management objectives.

JEL classification
H63, F34

Keywords
Debt Management, Sovereign Debt, Eurobonds.

The findings, interpretations, and conclusions expressed in this paper are entirely those of the authors.
They do not necessarily represent the views of the International Bank for Reconstruction and
Development/World Bank and its affiliated organizations or those of the Executive Directors of the World
Bank Group or the governments they represent.
Why are more sovereigns issuing in Euros?
Choosing between USD and EUR-denominated bonds

                                           Antonio Velandia
                                           Rodrigo Cabral1

1Antonio Velandia and Rodrigo Cabral are from the Financial Advisory and Banking Department of the World
Bank Treasury. The authors are grateful to Christopher Dychala for his research assistance and to Cagatay Imirgi,
Christian Parrado, Cigdem Aslan, Coskun Cangoz, David Duarte, Elena Garcia, Jose Olivares, Lior David, Pablo
Gonzalez, Patricio Sepulveda, Roberto Lobarinhas, and Sebastien Boitreaud for their contributions and comments to
earlier versions. All errors are the authors’ sole responsibility.

                                                        4
Table of Contents
I. Introduction ................................................................................................................................. 6
Foreign currency risk and debt management strategies .............................................................. 6
II. Recent trends in sovereign bond issuances ................................................................................ 7
III. The markets for USD and EUR-denominated debt ................................................................ 11
IV. Why issuing Euro-denominated bonds? ................................................................................. 14
V. Selected country examples ....................................................................................................... 17
Responding to a change in the macro and market environment: the case of Peru.................... 17
A regular issuer in the euro market: the case of Turkey ........................................................... 20
A change in the benchmark for the foreign currency debt: the case of Chile ........................... 22
An important funding alternative for a large issuer: the case of Mexico.................................. 24
VI. Conclusion: strategy should come first................................................................................... 26
VII. References ............................................................................................................................. 29
Annex ............................................................................................................................................ 30
Comparing the cost of issuing in different currencies using CCS ................................................ 30
Sources of the difference between direct issuance in EUR and issuing in synthetic EUR ....... 33
Estimating reference rates and risk spreads .............................................................................. 33
The cross-currency basis and the break in interest rate parity .................................................. 33
Credit and other charges ........................................................................................................... 34
Examples of real issuances ....................................................................................................... 34
5I. Introduction
Foreign currency risk and debt management strategies
1. In most emerging economies, foreign currency (FX) risk remains the primary exposure
sovereign debt managers face. This challenge is often addressed in two steps. Initially, debt
managers set a target for the share of foreign currency debt; then they choose the preferred
currency composition for the FX portfolio.
2. With the “original sin”2 still alive, the target on FX debt is, in many cases, a residual of the
domestic debt market’s capacity to absorb a given supply of government securities in local
currency (LX). Debt managers tend to issue in LX as much as they think the domestic market
can absorb without crowding out lending by local banks to the private sector.
3. Except for those emerging markets whose economies are linked to a major hard currency, the
choice of the preferred currency composition for the FX debt tends to be more complicated.
Since the literature is of limited assistance,3 countries tend to approach this decision in a rather
pragmatic manner.
4. Furthermore, the use of cross currency swaps (CCSs) expands the array of possibilities. Debt
management offices (DMOs) could issue in one currency, e.g., USD, and then swap the bond
cash flows into another currency, e.g., EUR, delinking the currency of issuance from the
foreign currency exposure. These derivative products become vehicles that allow for the
implementation of the debt management strategy in a cost-effective manner. Debt managers
can compare, for example, the cost of issuing directly in EUR with the cost of creating synthetic
debt in EUR by issuing in USD and then swapping the cash flows into EUR.
5. While integrating the CCSs into the array of instruments allows debt managers to expand their
funding options, authorities should be mindful that the CCSs require a robust operational
infrastructure and a comprehensive credit risk management framework to handle the cash
flows with the counterparties generated by these derivatives over the time of the contracts.
6. The significant increase in emerging markets (EM) borrowing in EUR at the expense of USD
since 2013 offers a unique opportunity to explore the drivers of the foreign currency choice. In
this note, we attempt to discuss the motivations behind the increase in EUR-denominated
funding, analyze the advantages and challenges of some policy decisions, and further highlight
the importance of having a reliable debt management strategy, including currency benchmarks,
to provide a clear north to the debt manager’s decisions.
2
The term original sin refers to the inability of developing countries to issue bonds denominated in local currency in
the international capital markets. See Eichengreen, B., and Hausmann, R., (1999) "Exchange Rates and Financial
Fragility" in New Challenges for Monetary Policy (Proceedings of a symposium sponsored by the Federal Reserve
Bank of Kansas City). See also Eichengreen, B., Hausmann, R., and Panizza, U., (2002). "Original Sin: The Pain,
the Mystery and the Road to Redemption" paper presented at a conference on Currency and Maturity Matchmaking:
Redeeming Debt from Original Sin, Inter-American Development Bank.
3
Martin Melecky provides a review of the literature in “Choosing the Currency Structure for Sovereign Debt: A
Review of Current Approaches”. (World Bank Policy Research Working Paper 4246, June 2007).
67. After this introduction, we present the recent trends in sovereign bond issuances to illustrate
the increase in the funding denominated in EUR. In section 3, we describe the market for EUR-
denominated debt and its particularities compared to the USD market. In section 4, we
summarize the motivations behind EUR-denominated issuances, and in section 5, we present
selected cases of countries that have recently stepped up their issuance in EUR. Finally, section
6 concludes. In addition, the annex summarizes the calculations to compare the cost of a bond
issued in EUR with the cost that would result from issuing a bond in USD and then swapping
the obligation into EUR.
II. Recent trends in sovereign bond issuances
8. Compared to the EUR market, the USD market for both sovereign and corporate EM
issuers is much more established and liquid. While in 2016 EM sovereigns issued close to
USD120 billion in USD, the placements in EUR were close to USD30 billion, about one fourth.
As illustrated in figure 1, the USD market has traditionally been much larger, but the market
for EUR-denominated obligations has gained relevance in the EM space after 2013.
Figure 1: EM sovereign issuances denominated in EUR and USD (billions)
160
140
120
100
USD billions
80
60
40
20
0
2000
2001
2002
2003
2004
2005
2006
2007
2008
2009
2010
2011
2012
2013
2014
2015
2016
USD EUR
Source: Bloomberg
9. The continued expansionary policy of the ECB has enticed emerging economies, both
near and far from the Eurozone, to step up their borrowings in EUR. This has been the
case of Turkey, Russia, Poland, Romania, Croatia, the Czech Republic, and Hungary;4 all of
4
Examples of countries close to the Eurozone that have significantly switched their funding from USD to EUR
sometime after the Global Financial Crisis include Hungary: USD funding from 2005 to 2011 and EUR from 2010
7them have also benefited from their investment grade rating that makes them more attractive
to large insurance companies and pension funds in Europe. Apart from the increased activity
of traditional EUR issuers, the market has also seen a pronounced increase in sovereign
issuance from other regions, such as Indonesia in Asia and several countries in Latin America,
which traditionally borrowed in USD.
10. Unsurprisingly, corporates have followed the same trend observed for sovereigns. The
charts below show that between 2001 and 2014, emerging market companies issued at least
seven times as much dollar-denominated debt as that denominated in euros each year, with the
ratio topping 13 times as recently as 2012. In 2015 the ratio fell to 5.11 times and hit a new
low of 4.68 in the first eight months of 2016 5 . Again, the relative increase in the EUR-
denominated issuance came from a broad set of countries, including non-Europeans such as
China, Mexico, and Brazil.6
Figure 2: EM non-financial corporate issuances
Balance in euros (bn) Ratio of dollar to euro issuance
*2016 figure is Jan – Aug only
Source: Institute of International Finance, Financial Times.
11. The sustained increase in the issuance of EUR-denominated debt responds in part to the
impact divergent monetary policies of the FED and the ECB7 had on interest rates. As
shown in figure 3, the spread between the 10-year US and German bonds has steadily widened
from zero in 2011-2012 to more than 200 basis points at the closing of 2016. According to the
forward curves (figure 4), this divergence is expected to stay over the medium term.
to 2014; Croatia: USD funding from 2009 to 2013 and EUR from 2011 to 2017; and Romania: USD funding from
2012 to 2014 and EUR issuances from 2008 to 2017.
5
See Financial Times article “EM corporate borrowing in euros at record levels,” Dec. 19, 2016.
6 Some non-European countries have seen large increases in euro-denominated debt since 2005, with China going
from USD16.5bn to USD59.9bn as of August 2016, Mexico from USD7.4bn to USD31.9bn and Brazil from
USD4.9bn to USD18.8bn (FT December 19, 2016).
7
Of course, this includes the ECB bond purchase program. For the effects of such program on bonds and yields, see
https://www.ecb.europa.eu/pub/pdf/scpwps/ecbwp1956.en.pdf.
80
1
2
0.5
1.5
Yield (%) 2.5
Mar-12
Source: Bloomberg
0
0.5
1
1.5
2
2.5
3
3.5
4
Source: Bloomberg
Jun-12
3/24/2017
Sep-12
2018
Dec-12
2019
Mar-13
2020
2021 Jun-13
2022 Sep-13
UST
2023 Dec-13
2024 Mar-14
2025
Jun-14
9
2026
Sep-14
2027
Dec-14
Germany
2028
2029 Mar-15
2030 Jun-15
2031 Sep-15
Spread
2032
Dec-15
2033
Figure 4: Forward 10Y interest rate and spread
Mar-16
2034
Jun-16
2035
2036 Sep-16
Figure 3: Historical spread between 10Y US Treasury and Bunds (%)
2037 Dec-1612. The pace of economic growth that is behind the divergent monetary policies in the US and the
Eurozone has also triggered an adjustment of the exchange rate, with the USD hitting historical
heights not seen since 2004. Since the end of 2013, when the exchange rate was 1.38, the EUR fell by
more than 20% to close 2016 at 1.068.
13. To the extent that significantly lower interest rates in Europe are associated with the
expectation of a weaker EUR, issuers are finding EUR-denominated obligations more
attractive. As discussed later, the impact of a change in the exchange rate on the funding cost
for an issuer could far outweigh the interest rate differential. It is therefore vital that the issuer
has a clear understanding of the risks involved in the currency choice.
Figure 5: Exchange rate EUR-USD and annual changes 2000-2017
30% 1.80
1.60
20%
1.40
10% 1.20
1.00
0%
1-Nov-01
1-May-04
1-Nov-06
1-May-09
1-Nov-11
1-May-14
1-Nov-16
1-Jun-01
1-Jun-06
1-Jun-11
1-Jun-16
1-Dec-13
1-Aug-00
1-Apr-02
1-Jul-03
1-Dec-03
1-Aug-05
1-Apr-07
1-Jul-08
1-Dec-08
1-Aug-10
1-Apr-12
1-Jul-13
1-Aug-15
1-Mar-00
1-Oct-09
1-Sep-02
1-Feb-03
1-Oct-04
1-Mar-05
1-Sep-07
1-Feb-08
1-Mar-10
1-Sep-12
1-Feb-13
1-Oct-14
1-Mar-15
1-Jan-01
1-Jan-06
1-Jan-11
1-Jan-16
0.80
-10% 0.60
0.40
-20%
0.20
-30% 0.00
Source: Bloomberg, author’s calculations
14. In addition, the compression in the CCS basis might have contributed to this process,
making EUR funding increasingly attractive. As illustrated in Figure 6, the EUR-USD
cross currency basis became negative after the global financial crisis and has experienced
notable volatility since then, particularly when compared to the other element of the swap,
the 3 vs. 6-months basis. The sharp compression in CCS basis in 2013 (becoming even
positive in 2014) coincides with the step up in EUR issuance volumes.
8
Although the EUR has strengthened in the first semester of 2017.
10Figure 6: 7-year EUR-USD cross currency basis
10
0
-10
-20
-30
-40
-50
-60
-70
Jul-02
May-08
Jul-09
Jul-16
May-01
Apr-04
Jun-05
Apr-11
Jun-12
May-15
Dec-01
Feb-03
Sep-03
Nov-04
Mar-07
Mar-14
Aug-06
Dec-08
Feb-10
Sep-10
Nov-11
Aug-13
Dec-15
Feb-17
Jan-06
Jan-13
Oct-14
Oct-07
Source: Bloomberg
III. The markets for USD and EUR-denominated debt
15. The market for EUR-denominated bonds for emerging market countries differs from the
USD-denominated market regarding its size and depth, the investor base, issuers,
standard tenors, and conventions. These differences bring significant implications for EM
issuers both for strategy development and execution of transactions.
16. As discussed above, the market for USD-denominated bonds for emerging market
countries is several times larger and more liquid than its equivalent in EUR. Even though
the surge in EM bond issuance in EUR has brought the ratio of new issuance in USD to EUR
down to historical lows, the ratio is still above 4:1 and its average since 2000 hovers around
8:1. The larger size of the market in USD tends to be accompanied by a higher turnover which
in turn results in lower bid-ask spreads. For example, in the case of Mexico, the average bid-
ask spread of the yield to maturity on outstanding USD-denominated international bonds is 7
basis points, compared to 10 basis points for outstanding EUR-denominated bonds; and
Mexico is an example with very liquid benchmarks on both currencies.
17. Investors in EUR-denominated sovereign securities tend to be less sophisticated
compared to those operating in the USD market and are likely to demand higher credit
spreads to move outside their comfort zone. While hedge funds participate actively in both
markets, real money investors such as pension funds and insurance companies dominate the
EUR market. These institutional investors have at their disposal an extensive portfolio of
securities from sovereigns that are in the Eurozone, in the path to joining the euro, or, with
close economic and financial linkages with the Eurozone.
1118. Faced with a supply of securities sufficiently large and diverse, traditional investors in
EUR may prefer high-grade securities from outside the region as a step to improve the
return of their portfolios. These investors are already acquainted with issuers in the Eurozone
neighborhood and would need to spend more resources to follow other issuers. To minimize
these marginal expenses, investors would probably consider first those issuers easier to
monitor: high rated sovereigns, or, corporates from outside the region and high yield issuers
from the region.
19. The type of sovereigns that access the market, correlates with these differences in the
investor base. Whereas issuances in USD can be found in substantial size across all regions
and economic zones, in line with the dominance of the USD, EUR issuances are largely
concentrated in the EUR area. It is only after 2013 that sovereigns out of Europe have become
visible to the EUR market and, as mentioned before, this is primarily related to the ECB
expansionary monetary policy and its quantitative easing. Traditionally, the limitations of the
EUR market had driven sovereigns interested in placing obligations denominated in EUR to
the market in USD as a second-best solution. This has been the case of several emerging and
frontier market economies in North and West Africa and even Serbia in Europe. Senegal for
instance has tried the EUR avenue without success since 2009, with the government issuing
obligations denominated in USD followed by swaps into EUR in rather complicated and
expensive transactions9.
20. For EM issuers, out of the Eurozone, this means they need to invest more in engaging
institutional investors to lower execution risk for the EUR-denominated transactions.
Familiarizing the investor base with the “new names” demands a solid investor relations
function including deal and non-deal roadshows and, in some cases, accepting a spread for the
new issuer. This “investment” pays handsome returns when the debt manager widens the
investor base bringing in real money accounts from Germany, France, and Austria, for
example, which usually do not buy USD-denominated bonds.
21. Different from the USD-denominated bond market that is concentrated on 10 and 30-
year benchmarks, the EUR-denominated market accepts non-standard tenors. Issuances
of 6, 8 or 11 years in EUR are common and may help issuers smooth the debt redemption
profile. This flexibility reflects the fact that real money investors such as pension funds and
insurance companies are less concerned with the liquidity of standard benchmarks. On the
other hand, issuing long maturities in EUR (beyond 10 years) is typically more challenging10:
Turkey, for example, with access to the 30-year point in the USD curve, has not gone beyond
12 years in the EUR-denominated market.
9
Without the degree of complexity in the Senegal transaction, Morocco in 2014 and Tunisia in 2017 accessed the
market in EUR with less expediency compared to the USD market.
10
For example, taking a sample of six non-European countries (Brazil, Chile, Colombia, Indonesia, Peru, and South
Africa), the average residual maturity of their USD denominated bonds (20 years) is twice the average maturity of
their EUR denominated securities (10 years). This is a clear indication of the USD market being more receptive to
longer maturities (the 30 years benchmark, basically).
1222. While crucial differences between the USD and EUR markets remain, the EUR market
has expanded regarding market access and duration for the high-grade and “well-
located” issuers. Several central-eastern European countries that used to access the USD
market have recently concentrated their issuance in EUR and some of them have placed
securities at the long end of the curve. This is the case of Latvia and Lithuania with recent
placements of 30-year bonds; Mexico with 30 and 100-year placements11; and Israel,
Slovakia, Poland and Latvia with 20-year benchmarks.
23. Conventions also mark a distinction between the two markets. It is the market practice to
use US Treasuries as the reference for USD-denominated obligations and mid-swaps for EUR-
denominated ones. Unlike the US Treasury curve that is ‘polarized’ into the traditional
benchmarks, the mid-swap is more populated and some argue12 that this helps to explain the
existence of the non-standard tenors in the EUR market, as European investors would just
charge the credit curve, without adding a premium for such tenors.
24. The relative cost of funding cannot be made comparing the coupons in the two currencies,
but credit spreads over reference rates can. For well-established names in the EUR market,
the data shows that spreads are volatile, reflecting the relative liquidity in the two markets. The
active expansionary monetary policy of ECB has tightened the spreads in EUR for several
issuers. But for lower-rated sovereigns located out of the traditional zone of influence of the
EUR, credit spreads in EUR tend to be wider than those in USD, reflecting the inertia of the
investor class that dominates the market of EUR denominated obligations.
25. A fair comparison of issuance costs in two currencies could be made using a cross
currency swap. These derivatives permit comparing the cost of issuing in EUR versus the cost
of issuing in synthetic EUR which means issuing in USD and swapping the cash flows into
EUR. For lower-credit borrowers, out of the EUR neighborhood, issuing in synthetic EUR is
cheaper because the credit spread in USD is narrower and the basis swap negative13. For well-
established issuers, since the credit spreads in the two markets are volatile, there is no way to
tell in advance which market is cheaper. Borrowing in synthetic EUR would not be cheaper if
credit spreads in EUR are lower enough - compared to credit spreads in USD - to offset the
cross-currency basis.
26. For most EMs, issuing either in EUR or USD implies incurring exchange-rate risk as
neither is their domestic currency. In both cases, the actual debt service cost will depend on
the future evolution of the foreign currency vis-à-vis the domestic one, which is, of course,
unknown at the issuance date14. Using cross-currency swaps to compare the relative cost of
11
The 100-year bond issued by Mexico in 2016 could qualify as an outlier. It was issued at a time of abundant
liquidity, with negative yields of German bonds up to the medium term and a strong appetite for higher-returns from
institutional investors in Europe. The market has also shown signs of more depth for Mexican corporates like Pemex
as witnessed by the EUR 4.25 billion transaction in February 2017 in 3 tranches at 4.5, 7 and 11 years.
12
However, this argument should be regarded as a speculation only, as there seems to be no consensus on it.
13
We assume the sovereign in question is able to post collateral. The Annex brings an illustrative example on how
to compare borrowing costs using a cross-currency swap.
14
In addition, for most emerging markets, there is no market for swapping medium or long-term bonds into the
domestic currency.
13funding in the two currencies is a sound practice because the pricing is taken from the market
rather than on views of future FX rates. If the DMO is pricing the two potential issues with FX
scenarios that significantly differ from what is implicit in the cross-currency swaps, it means
the government is betting on the FX market.
IV. Why issuing Euro-denominated bonds?
27. A number of reasons may lead an EM country to issue international bonds denominated
in EUR. These can range from overall policy objectives like achieving the desired composition
in the FX debt-portfolio to more micro considerations such as creating benchmarks for the
private sector, promoting the country among a group of investors (branding), or simply
lowering periodic coupon payments. To weigh the motivation, it is worth establishing the
governance environment in which the debt manager operates, in particular, whether or not there
is a government debt management strategy in place that includes clear guidelines for the
currency composition of the FX debt.
28. Clear guidelines for the currency composition of the debt portfolio are typically derived
from a thorough cost-risk analysis15. The analysis should reflect the linkages of the economy
to the Eurozone and the extent to which the value of the local currency correlates to the Euro16.
As government revenues are in the local currency, selecting Euro may provide the best proxy.
While this tends to be the primary justifying factor for preferring the Euro, other considerations
such as the diversification of the investor base, or the diversification of FX risk, can reinforce
the choice.
29. Without a clear target for the currency composition of FX debt, debt managers are forced
to navigate in the darkness without instruments and known port of arrival. In such
environment, debt managers may use the same arguments mentioned above for justifying
tapping the Euro market. At the same time, when issuing, e.g., EUR 1 billion, they may be
unable to determine whether they are moving the portfolio closer to its desired composition,
or, increasing the exposure to FX risk and endangering the sustainability of the government
finances. In a nutshell, without clear strategic targets, the debt manager lacks a framework to
assess both cost and risk and thus is unable to base the funding decisions on a strategy to reach
the debt management objectives.
30. The issuance of EUR-denominated bonds can support diversifying the investor base.
Many countries may endeavor to diversify the investor base as a way to mitigate refinancing
risk and avoid the market becoming a one-way street with all investors wanting to buy or sell
15
See MTDS Guidance Note (http://www.worldbank.org/en/topic/debt/brief/mtds). More broadly, the decision on
the strategy should come from a comprehensive process encompassing the analysis of the current debt portfolio, the
potential sources of financing, the macroeconomic outlook, the cost-risk assessment of alternative strategies, and the
degree of domestic market development, among other factors.
16
For example, in the case of Turkey, its geo-economic links with the Eurozone makes the EUR a less volatile
foreign currency to have exposure to, although in the recent past the volatility of the USD/TRY has reduced in
comparison to the EUR/TRY.
14the government paper at the same time. A heterogeneous investor base offers the benefit of
investors acting differently over time given their preferred habitat, investment horizons, and
risk-return preferences. According to the authorities, the first EUR-denominated bond
launched in 2016 by Peru brought about 75% of investors with no previous exposure to
Peruvian securities.
31. Diversification of the investor base is more relevant for countries with high financing
needs or when trying to create scarcity value for the USD bonds. Even though the USD
market is large and deep, EM issuers cannot dismiss the potential for market disruptions, or,
investors fatigue triggered by continuous supply. Large and frequent issuers in the international
markets can create scarcity value in their USD bonds by accessing the market in EUR (and
other currencies). Indeed, issuers like Mexico and Turkey with relatively large funding
programs in the external markets, make diversification of the investor base a high priority.
32. For DMOs with access to CCSs, the objective of diversifying the investor base can be
achieved without keeping the exposure to the EUR. Again, the critical issue here is the
strategic benchmark for the composition of the FX debt without which the debt manager is
completely blind to the need for hedging the issuance in EUR. For example, if the target
currency composition blocks the debt manager from increasing the exposure to the EUR, then
it is fairly easy for him to assess the cost of diversifying the investor base through comparing
the cost of issuing directly in USD with that of issuing in EUR and then swapping the cash
flows into USD17.
33. Unfortunately, the stringent requirements for the use of derivatives combined with the
capital requirements on swap providers put these instruments out of the reach of most
EMs. Safe use of CCSs requires a solid legal 18 , operational and risk management
infrastructure. This infrastructure will allow debt managers to transact with international
counterparties, price the instruments, manage the cash flows arising from changes in the
exchange rates, handle the corresponding credit risk, which may include the posting of
collateral, and account for these operations, among others. More importantly, current
regulations make it extremely difficult for a bank to offer a swap to a low-rated counterparty
since CCSs are probably the most capital consuming product for banks19.
17
Let us assume that credit spreads were the same for obligations denominated in USD and EUR and that the
current negative basis remains. Under these conditions, issuing synthetic USD would be more expensive than
issuing directly in USD. By funding through the EUR market, the debt manager is able to diversify the investor base
but does so at the expense of increasing its funding costs in USD.
18
DMOs would have to sign ISDA agreements with counterparties and transfer collateral according to the mark to
market value of the CCS and the thresholds set up in Credit Supplement Annex (CSA). It means that while CCS
assist to shift the market risk to the desired currency composition, they expose debt managers to credit
(counterparty) risk and managing credit risk could be expensive because of the liquidity and the operational
infrastructure needed.
19
It should be noted that the World Bank offers a range of risk management products to its member countries,
including CCS. When a member country uses the World Bank as an intermediate for a CCS transaction, it benefits
from the AAA rating of the WB both in terms of cost and operational procedures, as it won’t be required to post
collateral, for example.
1534. Another reason for sovereigns to issue EUR-denominated bonds is to increase funding
optionality. Given that the market windows are not necessarily correlated across EUR and
USD, having a EUR curve provides an alternative source of funding in international markets
during episodes of turbulence in USD market (arbitrage of market windows). This proved
valuable for several EM sovereigns during and after the taper tantrum in May 2013.
Cross-Currency-Swaps
Cross-currency swaps (CCSs) differ from foreign exchange swaps since the former does not
involve cash flow exchange during the life of a contract, whereas the first does, such as a typical
bond. For this reason, it suits particularly well to hedge the exposure on currencies created by
bonds. It can be seen as a collateralized borrowing of a particular currency, in which two parties
exchange the same amount of notional at the beginning and end of the contract and make
simultaneous coupon payments during the life of the contract. In a USD-EUR CCS, the USD
borrower pays a stream of local currency (USD) coupons, while the USD lender pays a stream
of EUR coupons, respectively based on 6-month LIBOR and 3-month EURIBOR.
The basis in a CCS is a spread added to the non-USD leg, which represents a premium or
discount to the USD borrower. Given it is added to the coupon paid by the USD lender, it
represents a premium when it is negative, such as it has been the case since 2008 for the majority
of the time, or a discount when positive.
For more information, please refer to “The basic mechanics of FX swaps and cross-
currency basis swaps” at http://www.bis.org/publ/qtrpdf/r_qt0803z.htm .
35. Sovereigns may also issue EUR-denominated bonds to pave the way for corporate issuers
or to promote the country abroad. By setting a benchmark for sovereign risk, a EUR-
denominated issuance can open that market for other national issuers; this seems to be the case
in Mexico with the oil company PEMEX following the Republic of Mexico in placements in
EUR. More broadly, tapping the international market may have the branding objective of
promoting the country to attract interest to the domestic capital markets or even to increase
foreign direct investment (FDI)20.
36. Lastly, countries may choose to issue EUR-denominated bonds because of the optical
effect of lower nominal coupons. Since nominal rates in EUR have recently been substantially
lower than those in USD (see section II), some issuers are looking at reducing the burden of
interest payments in the budget. However, this myopic – or non-strategic - approach ignores
the FX risk as interest rates in EUR and USD cannot be compared without accounting for the
potential change in the exchange rate.
20
Peru, for example, issued its EUR-denominated bond with a secondary objective to reach out to that pool of
investors and get them used to its credit risk in a way to attract those investors, in the near future, to buy bonds
denominated in local currency, especially given their strategy to make those local currency bonds Euroclearable –
and so easier for an international investor to negotiate and clear.
1637. Debt managers opting for the EUR on the basis of the current interest rate differential
and the potential appreciation of the USD are basing the funding decision on a market
view. The daily volume traded in the foreign currency markets is counted in trillions of dollars
by commercial and investment banks, central banks, governments, supranationals, corporates,
institutional investors and speculators with many different motives of which interest rates are
just one. Currently, a growing consensus21 highlight that geopolitical uncertainty could be a
key factor increasing market volatility and making forecasting and pricing of future cash flows
a more challenging exercise. This means that over the life of the international bond, exchange
rates are likely to experience significant swings and those betting on a particular direction
assume a risk that is not suitable for a government debt portfolio.
V. Selected country examples
38. This section summarizes conversations held with some debt managers involved in the
recent issuance of EUR-denominated obligations in the international capital markets.
Rather than providing an exhaustive account of the government debt management strategies,
the section sums up the rationale provided by the government officials interviewed for these
notes.
Responding to a change in the macro and market environment: the case of Peru
39. Peru’s key strategy for managing the government borrowing has been to de-dollarize its debt,
partly by attracting non-residents to buy securities denominated in local currency (PEN). As
illustrated in the chart below, since the early 2000s the authorities have gradually increased the share
of local currency debt from negligible levels to about 50% at the end of 2016. This has been achieved
thanks to the development of a relatively dynamic market for government securities with the active
participation of pension funds and foreign investors. To complement the borrowing in Peruvian soles,
the authorities have recurred to foreign currency borrowing, mainly denominated in USD, reflecting
the degree of dollarization of the economy.
21
El-Erian, Mohamed. “Navigating the New Normal in Industrial Countries” in the Per Jacobsson Foundation
Lecture, IMF, October 10, 2010. Roubini, Global Economics, “New Abnormal: Growth Malaise Is Here to Stay”,
May 19, 2016. Others have used similar expressions: the IMF calls it the “new mediocre;” Larry Summers refers to
“secular stagnation;” and Ray Dalio calls it the “great deleveraging.”
17Figure 7: Structure of the gross public debt by currency (December 2016)
Source: Ministry of Economy and Finance of Peru, Quarterly Report as of December 31, 2016.
40. Peru had not issued in EUR for 10 years until a change in the macro fundamentals
triggered the issue of EUR 1.2 billion in 2015. The justification for the change in the strategy
is partly related to the new context for the international economy: the slowdown in China and
the severe fall in commodity prices have resulted in a sharp contraction of the current account
surplus and in the government external revenues both of which have widened the fiscal deficit
and increased the funding requirements, particularly in foreign currency.
Figure 8: Peru Foreign Currency Bond Issuance by Year
2000 15
1800 13
1600
Millions in USD Eq.
11
1400 BBB+
1200 BBB 9
BBB-
1000 7
BB+
800 5
600
3
400
200 1
0 -1
2007 2008 2009 2010 2011 2012 2013 2014 2015 2016
EUR USD LT FX Credit Rating
Source: Bloomberg, Standard and Poor’s.
1841. The increase in the funding needs coincided with a contraction in the demand for
government securities both in foreign and local currencies and an upward movement in
the government yield curves. Since mid-2015 foreign investors experienced a significant
reduction in the appetite for risk, possibly as a consequence of the gradual reversion of
monetary policy by the FED. As capitals started flowing out, the Central Bank tightened
liquidity conditions to help contain the depreciation of the exchange rate, completing the
picture to explain the upward movement in the LX and FX yield curves.
42. Macro and market conditions have increased the dependency of government borrowing
from foreign investors, highlighting the need to diversify the investor base. Peru has
traditionally been highly dependent on non-resident investors, who hold 37.6% (as of
December 2016) of government securities in local currency plus a large part of the international
bonds in USD. With expectations of increasing borrowing requirements, Peru has prioritized
the diversification of funding sources, including accessing the EUR market.
43. The government achieved significant diversification with the placement of an 11-year
EUR-denominated bond in 2015. According to the authorities, only 25% of the investors
were traditional buyers of USD bonds, while 75% were new investors. The authorities plan to
continue tapping the EUR market to guarantee continued access and to consolidate a more
diversified investor base (a second 14-year EUR-denominated bond was issued in 2016). The
idea is to have several points in the curve multiplying the opportunities for liability
management operations and providing flexibility to the debt manager22.
44. This will also help Peru gather more demand for its issuances in local currency. As Peru
is building a link with Euroclear23 to allow foreign investors to buy securities in local currency
through their Euroclear accounts, the issuance of bonds in EUR offer a vehicle for new
investors to get acquainted with Peru’s sovereign risk.
45. So far, Peru has decided to leave the EUR issuances unhedged. As of now, in the
authorities’ view, hedging it into USD would be expensive but they will consider a cross
currency swap to shift the exposure to USD if market conditions change in the future. The two
placements in EUR alone do not pose risk management concerns, but the maximum share of
the EUR in the government debt portfolio remains a question mark.
46. Finally, according to the authorities, the more opportunistic considerations related to the
optical impact of lower coupons and the expectations of the strengthening of the USD also
provided tactical arguments to support the transaction in EUR. In sum, Peru had both
strategic and tactical reasons to start accessing the market in EUR.
22
Nonetheless, the authorities need to weigh the argument of diversification against the need to consolidate the
benchmarks in local currency given the limited borrowing financing needs
23
A first phase of this link has already been completed and a first Euroclearable bond was launched in July 2017.
19A regular issuer in the euro market: the case of Turkey
47. Turkey has strategic benchmarks both for the share of local currency and for the
currency composition of the FX debt. Such benchmarks are not publicly available, but they
are binding for the Turkish Treasury. For many years, Turkey has maintained a frequent and
strategic presence in the Euro market, although the share of EUR denominated debt has
declined since 2013. As of the end of 2016, Turkey had about EUR9 billion in outstanding
Eurobonds denominated in EUR distributed in several benchmarks: 8, 9, and 12-year.
Figure 9: Currency composition of central government debt stock (December 2016)
JPY Other
SDR
2.60% 0.20%
0.60%
EUR
9.80%
USD
25.20%
TL
61.60%
Source: Public Debt Management Report, Undersecretariat of Treasury, January 2017
48. Two main reasons drive Turkey’s strategic presence in the Euro market: the political-
economic links with Europe and the diversification of the investor base. Regarding the
first driver, close to half of Turkey’s trade is with Eurozone countries and the potential for EU
accession, while uncertain, also plays a role24. The second driver is particularly relevant given
the size of Turkey’s funding needs. Although the USD-bond market continues to be the most
important in terms of volume, Turkey has invested in diversifying its investor base by
accessing other markets such as the conventional ones in EUR and JPY, and Sukuk in USD.
49. Since a significant part of the country’s economic activity is linked to Europe, the Turkish
Treasury finds it convenient to have a portion of the government FX debt denominated
24
Turkey's application to accede to the European Economic Community, the predecessor of the European Union
(EU), was made on April 1987 and it has been an associate member since 1963. Turkey signed a Customs Union
agreement with the EU in 1995 and was officially recognized as a candidate for full membership on December 1999,
at the Helsinki summit of the European Council. However, on November 2016 the European Parliament voted to
suspend accession negotiations with Turkey. In December 2016, the European Council (comprising the heads of
state or government of the member states) resolved that it would open no new areas in Turkey's membership talks in
the "prevailing circumstances", which may mean that progress on EU accession will take longer.
20in EUR25. Should the Turkish lira depreciate (appreciate) versus the EUR, Turkish exports are
likely to increase (decrease), boosting (knocking) government revenues in a manner that
mitigate the foreign currency exposure of the government debt.
50. Turkey has also found that the EUR offers an avenue to reach real money accounts in
Germany, Austria, and other countries. These institutional investors do not usually
participate in the market in USD and are more selective, given the number of high-credit issuers
in the region26. Turkey also sees a spillover effect when accessing the Euro market as it attracts
part of the investors from the USD market, making the placements in USD easier to execute
and more attractive (scarcity value).
Figure 10: Turkey Foreign Currency Bond Issuance by year
7000
14
6000
12
5000
Millions in USD Eq.
10
4000
8
BB+
3000 BB 6
BB
2000 4
1000 2
0 0
2010 2011 2012 2013 2014 2015 2016
EUR USD LT FX Credit Rating
Source: Bloomberg, Standard & Poor’s
51. The Turkish Treasury doesn’t engage in cross-currency swaps (CCSs), but uses them to
calculate what would be the USD cost-equivalent. Given the current level of the basis-swap
and the cost of credit risk, Turkey pays more for an obligation denominated in EUR compared
to a USD bond27.
25
It should be noticed that the international bond program is not the only tool Turkey uses for achieving its
benchmark; it also strategically employs project financing in EUR having in mind the total portfolio exposure.
26
In this context, having an investment grade is very helpful to be able to regularly access this market.
27
The same applies to the Japanese market in JPY, where Turkey has also been issuing at a slightly higher cost but
seeking the benefit from having a broader investor base. In this case, Turkey has recently issued three bonds with a
guarantee from the Japan Bank for International Cooperation (JBIC) and plans to access the market by itself in the
near future.
2152. In addition, Turkey finds value in choosing the ‘non-standard’ tenors for its placements
in Euros. Instead of being forced into the typical 10 or 30-year maturities of the USD market,
Turkey taps other tenors (for example, 6, 8 or 11-year sectors) which at times offer more
flexibility to manage its redemption profile. On the other hand, the EUR market makes it more
difficult to access the long-end of the curve.
53. Based on political and economic fundamentals, Turkey sees its financing in EUR strategic
in the long term. This rationale is complemented by the need to diversify its base of foreign
investors. Since the Turkish Treasury prefers to keep the currency benchmark internal, it is not
possible to state whether the current share of the EUR in the government debt portfolio is
bound to change in the future.
A change in the benchmark for the foreign currency debt: the case of Chile
54. Chile has a benchmark of 80% local currency and 20% foreign currency in the
government debt portfolio, but there is no quantitative target for the currency
composition of the FX debt. In addition to the mix between local and foreign currency debt,
the strategy focuses on increasing the share of nominal instruments versus inflation linkers.
Linkers currently represent 65% of the local currency debt and the target is to bring their share
down to 50%.
Figure 11: Debt composition by currency (millions USD)
100%
90%
80%
70%
60%
50%
40%
30%
20%
10%
0%
2004 2005 2006 2007 2008 2009 2010 2011 2012 2013 2014 2015
USD UF (Chile inflation-adjusted) CLP JPY EUR Other
Source: Ministry of Finance, Public Debt Office, Historical Debt Composition Statistics
55. FX debt had been traditionally denominated in USD until December 2014, when a
decision was made to diversify the FX debt by currency. This decision was based on four
factors: (i) The correlation of different currencies with copper prices; (ii) market depth and
externalities for the private sector; (iii) optical effect of low coupons; and (iv) financing costs
compared to USD.
22Figure 12: Chile Foreign Currency Bond Issuance by Year
1600
AA- AA- 14
1400
A+
12
1200
Millions in USD Eq.
10
1000
8
800
600 6
400 4
200 2
0 0
2010 2011 2012 2013 2014 2015 2016
EUR USD LT FX Credit Rating
Source: Bloomberg, Standard & Poor’s
56. Based on the econometric analysis, the authorities determined a basket of currencies
closely correlated with the copper price. The rationale for finding such a basket is the high
correlation between the Chilean peso and the copper price and the importance of copper exports
as a source of budget revenues, which was initially estimated at 7%. The analysis showed good
correlation with NZD, AUD, CHF, and EUR with results somewhat dependent upon the period
of analysis28.
57. Out of these four currencies, only the EUR offers a market with the depth needed to
produce externalities to the private sector. When deciding on the currency (ies) to issue, the
DMO also looked at the ability of corporates to issue in markets other than the USD. Given
rising rates in USD and the relative excess of liquidity in the EUR market, corporates were
also interested in exploring funding in EUR. This contrasted with markets such as NZD, AUD
or CHF, where there would be little interest and no advantages for the private sector. While
EUR did not offer the best correlation with copper, it was always ranked the 5th or 6th.
58. The lower coupons in EUR were also a factor of consideration, especially in the current
context of rising deficits. While it is true that this is a short-term consideration that leaves out
28
The rationale for the currency choice of the liabilities is the mirror image of what was done for the asset
allocation, which sought currencies uncorrelated, or, negatively correlated with the copper price and therefore with
the CHP. The logic being it is that in an economic downturn when deficits increase and the peso depreciates, the
buffer of the wealth fund rises in value. This is why the JPY is an appropriate choice for the assets and a poor one
for the liabilities.
23the impact of the exchange rate, a low-interest bill is particularly welcomed in times of tight
fiscal constraints.
59. Finally, authorities also consider the financing costs compared to USD. When considering
tapping a non-USD market, the DMO always computes the equivalent cost of funding in USD
using a CCS. Last year, this factor went against the funding in EUR, but cost considerations
were overridden by the benefits brought by the other three factors 29 . While currently, the
funding in EUR may be relatively expensive, the spread to the USD funding should gradually
narrow as investors get familiar with the issuer. In this context, the Chileans see the move
towards the EUR as a strategic one.
An important funding alternative for a large issuer: the case of Mexico
60. The key driver of Mexico’s debt management strategy since the Tequila crisis in 1994 has
been the development of the domestic debt market. Mexico has modified the composition
of the government debt portfolio to the point where four-fifths are denominated in local
currency. The Congress even discussed the possibility of ruling out the use of FX debt, but the
Ministry of Finance defended the need to have alternative funding sources to provide flexibility
to the government and avenues to reduce funding costs.
61. There is no explicit benchmark for the currency composition of the FX debt, but there
are internal targets derived from the cost-risk analysis. At the time of writing this note,
73% of marketable FX debt was denominated in USD and this share increases to 80% when
non-marketable debt is included. This currency composition is based on a Cost-at-Risk (CaR)
model where risk is driven by the volatility of exchange and interest rates. Exchange rates are
the main drivers of risk and the recent depreciation of the MXP close to 20% versus the USD
has increased the debt stock by 2% of GDP30. Over time, the government debt management
strategy has allowed the reduction of both exposures by increasing the share of the local
currency, reducing the share of floating rate loans and reducing short-term debt.
62. The CaR model quantifies the cost-risk tradeoff with cost modeled as expected cost and
risk as the volatility of that cost. The model finds value in the diversification brought by EUR
and JPY whose exchange rates versus the MXP have a negative correlation with the USD/MXP
rate. These negative correlations have helped contain the increase in debt service since 2015
when the MXP started falling versus the USD. According to the model, the share of the EUR
in the FX debt portfolio could be as high as 20%31.
29
For Chile, the EUR market was relatively expensive as illustrated by the recent issue priced at +110 over mid-
swaps compared to +65 of Poland that had a lower credit rating. According to the authorities, this was due to
investors being less familiar with Chile and possibly too concerned with the sovereign dependence on copper and
the gloomy perspectives for commodities in general. However, in the same placement Chile tapped simultaneously
EUR and USD markets and the book building went better for the EUR tranche (lower premium of 5-8 bps for EUR
vs 15-20 bps for USD).
30
Exposure to interest rates is lower because of the smooth redemption profile and the small share of variable rate
debt (limited to the loans contracted with multi/bilaterals).
31
According to the authorities, the FX portfolio included 16% EUR, 7% JPY and 4% GBP and the model indicated
there was room to increase the share of the EUR at the expense of the USD.
2463. While funding in EUR has been at times relatively expensive, the authorities are willing
to incur in the extra cost to access the benefits of entering the market in EUR. Based on
the CCS, issuing in EUR have been at times 20-60 bps more expensive compared to the USD,
but the authorities are willing to pay the extra cost because of the benefits of currency
diversification, the access to alternate sources of financing, and the externalities for the
corporates willing to fund themselves in EUR.
64. The benefits of investor diversification proved valuable for the government to meet its
funding requirements during the taper tantrum. When tapping the USD market was
difficult, Mexico opted for issuing in EUR, finding an appetite for a 30-year bond in 2014 and
then a 100-year one in 2015. The 100-year issue was opportunistic: at a time when yields for
Germany were negative all the way to the middle sector of the curve, Mexico offered paper
that attracted the interest of pension funds and insurance companies hungry for yield32.
Figure 13: Mexico USD and EUR Bond Issuance by Year
6000
14
5000
12
4000 10
Millions USD Eq.
BBB+ BBB+
BBB
8
3000
6
2000
4
1000
2
0 0
2010 2011 2012 2013 2014 2015 2016 2017
EUR USD LT FX Credit Rating
Source: Bloomberg, Standard & Poor’s
65. Diversification is also important because the Mexican government debt is relatively high and
rising, and so are the funding needs. Funding USD14 billion in a year in the USD market is not a
trivial task and at some point, the large supply may move prices against the issuer. By tapping
the EUR market, Mexico makes the funding program in USD more manageable while
achieving other objectives. For instance, lowering the issuance in the USD market may help
tighten the spreads, helping the sovereign reduce its funding costs.
32
Similarly, the funding in JPY is more expensive compared to USD but investors are typically buy and hold, giving
lower coupons and less volatility to the Mexican securities.
2566. Accessing the market in EUR has required a sustained effort to “sell” the name to
investors and a continued presence in the market. Taking advantage of its BBB+ credit
rating, Mexico has conducted regular roadshows and made sure that its securities are integrated
in the market indices. The authorities have found two distinctive pockets of investors:
insurance companies and pension funds, especially from Germany, that buy in the 9 to 30-year
sector; and French investment funds that look for paper in the 7 to 15-year sector.
67. Another significant justification for issuing in EUR arises from the externalities to
PEMEX and the corporate sector seeking a reference to access the market in EUR. As in
Chile, the tightening of the credit conditions for EMs in USD is reviving the interest of this
sector for borrowing in other currencies. By maintaining a presence in the EUR market, the
Mexican government offers a pricing reference (benchmark) for these companies to access
financing in EUR, which is an important externality to state-owned enterprises (SOEs) and the
private sector.
68. Up until now, the Mexican DMO has used derivatives essentially for managing interest
rate risk but not to manage the currency exposure. In principle, the DMO does not use
MXN/USD swaps because of the potential effects on the exchange rate. CCSs involving FX
currencies might be considered in the future on an opportunistic basis. As discussed, Mexico
takes the CCSs into account to make sure that alternative sources of financing offer reasonable
cost. However, Mexico looks at the absolute cost, not just the spread over mid-swaps, and if
the absolute level is attractive, then funding transactions are executed.
VI. Conclusion: strategy should come first
69. The divergent monetary policies of the FED and the ECB have increasingly driven more
sovereigns towards international bonds denominated in EUR. This trend is also true for
corporates and reflects the widening of the interest rate spread between the two currencies, the
strengthening of the USD versus the EUR, and contraction of the liquidity in the USD fixed
income market. The issuers have found easier conditions for book building of EUR obligations
and have stepped up their activity in this market to fulfill their funding plans.
70. The renewed interest in the EUR market by sovereigns in Latin America exemplify this
trend. Mexico started issuing in EUR in 2012, gradually extending the maturities until placing
a 100-years bond in 2015. Peru and Chile launched two transactions in 2016 after not having
issued in EUR for 10 years in the case of Peru and never in the case of Chile. Colombia
launched an obligation in 2016 after 15 years absent from the market in EUR.
71. Assessing the relative cost of funding by comparing the coupon rates of a EUR-
denominated bond with the rate of a USD-denominated one is tantamount to comparing
apples with oranges. While interest rates in different currencies cannot be compared, credit
spreads over reference rates can. For low rated EMs from out of the EUR region, credit spreads
and new issue premiums in EUR tend to be larger than in USD, reflecting the larger and more
liquid USD market. But for more established issuers in the EUR market, relative credit spreads
are similar and could favor either market depending on the timing.
26You can also read